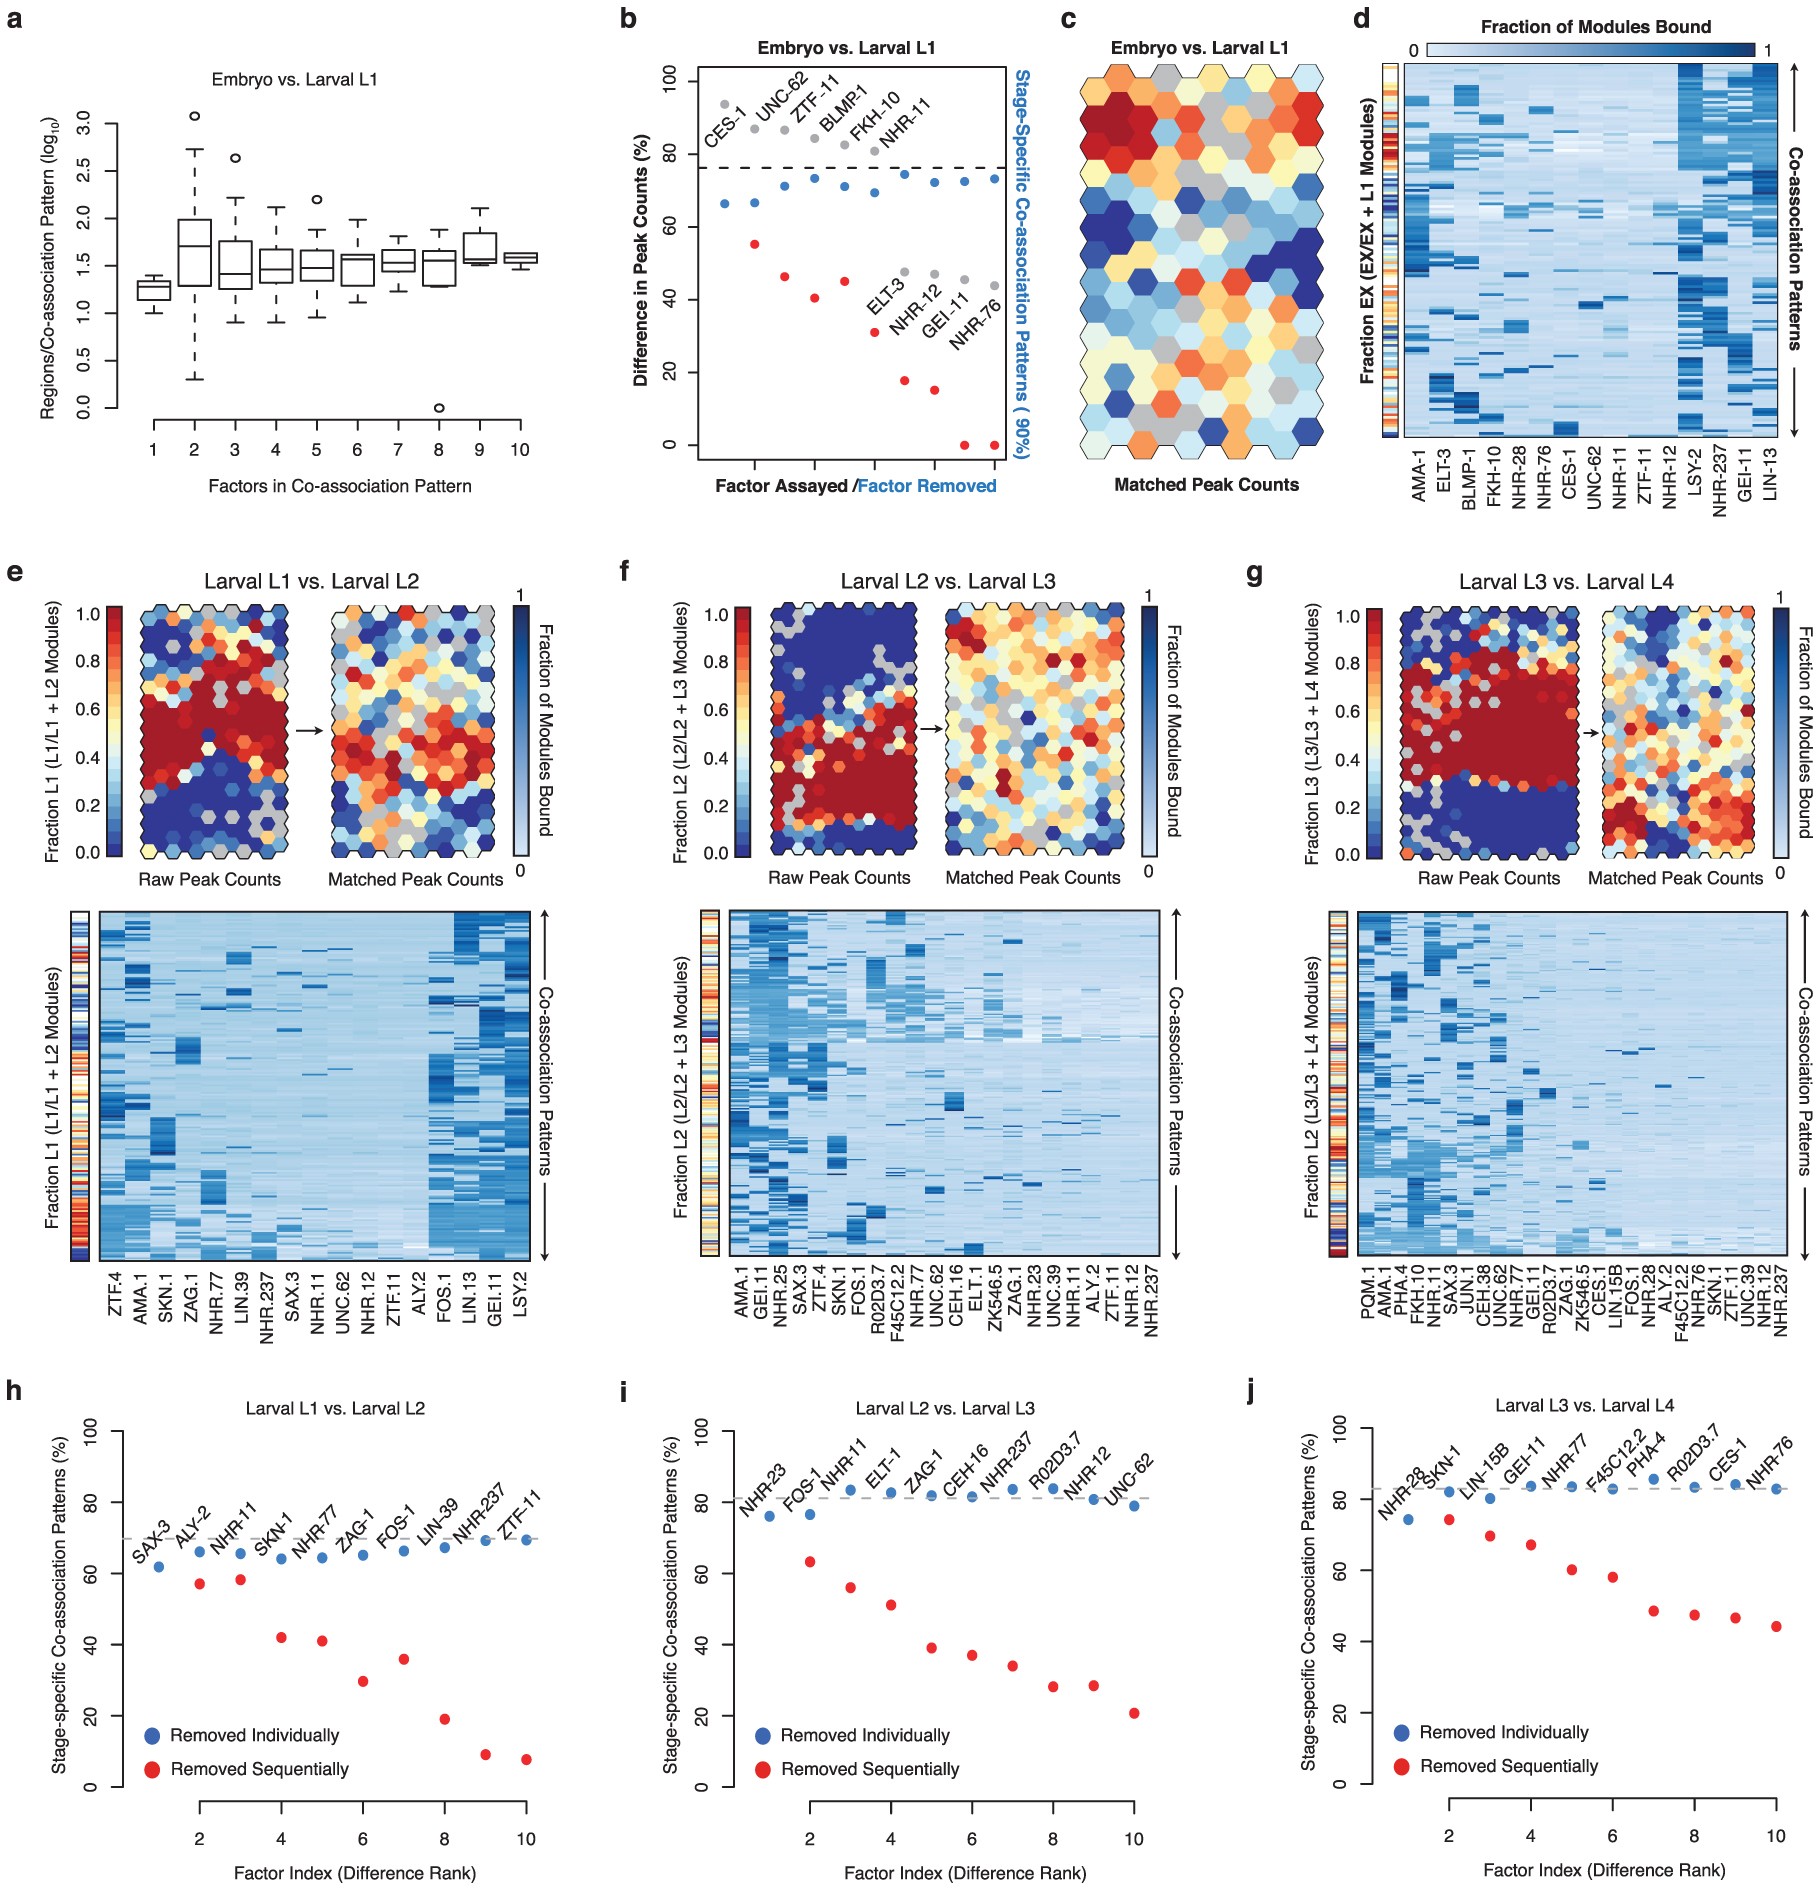
Extended Data Figure 7: Stage-comparison SOMs highlight patterns in the specificity of higher-order transcription factor co-associations.
From: Regulatory analysis of the C. elegans genome with spatiotemporal resolution

a, Abundance of co-association patterns is graphed as function of the number of factors in each co-association in stage-comparison SOMs for the embryo versus larval L1 stage comparison. Similar patterns are observed in all stage-comparisons SOMs. b, Difference in binding sites between embryos and L1 larvae for each factor (grey dots). The fractional difference, calculated as fraction of the larger set of binding sites represented by the difference in binding sites, is shown. Factors are rank-ordered by their difference in binding sites. The fraction of co-association patterns that are stage-specific (â¥90% embryonic or larval L1) in SOMs is indicated for the raw binding sites with all factors (Fig. 3a, dashed line), in SOMs with individual factors removed (blue), and in SOMs with factors sequentially removed (red). c, Embryonic and larval L1 binding SOM with matched numbers of binding sites. Briefly, binding data for the 15 factors assayed in the embryo and L1 larvae was sub-sampled to generate stage-specific binding modules with equal numbers of binding sites for each factor (see Methods). Stage-specific binding modules with matched binding sites were clustered in an SOM describing 140 co-association patterns. SOM is coloured as in Fig. 3a. d, Binding signatures (fraction of modules bound by each factor) are shown for each co-association pattern from c. Sidebar indicates the embryonic (versus L1) stage-specificity of each co-association pattern as in c. Stage-comparison SOMs with raw and matched binding sites are presented for the larval L1 versus L2 comparison (e), larval L2 versus L3 comparison (f), and larval L3 versus L4 comparison (g). Binding region comparisons are performed as in Fig. 3. Briefly, binding data for factors assayed in sequential stages are assigned to stage-resolved binding modules (that is, L1:I:10001174â10001734). Stage-resolved binding modules are clustered into SOMs describing shared and stage-specific co-association patterns. SOMs are colored by the T1 versus T2 (for example, L1 versus L2) stage-specificity of the learned co-association patterns, measured as the fraction of binding modules that are T1. T1- and T2-specific co-association patterns are shown in red and blue, respectively. Sidebars indicate the T1 (versus T2) stage-specificity of each co-association pattern. As in Fig. 3, SOMs with matched binding sites were generated by sub-sampling binding sites to generate stage-resolved binding modules with equal numbers of binding sites for each factor. For each comparison, the most representative sampling (from 100 iterations) was selected to seed SOM analyses. For each of the stage-comparison SOMs with matched binding sites (eâg), the matrix of learned co-association patterns (fraction of modules bound by each factor) are shown below each SOM. hâj, The fraction of co-association patterns that are stage-specific (â¥90% either stage) in SOMs is indicated for the raw binding sites with all factors assayed in both stages (dashed line), in SOMs with individual factors removed (blue), and in SOMs with factors sequentially removed (red) are shown for the larval L1 and L2 stage (h), larval L2 and L3 stage (i), and larval L3 and L4 stage (j) comparisons.