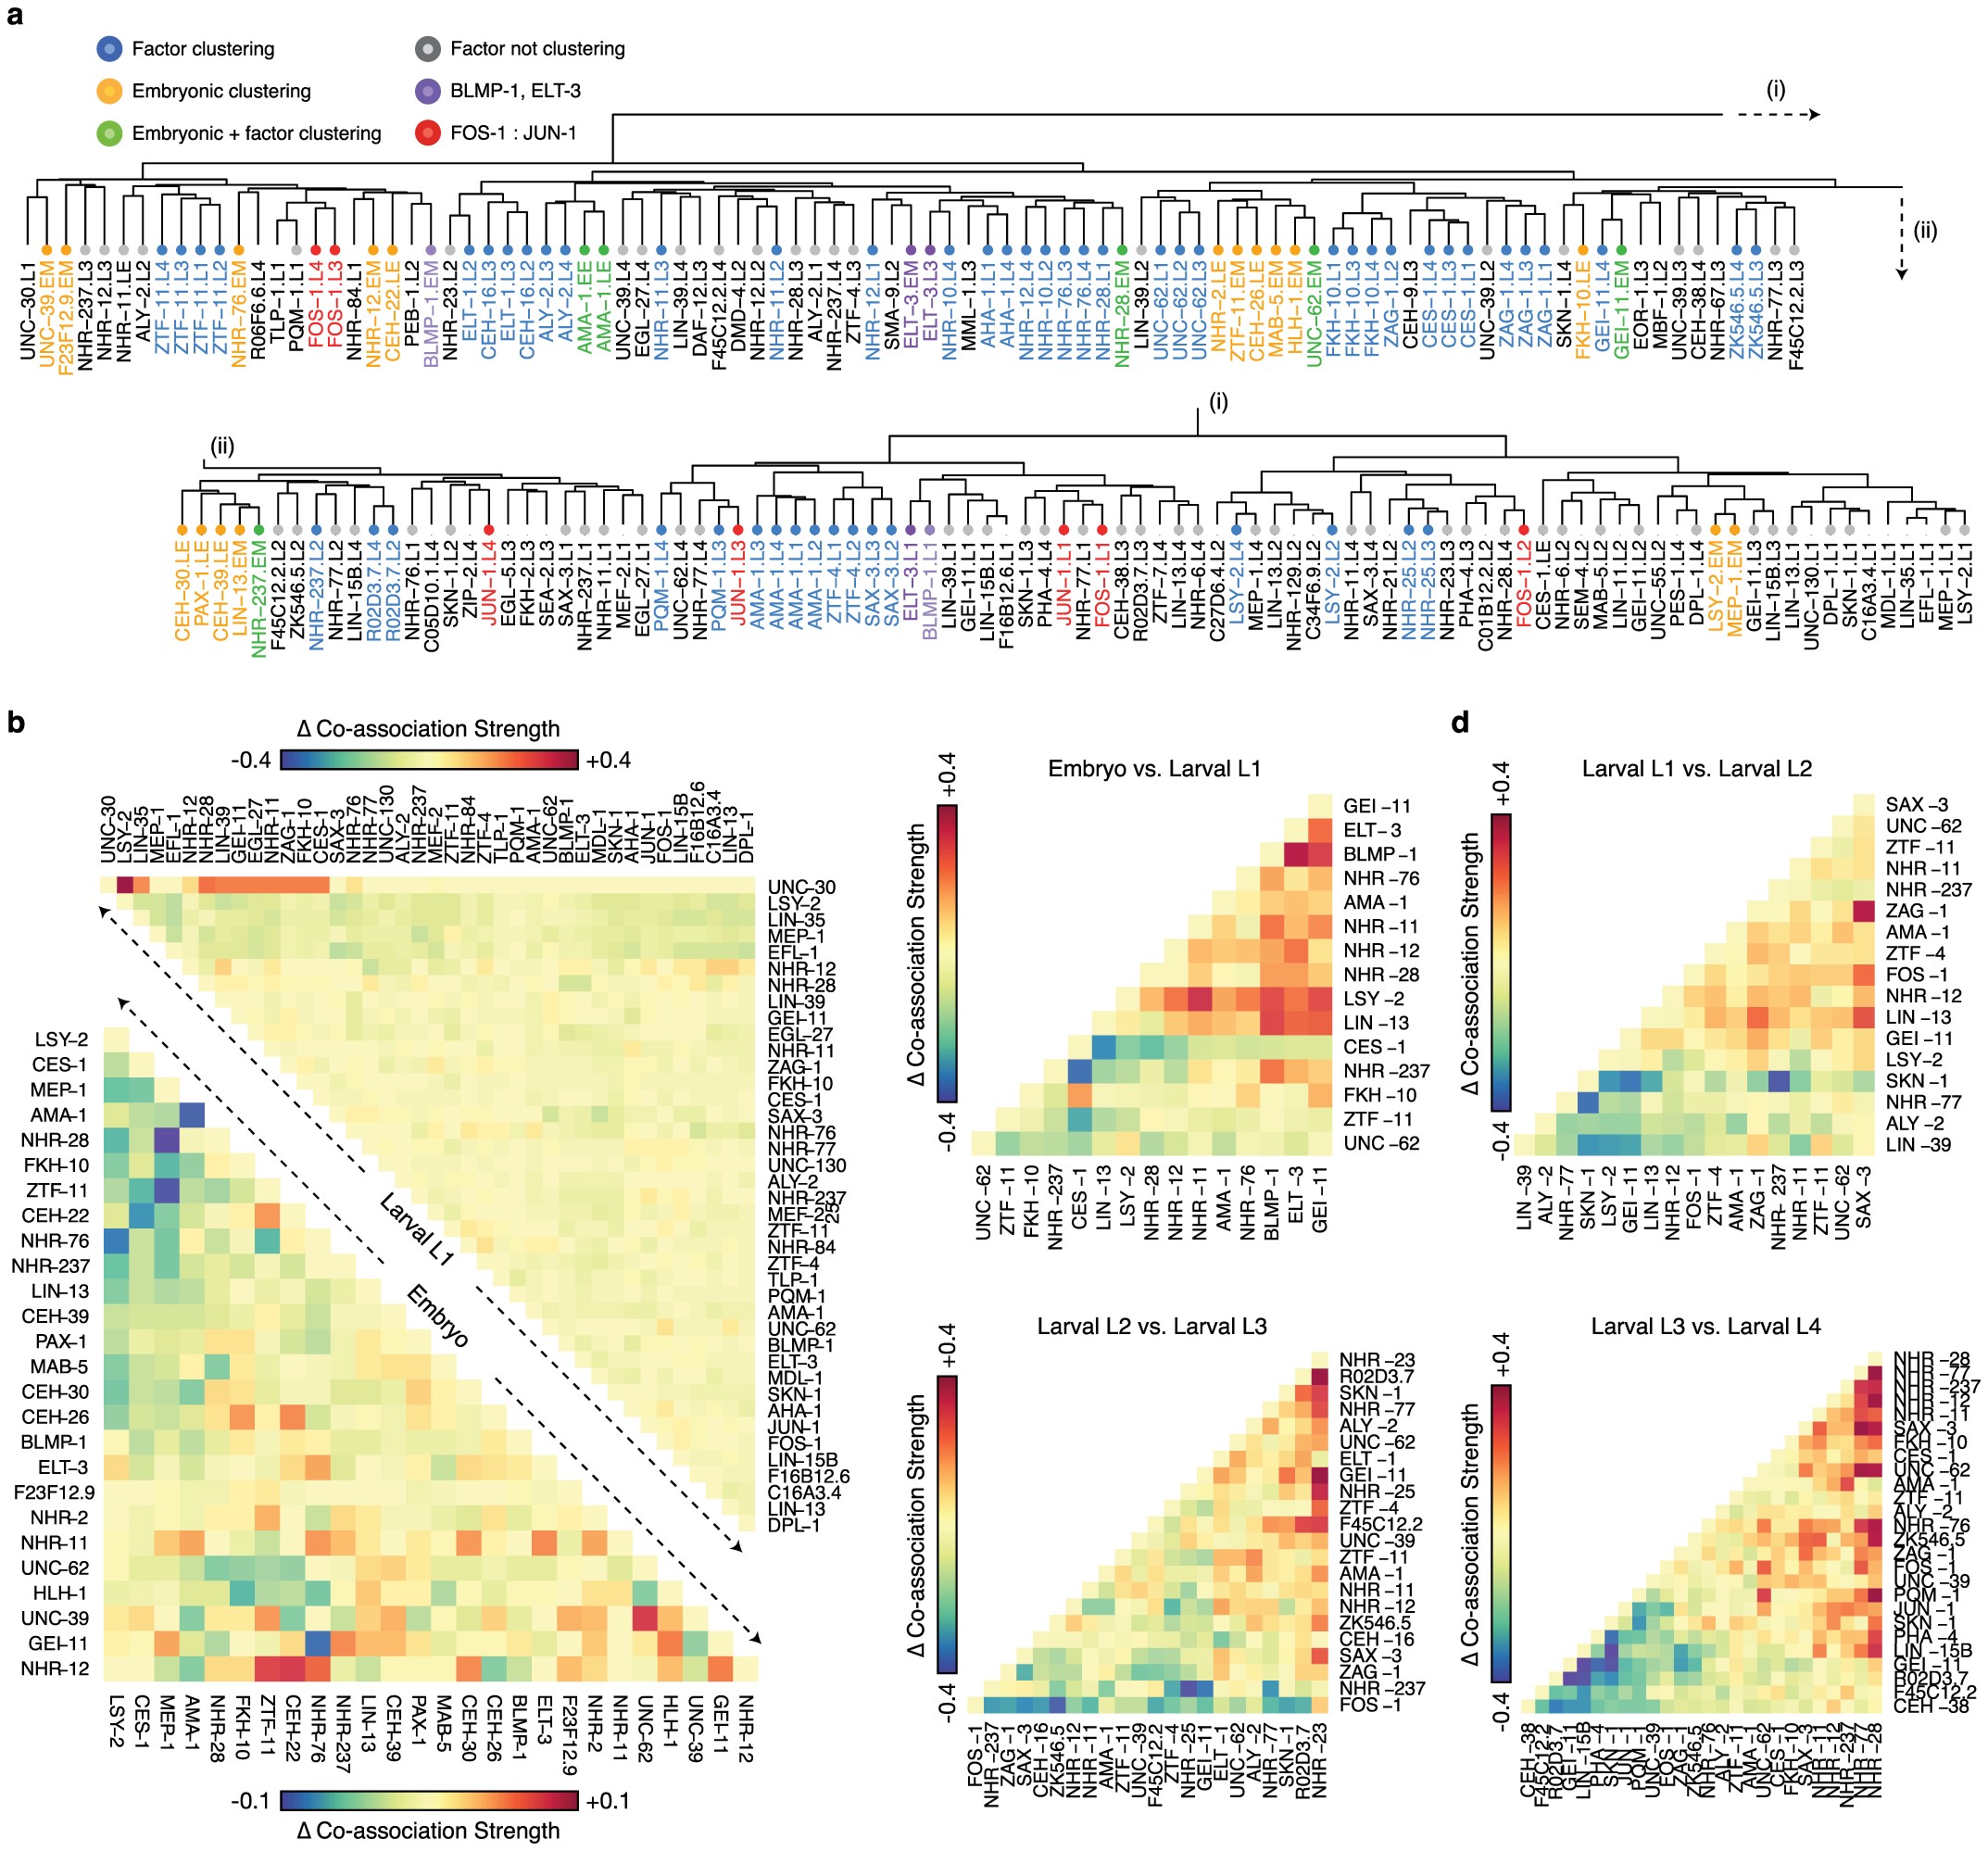
Extended Data Figure 5: Structure of global co-associations and changes between stages and domains.
From: Regulatory analysis of the C. elegans genome with spatiotemporal resolution

a, Clustering patterns in pairwise transcription factor co-associations. Clustered libraries from shared factors are coloured blue. Clustered embryonic libraries are coloured yellow. ChIP-seq libraries that cluster in embryonic groups and with distinct stages for the same factor are coloured green. BLMP-1 and ELT-3 libraries are colored purple. FOS-1 and JUN-1 libraries are coloured red. All other libraries are colored grey in the dendrogram. The clustering dendrogram is derived from Fig. 2a. b, Difference in pairwise transcription factor co-associations at expressed and repressed promoter domains. For embryonic and larval L1 stages, we computed co-association strength 2 kb upstream and 200 bp downstream domains of TSSs associated with expressed and repressed genes, from stage-specific binding experiments with IntervalStats24. For each comparison (and each domain), the difference in the strength of co-associations between the expressed and repressed domains is shown for embryo (bottom left) and larval L1 stages (top right). Positive values indicate stronger co-associations in the expressed domain whereas negative values indicate stronger co-associations in the domain of repressed promoters. câf, Change in pairwise transcription factor co-associations across sequential developmental stages. For factors assayed in sequential developmental stages, the difference in the co-association strengths for pairs of factors is shown. The change in co-association strengths are shown for the embryo to larval L1 (c), larval L1 to L2 (d), larval L2 to L3 (e), and larval L3 to L4 transitions (f). Co-association strengths for pairs of factors at each stage are derived from Fig. 2a.