
Abstract
Enhanced CO2 assimilation by forests as atmospheric CO2 concentration rises could slow the rate of CO2 increase if the assimilated carbon is allocated to long-lived biomass. Experiments in young tree plantations support a CO2 fertilization effect as atmospheric CO2 continues to increase. Uncertainty exists, however, as to whether older, more mature forests retain the capacity to respond to elevated CO2. Here, aided by tree-ring analysis and canopy laser scanning, we show that a 180-year-old Quercus robur L. woodland in central England increased the production of woody biomass when exposed to free-air CO2 enrichment (FACE) for 7âyears. Further, elevated CO2 increased exudation of carbon from fine roots into the soil with likely effects on nutrient cycles. The increase in tree growth and allocation to long-lived woody biomass demonstrated here substantiates the major role for mature temperate forests in climate change mitigation.
Main
Carbon uptake and storage by terrestrial vegetation is a major source of uncertainty in projections of future levels of CO2 in the atmosphere and the resulting effects on climate1,2. Multiple lines of evidence indicate that increasing atmospheric CO2 concentration in recent decades resulting from anthropogenic emissions and land use change have led to higher rates of CO2 uptake by plants, that is, the CO2 fertilization effect, including in forests, which dominate the terrestrial C cycle3,4. Evidence for forest responses to the atmospheric CO2 concentrations that will be attained in future decades comes from a limited number of decade-long free-air CO2 enrichment (FACE) experiments in which forest plots were exposed to elevated CO2 (eCO2). These âfirst generationâ forest FACE experiments5,6,7 were established in young tree plantations, and questions arise as to the extent to which their responses to eCO2, including increased growth and primary productivity, are predictive of the responses of older, more established forests8,9,10. There are multiple issues to consider. As forests develop over time, nitrogen, which is often the limiting resource in unmanaged temperate stands, becomes increasingly sequestered in wood or recalcitrant soil organic matter and unavailable to support plant growth, a phenomenon referred to as progressive nitrogen limitation (PNL)11,12,13. Furthermore, the development of PNL can be accelerated by eCO2 (ref. 14). PNL is of particular interest today because global atmospheric carbon and nitrogen sources are now moving in opposite directions15,16. Phosphorus limitation might be a critical influence on responses to eCO2 on sites with old, highly weathered soils9,17. Apart from nutrient limitations, older trees may be less responsive to eCO2 than younger trees because a smaller fraction of the biomass is live tissue contributing to growth.
The amount of biomass produced each yearâthe net primary productivity (NPP)âis a key metric for evaluating forest response to eCO2 and a benchmark for models18,19,20. If NPP increases in eCO2, the key question becomes whether the additional C accumulates in wood or instead is allocated to leaves and fine roots that turn over rapidly and release the C back to the atmosphere21. Carbon allocated to wood can persist in the ecosystem for policy-relevant time frames22,23, which provides negative feedback to atmospheric CO2. Over longer time frames and landscape scales, C sequestration depends not just on the effects of eCO2 on tree growth but also on the rate of tree mortality10, and some evidence suggests that increased growth rate may shorten a treeâs lifespan24,25. Nevertheless, the effect of rising CO2 on NPP and how it is allocated, as revealed in FACE experiments, is critical input to any evaluation of the interaction between terrestrial ecosystems and atmospheric CO2.
A common question being addressed across the âsecond generationâ forest FACE experiments is whether mature forests will respond to eCO2 (ref. 9). Although the definition of âmatureâ in this context is vague26, the new or developing FACE experiments in the Amazon forest in Brazil (https://amazonface.unicamp.br/), a Eucalyptus stand in Australia17 and a temperate maritime oak forest at the Birmingham Institute of Forest Research (BIFoR) in central England, UK27,28, are in forest stands that are centuries or more older than the young plantations in the ORNL FACE14 and DukeFACE experiments29 in southeastern United States. For example, the ORNL FACE and BIFoR FACE are both in temperate deciduous forests (albeit with different species) that had attained canopy closure, linear growth and reproductive maturity; however, the Quercus robur trees that dominate in BIFoR FACE are ~180âyears old compared with the 10â20-year-old Liquidambar styracilflua trees in ORNL FACE, and the stand structure is very differentâsimilar tree basal area per plot (34âcm2âmâ2) is concentrated in 5â7 trees per plot at BIFoR (average tree basal area of 3,486âcm2) compared with 90 trees at ORNL FACE (average tree basal area of 118âcm2) (ref. 30). Here we address whether this difference in age and stand structure precludes the response of tree growth to eCO2 at BIFoR FACE.
BIFoR FACE facility
The BIFoR FACE facility (https://www.birmingham.ac.uk/research/bifor/face/index.aspx, Extended Data Fig. 1) is located in central England (52.801°âN, 2.301°âW, 107âm above sea level). The 19âha Mill Haft deciduous forest woodland was established as a plantation of oak âstandardsâ (that is, timber trees) with hazel coppice in the mid-nineteenth century and has been very lightly managed since that time, the understory hazel trees being last coppiced in ~1985. About two thirds of the 400âha estate surrounding Mill Haft were arable and pasture until 2010, since when they have been converted into mixed broadleaf plantation and no-till organic herbal ley (a mixture of grasses, legumes and herbs) in roughly equal proportion31. The forest is dominated by 180-year-old Quercus robur L. trees, which represent 92% of the forestâs basal area. The forest canopy is 24â26âm high with a leaf area index of the overstory of ~6. The forest understory comprises Corylus avellana L. coppice, Acer pseudoplatanus L., Crataegus monogyna Jacq. and a few individuals of other broadleaf species32. The dominant soil is Dystric Cambisol with a sandy-clay texture. Underlying geology is a Helsby sandstone formation. Mean annual maximum and minimum temperatures (1991â2020) were 13.5 and 6.0â°C with 676âmm precipitation33. The FACE facility comprises six experimental arrays surrounding plots of ~30âm diameter. Disturbance to the woodland was avoided during construction of the FACE infrastructure, fitting the infrastructure between the trees so that no oak standards or coppice stools were removed and using no concrete foundations or guy wires27. CO2-enriched air (1â2% by volume) was released from vertical vent pipes in three of the arrays to attain a target CO2 concentration at plot centre that is 150âppm above ambient CO2. Actual daytime CO2 concentration enrichment during the 2017â2022 growing seasons (AprilâNovember) was 140â±â38âppm relative to ambient air due to occasional disruptions in CO2 supply. Full description of the FACE facility and its operating characteristics are available27.
Aboveground biomass production
Evaluation of treatment effects required accounting for pretreatment differences among plots. Tree-ring analysis (see Methods) revealed high variability in the size and growth of the 180-year-old Q. robur trees on plots within the experimental arrays (Fig. 1a), as is often typical of mature forest stands; this variability complicates detection of possible effects of eCO2 while underlining the realism of the BIFoR FACE context and increasing its applicability to other real-world forests. Furthermore, basal area increment (BAI) in plots randomly assigned to receive eCO2 starting in 2017 was significantly greater than in plots for ambient CO2 (aCO2) before the initiation of the CO2 treatment (Fig. 1b). Hence, these pretreatment differences were accounted for in evaluating treatment differences after eCO2 exposure was initiated. We used the average plot-specific BAI from 2011â2015 (based on tree-ring analysis) to normalize subsequent annual growth data, thereby accounting for site and stand differences that would otherwise obscure treatment effects. A departure in the normalized tree-ring chronologies between aCO2 and eCO2 plots was apparent beginning in 2017, the first year of eCO2 exposure (Fig. 1c).

a, Annual BAI of each tree. Orange lines are trees that began receiving elevated CO2 in 2017; blue lines are trees that remained in ambient CO2. b, Cumulative DMI per plot area since 2010; data are the means of trees in three ambient CO2 plots and three elevated CO2 plots ±s.e. c, Cumulative DMI adjusted by dividing data in b by the mean DMI from 2011 to 2015 relative to the overall mean for the period.
It has become clear that application of published allometric equations for temperate forests can create considerable errors in biomass estimation when applied to a different site with a different stand structure than that from which the relationship was established34. Therefore, we developed a site-specific allometry (Extended Data Fig. 2) on the basis of a terrestrial laser scan (TLS) of the site to calculate annual wood production from diameter measurements (see Methods). TLS provides highly accurate estimates of tree volume that are translated into estimates of aboveground biomass as long as internal stem damage is not large35 and tree cores did not indicate any internal stem damage. Annual diameter increments as measured in the field with manual dendrometers and calipers were consistent with independent measures using automated dendrometers that measure circumference changes continuously (Extended Data Fig. 3) and with the tree-ring chronologies. Dry matter increment (DMI) per tree, as calculated from diameter and adjusted by pretreatment differences among plots, was greater in eCO2 than in aCO2 for every year of CO2 enrichment except for 2019 (Fig. 2); over the 7âyears of treatment, tree growth was 9.8% greater in eCO2. The loss of response in 2019 may have been related to differential defoliation by the winter moth (Operophtera brumata L.) and other foliar feeding insects, which was greater in eCO2 based on litter trap collections36 (Extended Data Fig. 4). There was also an insect outbreak in 2018, which was not seen in the litter collection data and had no apparent effect on the growth response. Although the apparent difference in DMI in any year was not statistically significant, repeated measures analysis indicated a significant CO2 effect over the 2017â2023 period (Pâ=â0.028, F1,4â=â5.48). Total DMI over the experimental period was linearly related to tree size (basal area), with no clear discontinuities in the relationship or in the distribution of ambient vs elevated trees around the distribution (Extended Data Fig. 5).
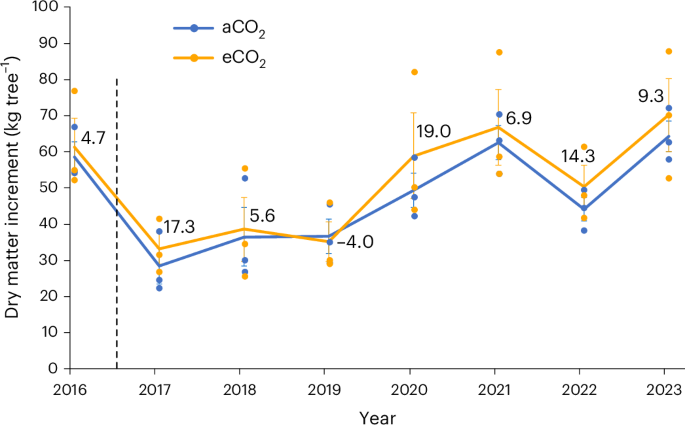
Data are the meanâ±âs.e. of trees in three plots each in ambient CO2 (blue) and elevated CO2 (orange). Numbers above the points represent the percentage increase (or decrease) in eCO2 relative to aCO2. CO2 exposure began in 2017; pretreatment (2016) data calculated from tree-ring analysis. Repeated measures analysis of variance indicated that the effect of CO2 was significant at Pâ=â0.0279, F1,24â=â5.48; CO2âÃâyear was not significant (Pâ=â0.830, F6,24â=â0.46).
Net primary productivity
With additional data on fine-root and leaf mass production, understory production, reproductive output and exudation (see Methods), NPP and its response to eCO2 were estimated for 2021 and 2022, the 5th and 6th years of eCO2 treatment (Table 1). Aboveground Q. robur wood production comprised the largest fraction (40â48%) of NPP, followed by leaf production and fine-root production. After accounting for pretreatment differences in wood and leaf production, total NPP was 9.7% greater in eCO2 in 2021 and 11.5% greater in 2022, but neither of these differences were statistically significant (Pâ>â0.20). Given the variance structure of the forest stand in the six plots, a CO2 enhancement of 45% would have been required in a given year to achieve a statistically significant (Pâ<â0.05) difference, greatly exceeding what has been observed in previous forest FACE experiments5. Alternatively, given the measured means and variance, 28 arrays per treatment would have been required to achieve type I and II errors of 0.05 and 0.20. Taking the 2âyears together in a repeated measures framework, NPP increased 10.6% (Pâ=â0.099, F1,4â=â4.56), equivalent to ~1.7 tonnes dry matter per hectare per year.
Most of the observed increase in NPP was attributable to wood production; there was no difference in fine-root or leaf mass production, although standing stock of fine roots may have been greater and turnover slower in eCO2. Leaf mass per unit area (LMA) was ~10% greater and oak leaf area index (LAI) was 5% less in eCO2 (Table 2). LAI in fully occupied sites with relatively high LAI is not expected to increase in eCO2 (ref. 37). Significant increases in fine-root production are common in forest FACE experiments37 but have mainly been observed as a response to eCO2 in nutrient-limited forest ecosystems38. Although increased fine-root production was reported from measurements predominantly under stools of coppiced C. avellana in years 1 and 2 of the BIFoR FACE CO2 treatment39, the absence of a sustained increase in the BIFoR experiment is not unexpected, given that the BIFoR FACE forest does not appear to be N-limited (discussed further below). Nevertheless, there was evidence of increased carbon allocation belowground as exudation. Exudation of organic carbon from roots is a component of NPP but is rarely included in estimates, given the difficulty in measuring and upscaling exudation. We measured rates of net exudation four times between August 2020 and June 2021 (see Methods) and scaled data expressed as grams C per unit root mass to grams dry mass equivalent per m2 land on the basis of fine-root mass per unit area from soil cores collected in 2021 and 2022; we assumed that exudation rate in the organic horizon applied equally to deeper roots and that the average of four measurements in spring, summer and autumn reflected the average exudation rate during the 264-day growing season. Exudation flux was 63% greater in eCO2 in 2021 (Pâ=â0.13) and 43% greater in 2022 (Pâ>â0.20); repeated measures analysis indicated a significant overall effect (Pâ=â0.042, F1,4â=â8.64).
Discussion
The responses observed in FACE experiments require careful consideration of temporal and spatial scales and levels of biological complexity before their implications for the global carbon cycle and feedbacks to climate change can be properly interpreted. Forest responses to eCO2 start with an enhancement of leaf-level photosynthesis, as has been documented at BIFoR FACE32. In many forest systems, the enhancement of photosynthesis scales up to increased NPP4, although nutrient limitations can inhibit the translation of increased photosynthesis to increased NPP17. At BIFoR FACE there is evidence of increased NPP in eCO2 over 2âyears, a response that may become statistically more compelling if it is sustained for more years. It has long been recognized that although NPP might be enhanced by eCO2 in most terrestrial ecosystems, a more important question is whether an eCO2 response results in greater wood mass or instead is allocated to fast-turnover pools (for example, leaves and fine roots)21. Aboveground woody biomass is the component of NPP that is most relevant for decades-long (and policy relevant) carbon balance evaluations and the basis of evaluations of past responses to eCO2. Much of the carbon allocated to wood (other than that in small cast-off branches) will persist in the ecosystem for many decades, whereas much of the carbon allocated to the fast-turnover tissues will quickly return to the atmosphere, although leaf and fine-root necromass also contribute to recalcitrant soil organic matter. At BIFoR FACE, additional carbon taken up in response to eCO2 through the stimulation of leaf-level photosynthesis32 accumulated in wood, with no increases observed in production of leaves and fine roots. Long-term C sequestration is also determined by tree turnover25, which cannot be assessed at the scale of FACE experiments, but model simulations coupled with inventory analysis in unmanaged temperate forests demonstrated that enhanced tree growth increases biomass stocks despite simultaneous decreases in carbon residence time and tree longevity10.
Our results contrast with those of EucFACE, where no increases in dry matter accumulation or NPP were observed17. BIFoR FACE results argue against a general conclusion that older, mature forest systems have no capacity for response to eCO2. The difference in response between these two experiments is more likely related to nutrient dynamics rather than simply stand age or maturity. EucFACE responses are thought to be limited by a phosphorus deficiency17, and mature northern temperate forests are generally thought to be nitrogen limited. However, no clear nitrogen or phosphorus limitation has yet been documented at BIFoR FACE, and leaf nitrogen content has been maintained40, although further investigationâand indeed further CO2 treatmentâcould change these assessments. As a result of surrounding agricultural activities and regional industry, nitrogen deposition at the BIFoR FACE site is relatively high at 22âkgâhaâ1 (ref. 41) and not atypical of northern temperate forests. This subsidy of reactive nitrogen may be providing sufficient nitrogen supply to support increased carbon fixation. Furthermore, enhanced soil nitrogen transformations42 supported by increased release of bioavailable carbon from root exudation, may be allowing the trees to meet their nitrogen demand under eCO2. Although exudation comprised just 4â7% of total NPP, this flux of highly labile organic C is disproportionately important to ecosystem biogeochemistry. For example, exudation can increase the availability of labile C, priming the microbial community and associated nitrogen and phosphorus cycling43,44. Measurements on site have shown that net nitrogen mineralization increased on average by 30% under elevated eCO2, delivering an extra 24âkgâNâhaâ1âyrâ1 (ref. 45). However, it is possible that the supply of bioavailable nitrogen sourced from decomposition of soil organic matter may be reduced and eventually exhausted over time. Furthermore, nitrogen deposition is declining in the UK15 and throughout the Global North46. Although at present nitrogen does not appear to be a limiting factor to tree growth or response to eCO2, nitrogen limitation may develop at BIFoR FACE as the nitrogen cycle gets tighter and plant demand increases, as was observed in a previous FACE experiment14. Furthermore, high rates of N deposition have been shown to stimulate P acquisition and alleviate potential P limitation47, so it is possible that if N deposition declines, P limitation could develop over time.
These BIFoR FACE results have illustrated the importance of and challenges in documenting meaningful ecosystem-scale responses to eCO2 in mature forests that are inevitably heterogenous in tree size, productivity and spatial distribution, and in experiments in which engineering constraints limit plot size and financial constraints limit replication and duration. Employing multidecadal tree-ring analysis to account for plot differences before the onset of the CO2 treatment markedly improved our confidence in attribution of eCO2 effects. A single year of observation is unlikely to provide convincing evidence of a tree growth or NPP response of the expected possible magnitude; sustained and consistent response over multiple years is necessary. Assessment of dry matter increment is highly dependent on the allometric relationship used to scale non-destructive measurements of tree diameter to biomass. A harvest of trees at the experimental site is precluded, as it is in most forest FACE experiments. Reliance on published allometric equations developed in forests with different stand structures can introduce significant uncertainty in assessment of forest carbon stocks34 and is especially problematic for larger, more mature stands. The development of site-specific allometry developed from non-destructive estimates of Q. robur tree volume using terrestrial laser scanning significantly increased our confidence in the assessment of tree biomass in BIFoR FACE.
Our results directly refute the notion that mature forests cannot respond to eCO2, and they emphasize that the important issue is allocation of any increased carbon uptake and the turnover of the tissues that benefit most21. Hence, the evidence from BIFoR FACE of a significant increase in woody biomass production is a key result supporting the role of mature forest stands as decadal C stores10 and, hence, as natural climate solutions in the coming decades while society undertakes deep decarbonization48. Quantifying the CO2 fertilization effect is important for predictions of future atmospheric CO2 concentrations and the policy decision that derive therefrom, but even if the increase in tree growth translates to a longer-term increase in C storage in the ecosystem, CO2 fertilization cannot be seen as reason to delay reductions in fossil fuel consumption.
Methods
Wood production
Every tree with greater than 10âcm diameter at breast height (DBH) within the array of vent pipes was fitted with a dendroband49 at 1.3âm height, or as close as possible to 1.3âm as necessary to avoid a large branch or stem abnormality. Forty-three trees were outfitted in 2016 and five trees were fitted in later years. The initial tree diameter (D) and initial offset of the dendroband were recorded, and the dendroband offset was measured approximately bimonthly between early spring (before leaf out) and late autumn with digital calipers. Diameter and basal area increments (BAI; BAâ=âÏâÃâ(D/2)2) were calculated from the change in circumference and initial diameter.
Previous analysis of tree biomass at this site employed a published allometric equation for Q. robur from ref. 50, which was based primarily on trees harvested in northwestern Spain. This approach was not considered reliable because the largest tree in that data set was smaller than 49% of the BIFoR FACE Q. robur trees. Instead, we established a site-specific allometry on the basis of terrestrial laser scans (TLS). Three-dimensional point clouds of the forest stands were collected within the six experimental arrays in January and February 2022, when canopy was in leaf-off condition, using a RIEGL VZ-400i laser scanner (RIEGL Laser Measurement Systems). Registration of separate scans was done in the RiScanPro software (RIEGL) and manual extraction of single trees from the co-registered point cloud was done in CloudCompare (https://www.cloudcompare.org/). Determining appropriate parameters for, and the construction of, the Quantitative Structure Models (QSMs) with subsequent calculation of component volumes was done using the open-source software of optQSM (https://github.com/apburt/optqsm) and TreeQSM, v.2.4.1 (https://github.com/InverseTampere/TreeQSM), respectively. The optimal cylinder model per tree was selected on the basis of the lowest point model distance out of the five iterations. Tree volume was calculated as the sum of bole and branch volume, and volume was converted to dry mass using a wood density of 0.58, an average of trunk and branch density reported for Q. robur51. The regression of ln(biomass, kg) vs ln(diameter, cm), with diameter being that calculated from dendroband measurements in December 2021 is: ln(biomass, kg) = 2.312âÃâln(diameter, cm)âââ1.0863; r2â=â0.77 (Extended Data Fig. 2).
Aboveground wood mass (kg) of other species was calculated using allometric equations from ref. 50, where Mstem is dry matter (kg) and D is diameter (cm):
Annual wood production per tree was calculated as the dry matter increment (DMI) during the year.
Coarse root production for understory species was calculated similarly using the equation50:
The equation50 for Q. robur coarse root biomass [ln(Mroot)â=ââ2.863â+â2.208âÃâln(D)] is assumed to be inaccurate to the same extent as the difference between the equivalent aboveground equation50 [ln(Mstem)â=ââ2.9128â+â2.7442âÃâln(D)] and the site-specific TLS-based allometry (Extended Data Fig. 2), which varied from 56% greater to 40% less. Hence, Q. robur coarse root biomass was calculated by multiplying aboveground biomass (from the TLS allometry) by the ratio of coarse root to aboveground biomass from the published50 equations.
DMI of the multistemmed stools of coppiced Corylus avellana was determined by measuring the five thickest sprouts on each hazel stool within the plots irrespective of whether their DBH was below 10âcm, as described52. Coarse root production of C. avellana was not estimated as a function of D but was assumed to be 26% of aboveground wood production, as determined from the other understory species.
DMI of the Q. robur trees and understory species was expressed per m2 by dividing total DMI by plot area. The area of the plots, which were not circular to avoid removing large trees during construction, was determined as the area of an irregular polygon with the vertices set to maintain at least a 2.5âm buffer from any vent pipe in the experimental array. The resulting areas as determined with ArcGIS ranged from 574âm2 to 678âm2. DMI was adjusted for pretreatment differences using tree core analysis as described below.
Tree-ring analysis
Increment cores (~4âmm diameter) were collected from the Q. robur trees to provide a pretreatment time series of BAI. Cores were collected in June 2021 and August 2022 from the south side of the tree at ~1.3âm height. The cores were stored temporarily in straws and air dried before preparation and ring width measurement. The cores were surfaced using progressively finer grades of abrasive paper to reveal the ring boundaries. Ring widths were measured under magnification using TSAP-Win software (Rinntech) to 1/100âmm. The series were measured in duplicate and internally cross-matched. Tree diameter (not including bark) from 2019 to 2010 was back calculated by sequentially subtracting (2âÃâring width) from each yearâs calculated diameter, starting with the measured diameter in 2020 minus (2âÃâaverage bark thickness). BAI from 2011 to 2020 was then calculated as the annual increase in BA, with BAâ=âÏD2/4. To account for pretreatment differences in tree growth across the six plots, the total BAI of each tree from 2011 to 2015 was averaged for each plot, and the relative difference from the overall average BAI for 2011â2015 was used to normalize the data between plots to the site average pretreatment level. The BAI calculated from ring width analysis was on average 15% less than BAI from dendrobands. This is probably because the dendrobands that integrate information on the entire tree circumference are subject to moisture-dependent fluctuations in tree volume and include measures of inner and outer bark thickness, which were not included in the ring width analysis of the air-dried cores.
Leaf production
Leaf production was determined from leaf litter mass. Leaf litter was collected in two or three 1âm2 traps per plot (2016â2020) and six 0.25âm2 traps (2020â2022). Litter was collected monthly from March to October and weekly from mid-October to mid-December, separated by species, oven dried and weighed. Some leaves were retained on the trees and fell during the winter and early spring. Hence, annual litter mass production was calculated as the litter collected from April through March. Leaf production exceeds litter mass because of resorption of N-rich organic compounds during senescence. On the basis of the difference in N concentration between green leaves and litter and assuming N is resorbed as glutamate, green leaf production was set to be 14% greater than litter production. Leaf production in 2017â2021 was relativized to pretreatment (2016) values to account for spatial differences.
Flower and fruit production
Flowers and fruit were collected from the litter baskets as described above, dried and weighed. This material comprised flowers, enlarged cups (that is, cups with visible premature acorns), immature acorns, fully mature acorns, empty cups (that is, empty acorn cups without acorns) and galls (acorn development prevented by insect attack).
Fine-root production
Fine-root production was measured from in-growth cores. Five 5âcmâÃâ30âcm (diameterâÃâlength) mesh columns filled with root-free soil from the O horizon (0â7âcm depth, 0.64âgâcmâ3), A horizon (7â16âcm depth, 1.03âgâcmâ3) and B horizon (16â30âcm depth, 1.30âgâcmâ3) were installed in each plot. Cores were retrieved and replaced every 4â5âmonths. Fine roots (<2âmm diameter) were removed from the soil, oven dried and weighed. To extend the fine-root production from the 30âcm deep cores to 1âm depth, adjacent soil cores were collected to 1âm depth and fine-root mass quantified. Production in in-growth cores was extended to 1âm on the basis of the fraction of total fine-root standing crop in the top 30âcm (~65%).
Exudation
Root exudation was measured four times between August 2020 and June 2021. Q. robur roots in the O horizon were identified on the basis of surveys of root morphology outside of experimental arrays. Root boxes within 1âm of Q. robur trees were installed to permit access to new root growth during this period, and exudates were collected from six root systems per plot. The collection procedure was adapted from ref. 53. Roots (<2âmm diameter) were washed with a nutrient solution (carbon free, NH4NO3 40âmgâlâ1; KH2PO4 13.6âmgâlâ1; K2SO4 349âmgâlâ1; CaCl2 441âmgâlâ1 and MgSO4.7H2O 0.3705âgâlâ1) to remove adhered soil and placed in a glass syringe filled with glass beads (750âμm) and nutrient solution (10âml) to mimic the soil environment. Roots were allowed to recover for 48âh, then the nutrient solution was replaced (carbon and nitrogen free, KH2PO4 13.6âmgâlâ1; K2SO4 349âmgâlâ1; CaCl2 441âmgâlâ1 and MgSO4.7H2O 0.3705âgâlâ1). Exudates were collected for 24âh and the nutrient solution was analysed for dissolved organic carbon content (Shimadzu TOC-L Organic Carbon Analyzer, LOD 0.01âmgâCâlâ1). Roots were dried (40â°C for 48âh) to determine dry mass. Net exudation per gram of dry root per m2 was calculated using fine-root standing stock from soil cores (nâ=â5) collected within 1â2âweeks of the exudate collections. To support inclusion of exudation in the calculation of NPP, mass of carbon in exudates was converted to equivalent dry matter units assuming a carbon content of 48%, and the rate per day was scaled to a 246-day growing season. Fine-root mass measured in soil cores sampled in 2022 was used to scale the exudation rates for 2022.
Statistics
Statistical analyses were performed with Stata software. The effect of CO2 on dry matter increment from 2017 to 2023 was analysed by repeated measures analysis of variance, with plot as the experimental unit and year as the repeated measure. Individual years and the total over the treatment years were analysed using two-sided t-test. NPP was analysed similarly, except that only 2âyears were included in the repeated measures analysis. The Stata command for repeated measures analysis of DMI (and similarly for NPP) was: anova dmi co2 plot|co2 year year#co2.
Reporting summary
Further information on research design is available in the Nature Portfolio Reporting Summary linked to this article.
Data availability
All data are publicly available without restriction at Dryad (https://datadryad.org/stash) at https://doi.org/10.5061/dryad.z612jm6jw (ref. 54). Biological samples (leaf litter, tree cores) were collected at the BIFoR research site (52.801塉N, 2.301塉W) and are archived at the University of Birmingham.
Code availability
Quantitative structure models and calculation of tree volume from TLS data (QSMs) used the open-source software optQSM (https://github.com/apburt/optqsm) and TreeQSM v.2.4.1 (https://github.com/InverseTampere/TreeQSM).
References
Arora, V. K. et al. Carbon-concentration and carbon-climate feedbacks in CMIP6 models and their comparison to CMIP5 models. Biogeosciences 17, 4173â4222 (2020).
Friedlingstein, P. et al. Uncertainties in CMIP5 climate projections due to carbon cycle feedbacks. J. Clim. 27, 511â526 (2014).
Schimel, D., Stephens, B. B. & Fisher, J. B. Effect of increasing CO2 on the terrestrial carbon cycle. Proc. Natl Acad. Sci. USA 112, 436â441 (2015).
Walker, A. P. et al. Integrating the evidence for a terrestrial carbon sink caused by increasing atmospheric CO2. New Phytol. 229, 2413â2445 (2021).
Norby, R. J. et al. Forest response to elevated CO2 is conserved across a broad range of productivity. Proc. Natl Acad. Sci. USA 102, 18052â18056 (2005).
Free-Air CO2 Enrichment Experiments: Results, Lessons, And Legacy (US Department of Energy, 2020).
Medlyn, B. E. et al. Using ecosystem experiments to improve vegetation models. Nat. Clim. Change 5, 528â534 (2015).
Körner, C. et al. Carbon flux and growth in mature deciduous forest trees exposed to elevated CO2. Science 309, 1360â1362 (2005).
Norby, R. J. et al. Model-data synthesis for the next generation of forest free-air CO2 enrichment (FACE) experiments. New Phytol. 209, 17â28 (2016).
Marqués, L. et al. Tree growth enhancement drives a persistent biomass gain in unmanaged temperate forests. AGU Adv. 4, e2022AV000859 (2023).
Comins, H. N. & McMurtrie, R. E. Long-term response of nutrient-limited forests to CO2 enrichmentâequilibrium behavior of plant-soil models. Ecol. Appl. 3, 666â681 (1993).
Johnson, D. W. Progressive N limitation in forests: review and implications for long-term responses to elevated CO2. Ecology 87, 64â75 (2006).
Luo, Y. et al. Progressive nitrogen limitation of ecosystem responses to rising atmospheric carbon dioxide. Bioscience 54, 731â739 (2004).
Norby, R. J., Warren, J. M., Iversen, C. M., Medlyn, B. E. & McMurtrie, R. E. CO2 enhancement of forest productivity constrained by limited nitrogen availability. Proc. Natl Acad. Sci. USA 107, 19368â19373 (2010).
Fernández-MartÃnez, M. et al. Atmospheric deposition, CO2, and change in the land carbon sink. Sci. Rep. 7, 9632 (2017).
Tipping, E. et al. Long-term increases in soil carbon due to ecosystem fertilization by atmospheric nitrogen deposition demonstrated by regional-scale modelling and observations. Sci. Rep. 7, 1890 (2017).
Jiang, M. K. et al. The fate of carbon in a mature forest under carbon dioxide enrichment. Nature 580, 227â231 (2020).
Hickler, T. et al. CO2 fertilization in temperate FACE experiments not representative of boreal and tropical forests. Glob. Change Biol. 14, 1531â1542 (2008).
Walker, A. P. et al. Comprehensive ecosystem model-data synthesis using multiple data sets at two temperate forest free-air CO2 enrichment experiments: model performance at ambient CO2 concentration. J. Geophys. Res. Biogeosci. 119, 937â964 (2014).
Haverd, V. et al. Higher than expected CO2 fertilization inferred from leaf to global observations. Glob. Change Biol. 26, 2390â2402 (2020).
Strain, B. & Bazzaz, F. in CO2 and Plants: The Response of Plants to Rising Levels of Atmospheric Carbon Dioxide (ed. Lemon, E. R.) 177â222 (Westview, 1983).
McCarroll, D. & Loader, N. J. Stable isotopes in tree rings. Quat. Sci. Rev. 23, 771â801 (2004).
Walker, A. P. et al. Decadal biomass increment in early secondary succession woody ecosystems is increased by CO2 enrichment. Nat. Commun. 10, 454 (2019).
Brienen, R. J. W. et al. Forest carbon sink neutralized by pervasive growth-lifespan trade-offs. Nat. Commun. 11, 4241 (2020).
Körner, C. A matter of tree longevity. Science 355, 130â131 (2017).
Martin, P. et al. Can we set a global threshold age to define mature forests? PeerJ 4, e1595 (2016).
Hart, K. M. et al. Characteristics of free air carbon dioxide enrichment of a northern temperate mature forest. Glob. Change Biol. 26, 1023â1037 (2020).
MacKenzie, A. R. et al. BIFoR FACE: water-soil-vegetation-atmosphere data from a temperate deciduous forest catchment, including under elevated CO2. Hydrol. Process. 35, e14096 (2021).
McCarthy, H. R. et al. Re-assessment of plant carbon dynamics at the Duke free-air CO2 enrichment site: interactions of atmospheric CO2 with nitrogen and water availability over stand development. New Phytol. 185, 514â528 (2010).
Norby, R. J. et al. Forest stand and canopy development unaltered by 12 years of CO2 enrichment. Tree Physiol. 42, 428â440 (2021).
Bradwell, A. R. Norbury Park: An Estate Tackling Climate Change (Norbury Park Estate, 2022).
Gardner, A., Ellsworth, D. S., Crous, K. Y., Pritchard, J. & MacKenzie, A. R. Is photosynthetic enhancement sustained through three years of elevated CO2 exposure in 175-year-old Quercus robur? Tree Physiol. 42, 130â144 (2022).
The CEDA Archive (CEDA, 2023).
Calders, K. et al. Laser scanning reveals potential underestimation of biomass carbon in temperate forest. Ecol. Solut. Evid. 3, e12197 (2022).
Calvert, J. et al. Modelling internal stem damage in savanna trees: error in aboveground biomass with terrestrial laser scanning and allometry. Methods Ecol. Evol. https://doi.org/10.1111/2041-210X.14375 (2024).
Mayoral, C. et al. Elevated CO2 does not improve seedling performance in a naturally regenerated oak woodland exposed to biotic stressors. Front. For. Glob. Change 6, 1278409 (2023).
Norby, R. J. & Zak, D. R. Ecological lessons from Free-Air CO2 Enrichment (FACE) experiments. Annu. Rev. Ecol. Evol. Syst. 42, 181â203 (2011).
Iversen, C. M. Digging deeper: fine-root responses to rising atmospheric CO2 concentration in forested ecosystems. New Phytol. 186, 346â357 (2010).
Ziegler, C. et al. Quantification and uncertainty of root growth stimulation by elevated CO2 in a mature temperate deciduous forest. Sci. Total Environ. 854, 158661 (2023).
Gardner, A., Ellsworth, D. S., Pritchard, J. & MacKenzie, A. R. Are chlorophyll concentrations and nitrogen across the vertical canopy profile affected by elevated CO2 in mature Quercus trees? Trees Struct. Funct. 36, 1797â1809 (2022).
Tomlinson, S. J., Carnell, E. J., Dore, A. J. & Dragosits, U. Nitrogen deposition in the UK at 1 km resolution from 1990 to 2017. Earth Syst. Sci. Data 13, 4677â4692 (2021).
Sgouridis, F. et al. Stimulation of soil gross nitrogen transformations and nitrous oxide emission under free air CO2 enrichment in a mature temperate oak forest at BIFoR-FACE. Soil Biol. Biochem. 184, 109072 (2023).
Dijkstra, F. A., Carrillo, Y., Pendall, E. & Morgan, J. A. Rhizosphere priming: a nutrient perspective. Front. Microbiol. 4, 216 (2013).
Hoosbeek, M. R. et al. More new carbon in the mineral soil of a poplar plantation under Free Air Carbon Enrichment (POPFACE): cause of increased priming effect? Glob. Biogeochem. Cycles 18, GB1040 (2004).
Rumeau, M. et al. Nitrogen cycling in forest soils under elevated CO2: response of a key soil nutrient to climate change. EGU General Assembly 2022 https://doi.org/10.5194/egusphere-egu22-178 (2022).
Jia, Y. et al. Global inorganic nitrogen dry deposition inferred from ground- and space-based measurements. Sci. Rep. 6, 19810 (2016).
Jones, A. G. & Power, S. A. Field-scale evaluation of effects of nitrogen deposition on the functioning of heathland ecosystems. J. Ecol. 100, 331â342 (2012).
National Academies of Sciences, Engineering, and Medicine. Deployment of Deep Decarbonization Technologies: Proceedings of a Workshop (The National Academies Press, 2019).
Muller-Landau, H. Combined Band Dendrometer Protocol (ForestGEO/CTFS Global Forest Carbon Research Initiative, 2022); https://forestgeo.si.edu/sites/default/files/panama_dendrometer_protocol_2022-06-06.pdf
Forrester, D. I. et al. Generalized biomass and leaf area allometric equations for European tree species incorporating stand structure, tree age and climate. For. Ecol. Manage. 396, 160â175 (2017).
Jakubowski, M. & DobroczyÅski, M. Allocation of wood density in European oak (Quercus robur L.) trees grown under a canopy of Scots pine. Forests 12, 712 (2021).
Matula, R., Damborská, L., NeÄasová, M., GerÅ¡l, M. & Å rámek, M. Measuring biomass and carbon stock in resprouting woody plants. PLoS ONE 10, e0118388 (2015).
Phillips, R. P., Erlitz, Y., Bier, R. & Bernhardt, E. S. New approach for capturing soluble root exudates in forest soils. Funct. Ecol. 22, 990â999 (2008).
Norby, R. J. et al. Data from: Enhanced woody biomass production in a mature temperate forest under elevated CO2 [Dataset]. Dryad https://doi.org/10.5061/dryad.z612jm6jw (2024).
Acknowledgements
We thank N. Harper and P. Miles for long-term technical support of the FACE facility operations; G. McLean and A. Gardner for shorter-term technical support; P. Blaen and A. Poynter for assistance with initial experimental set-up; H. Begum, A. Kiani, T. Nguyen and H. Warmington for tissue processing; Nuffield Research Placement students, and student and corporate volunteers for assistance with sample processing; and arborists from Rob Keyzor Arboricultural Consultancy for sample retrieval. Funding was provided by the JABBS foundation, the University of Birmingham, and the John Horseman Trust (to A.R.M.), the UK Natural Environmental Research Council through grants NE/S015833/1 (to A.R.M.) and NE/T012323/1 (to S.U.), the UK Research and Innovation Frontier Research Grant QUERCUS funded under EP/X025098/1 (to N.J.L.), and The University of Birmingham Institute for Advanced Studies Distinguished Visiting Fellowship Programme (to R.J.N.).
Author information
Authors and Affiliations
Contributions
A.R.M., S.U., A.R.S., I.P.H., K.M.H. and Z.S. designed and administered the experiment. R.J.N. designed the data synthesis and analysis. R.J.N., N.J.L., C.M., A.R.S., M.K.R., K.v.W., M.S.A., D.B., M.E.C., G.D., R.T.G., R.L.H., A.G.J., A.K. and R.M.T. collected data and contributed to analysis. G.C. and D.B. curated data. J.R.L. provided advice on statistical analysis. R.J.N. wrote the manuscript with substantial input from A.R.M., N.J.L., C.M., S.U., A.R.S., M.K.R., I.P.H. and K.v.W. All authors edited and approved the manuscript.
Corresponding authors
Ethics declarations
Competing interests
The authors declare no competing interests.
Peer review
Peer review information
Nature Climate Change thanks Mingkai Jiang, Ben Bond-Lamberty, Shuli Niu and the other, anonymous, reviewer(s) for their contribution to the peer review of this work.
Additional information
Publisherâs note Springer Nature remains neutral with regard to jurisdictional claims in published maps and institutional affiliations.
Extended data
Extended Data Fig. 1 Aerial view of the BIFoR FACE facility.
The research site comprises six experimental arrays of c. 30 m diameter and a flux tower. Photo by Peter Miles, University of Birmingham.
Extended Data Fig. 2 Allometric relationship between Quercus robur tree biomass and tree diameter at breast height.
The regression equation is: ln(biomass, kg) = 2.312 à ln(diameter, cm) â 1.0863; r2 = 0.77. Tree biomass was calculated as tree volume à wood density of 0.58 g cmâ3, with tree volume determined by TLS.
Extended Data Fig. 3 Comparison of two methods of basal area measurement for a representative tree.
The light green dots are calculations based on daily values of circumference from automated dendrometers (Dendrometer increment sensor DRL26A of resolution less than 1 μm, Environmental Measuring Systems, Brno, Czech Republic), with the data reset to zero each year. The dark green dots are from similar calculations from monthly surveys of manual band dendrometers as described in Methods.
Extended Data Fig. 4 Leaf litterfall during 2019.
There was substantial leaf loss during the summer, which was greater in elevated CO2 plots (P =0.044, F1,4 = 8.36), prior to the normal autumnal leaf loss (CO2 effect, P < 0.003).
Extended Data Fig. 5 Total dry matter increment per tree, 2017â2022 vs tree basal area in 2018.
Blue symbols are ambient CO2 and orange symbols are elevated CO2. Regression equation: DMI = 0.18 Ã BAI â 277; r2 = 0.65.
Supplementary information
Rights and permissions
Open Access This article is licensed under a Creative Commons Attribution 4.0 International License, which permits use, sharing, adaptation, distribution and reproduction in any medium or format, as long as you give appropriate credit to the original author(s) and the source, provide a link to the Creative Commons licence, and indicate if changes were made. The images or other third party material in this article are included in the articleâs Creative Commons licence, unless indicated otherwise in a credit line to the material. If material is not included in the articleâs Creative Commons licence and your intended use is not permitted by statutory regulation or exceeds the permitted use, you will need to obtain permission directly from the copyright holder. To view a copy of this licence, visit http://creativecommons.org/licenses/by/4.0/.
About this article

Cite this article
Norby, R.J., Loader, N.J., Mayoral, C. et al. Enhanced woody biomass production in a mature temperate forest under elevated CO2. Nat. Clim. Chang. 14, 983â988 (2024). https://doi.org/10.1038/s41558-024-02090-3
Received:
Accepted:
Published:
Issue Date:
DOI: https://doi.org/10.1038/s41558-024-02090-3
