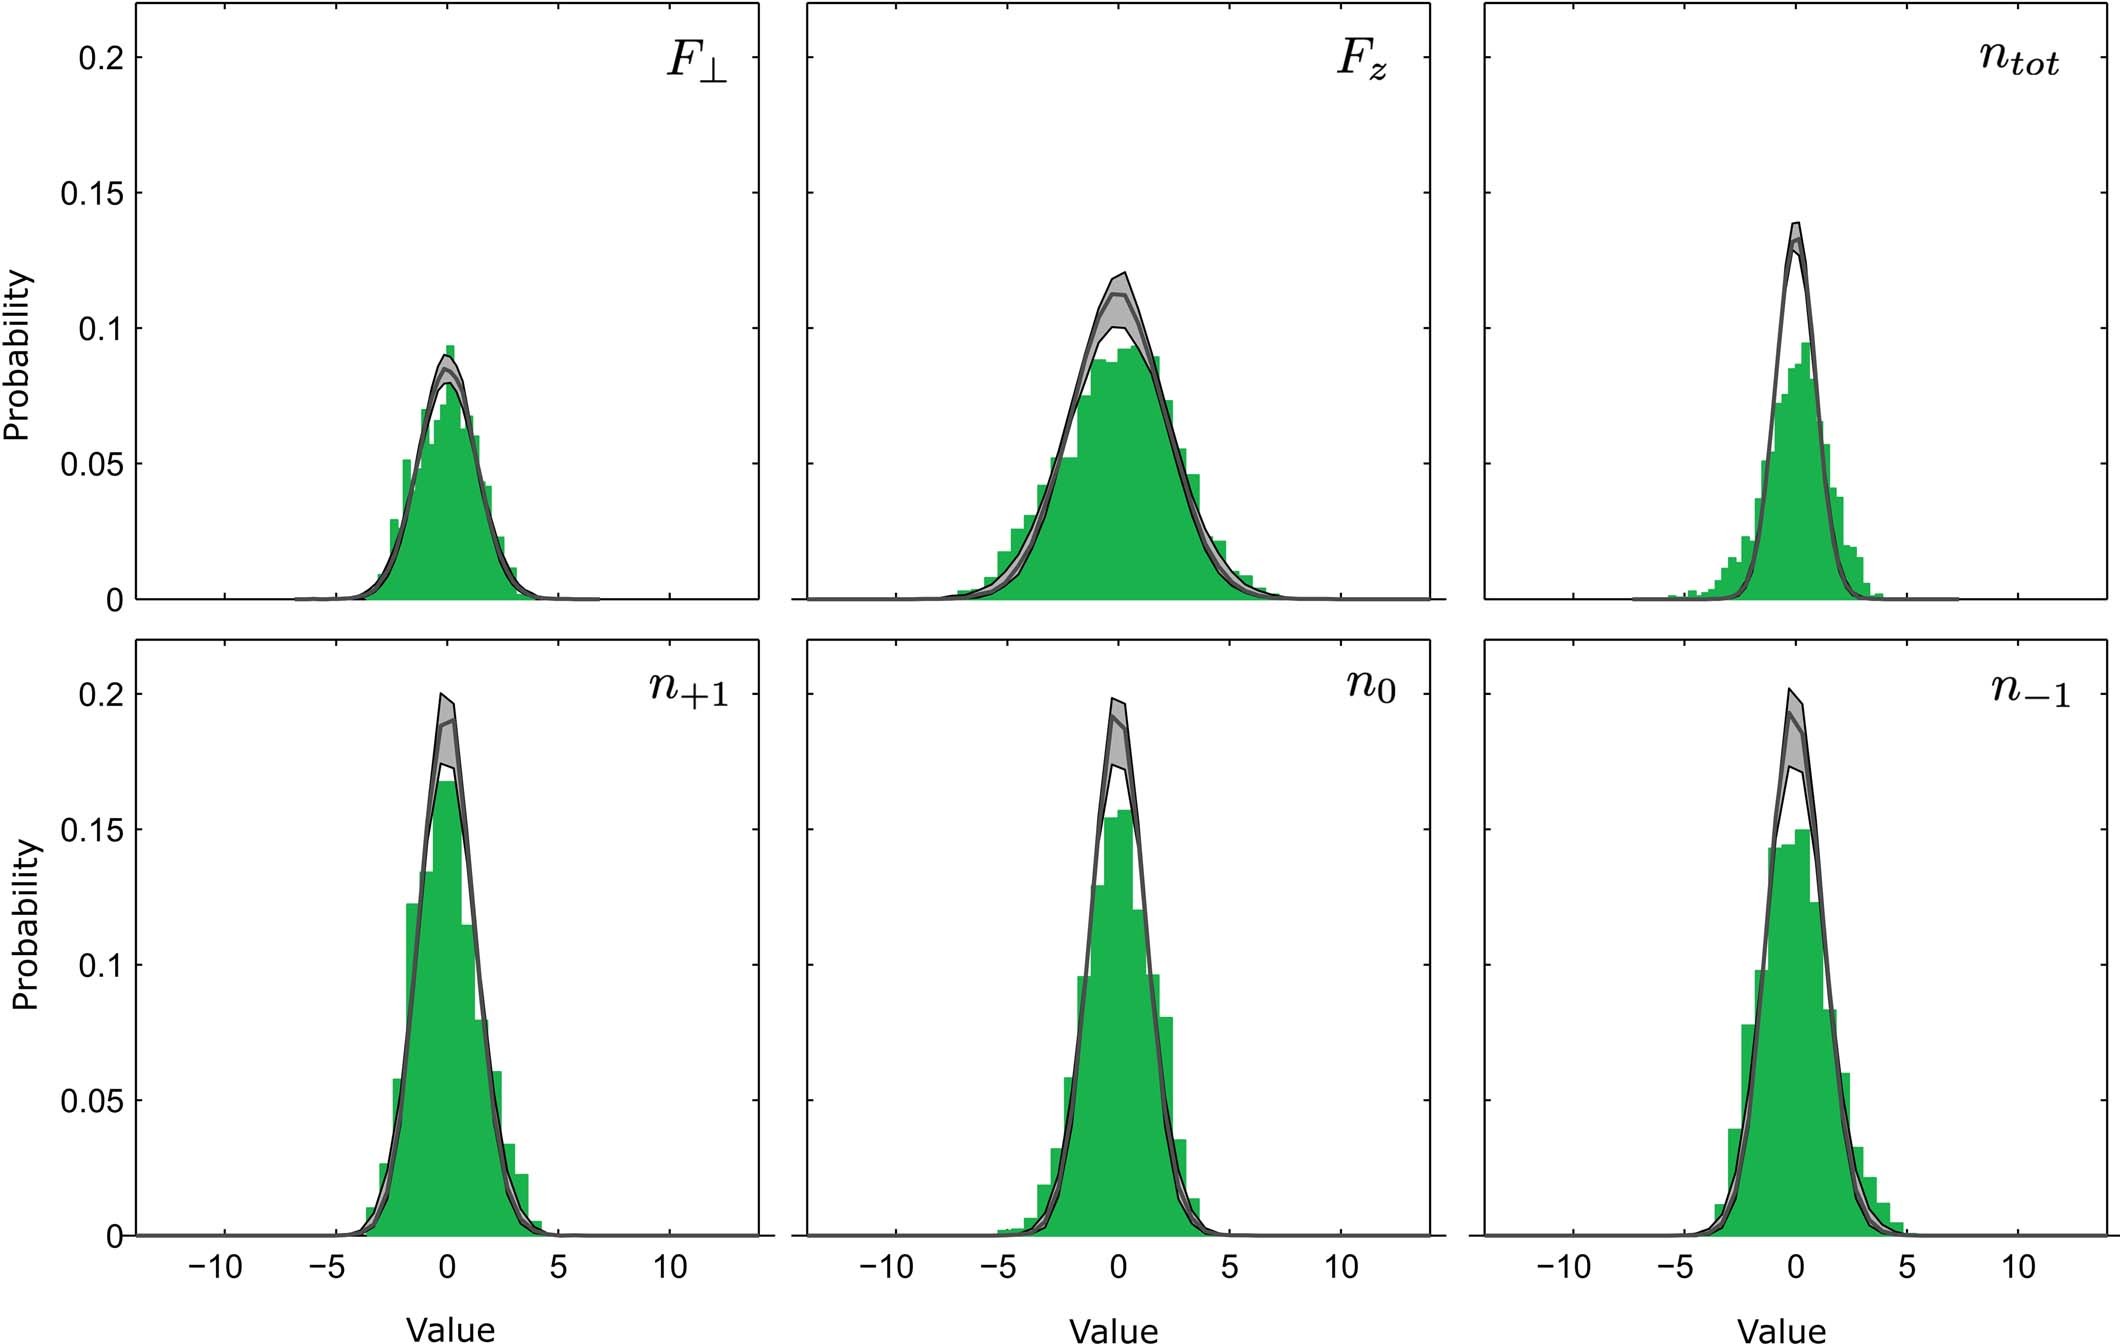
Extended Data Fig. 2: Histograms of local observables in the thermalized state.
From: Condensation and thermalization of an easy-plane ferromagnet in a spinor Bose gas

Histograms obtained from evaluating the local observations of the experimental data presented in Fig. 4 (green bars). Here, each local observable is normalized to the square-root of the local mean of the total atom number. On top we display theoretical estimates from 1000 samples generated according to thermal Bogoliubov theory with parameters as in Fig. 4 (grey line; grey band indicates 68% confidence interval including statistical and systematic uncertainties). The mean value of each histogram is subtracted. For details on the sampling procedure see Methods.