0% found this document useful (0 votes)
4K viewsStatistic and Probability WEEK 1 - 2 - MODULE 1 Answer Key
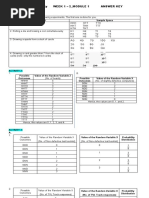
The document provides examples and explanations of key concepts in statistics and probability, including defining sample spaces for experiments, describing random variables and their possible values, and identifying probability distributions. It also gives examples of calculating mean, variance, and standard deviation for random variables and illustrates whether sets of outcomes and probabilities represent valid probability distributions.
Uploaded by
An Neh GynCopyright
© © All Rights Reserved
Available Formats
Download as DOCX, PDF, TXT or read online on Scribd
0% found this document useful (0 votes)
4K viewsStatistic and Probability WEEK 1 - 2 - MODULE 1 Answer Key
The document provides examples and explanations of key concepts in statistics and probability, including defining sample spaces for experiments, describing random variables and their possible values, and identifying probability distributions. It also gives examples of calculating mean, variance, and standard deviation for random variables and illustrates whether sets of outcomes and probabilities represent valid probability distributions.
Uploaded by
An Neh GynCopyright
© © All Rights Reserved
Available Formats
Download as DOCX, PDF, TXT or read online on Scribd
/ 2