Location via proxy:   [ UP ]  
[Report a bug]   [Manage cookies]                
SlideShare a Scribd company logo
EARNINGS RESULTS 4Q18
MARCH, 2019
Disclaimer
2
This presentation may contain certain forward-looking projections and trends that neither
represent realized financial results nor historical information.
These forward-looking projections and trends are subject to risk and uncertainty, and
future results may differ materially from the projections. Many of these risks and
uncertainties are related to factors that are beyond CCR’s ability to control or to estimate,
such as market conditions, currency swings, the behavior of other market participants, the
actions of regulatory agencies, the ability of the company to continue to obtain financing,
changes in the political and social context in which CCR operates or economic trends or
conditions, including changes in the rate of inflation and changes in consumer confidence
on a global, national or regional scale.
Readers are advised not to fully trust these projections and trends. CCR is not obliged to
publish any revision of these projections and trends that should reflect new events or
circumstances after the realization of this presentation.
 TRAFFIC:
Consolidated traffic fell by 3.9%. Excluding the effects of the suspended axle
exemption, consolidated traffic increased by 0.4%.
 EBITDA:
Same-basis1 adjusted EBITDA increased by 3.6%, with an adjusted margin of
61.7% (+0.4 p.p.). Operational Adjusted EBITDA2 went up 8.6%, with a margin
of 60.3% (-1.0 p.p.).
 NET PROFIT:
Same-basis1 net income totaled R$356.9 million, down 21.1%. Net income
totaled R$337.3 million, up 2.5%.
4Q18 x 4Q17 Highlights
3
1 Same-basis figures exclude: (i) ViaMobilidade, whose concession agreement was signed in April 2018; (ii) San José International Airport, in which we increased our stake and, consequently,
acquired control in October 2018; (iii) provision for fines and penalties arising from a Leniency Agreement signed with the Federal Prosecution Office, pursuant to the Material Fact of March 6,
2019, with an impact of R$750.0 million on EBITDA and R$644.4 million on net income; (iv) a provision arising from the Settlement Agreement signed with the Public Prosecution Office of São
Paulo, with an impact of R$81.5 million on EBITDA and R$53.8 million on net income; (v) non-recurring expenses and provisions related to severance costs at the CCR Group, with an impact of
R$74.4 million on EBITDA and R$49.1 million on net income; (vi) non-recurring expenses related to the Independent Committee, with an impact of R$15.5 million on EBITDA and R$10.2 million
on net income; and (vii) remeasurement of the stake previously held at San José, leading to an increase in investments (concession right generated at the acquisition), with an impact of R$91.6
million on EBITDA and R$60.5 million on net income.
2 In addition to non-cash expenses excluded from adjusted EBITDA, it excludes non-cash non-operating revenue and/or expenses: (i) non-recurring from the provisions for fines and penalties
arising from the signature of the Leniency and Settlement Agreements mentioned above, of -R$750.0 million and -R$81.5 million, respectively; (ii) non-recurring from the remeasurement of the
stake held at Aeris, of R$91.6 million and; (iii) provision from the Collaboration Incentive Program (PIC), of -R$71.2 million.
 On January 11, we signed a 30-year concession agreement for Rodovias
Integradas do Sul S.A. (ViaSul). The commercial operations began on
February 15, with two toll plazas.
 On March 11, the consortium comprised of CCR (80%) and RuasInvest
Participações S.A. (20%) presented the best proposal, under onerous
concession, to provide public passenger transport services for Line 15
(Silver) of the São Paulo rail network.
Subsequent Events
Financial Highlights
5
1 Net revenue excludes construction revenue.
2 Same-basis figures exclude: (i) ViaMobilidade, whose concession agreement was signed in April 2018; (ii) San José International Airport, in which we increased our stake
and, consequently, acquired control in October 2018; (iii) provision for fines and penalties arising from a Leniency Agreement signed with the Federal Prosecution Office,
pursuant to the Material Fact of March 6, 2019, with an impact of R$750.0 million on EBITDA and R$644.4 million on net income; (iv) a provision arising from the Settlement
Agreement signed with the Public Prosecution Office of São Paulo, with an impact of R$81.5 million on EBITDA and R$53.8 million on net income; (v) non-recurring
expenses and provisions related to severance costs at the CCR Group, with an impact of R$74.4 million on EBITDA and R$49.1 million on net income; (vi) non-recurring
expenses related to the Independent Committee, with an impact of R$15.5 million on EBITDA and R$10.2 million on net income; and (vii) remeasurement of the stake
previously held at San José, leading to an increase in investments (concession right generated at the acquisition), with an impact of R$91.6 million on EBITDA and R$60.5
million on net income.
3 Calculated by adding net revenue, construction revenue, cost of services and administrative expenses.
4 The operational adjusted and adjusted EBIT and EBITDA margins were calculated by dividing operational adjusted and adjusted EBIT and EBITDA by net revenue,
excluding construction revenue, as required by IFRS.
5 Calculated excluding non-cash expenses: depreciation and amortization, provision for maintenance and the recognition of prepaid concession expenses.
6 In addition to non-cash expenses excluded from adjusted EBITDA, it excludes non-cash non-operating revenue and/or expenses: In 4Q18 and 2018: (i) non-recurring from
the provisions for fines and penalties arising from the signature of the Leniency and Settlement Agreements mentioned above, of -R$750.0 million and -R$81.5 million; (ii)
non-recurring from the remeasurement of the stake held at Aeris, of R$91.6 million and; (iii) provision from the Collaboration Incentive Program (PIC), f -R$71.2 million.
Financial Indicators (R$ MM) 4Q17 4Q18 Chg % 4Q17 4Q18 Chg %
Net Revenues1
2,021.1 2,233.5 10.5% 2,178.8 2,386.3 9.5%
Adjusted Net Revenues on the same basis2
2,021.1 2,083.2 3.1% 2,178.8 2,236.0 2.6%
Adjusted EBIT3
883.3 (24.4) n.m. 950.6 44.8 -95.3%
Adjusted EBIT Mg.4
43.7% -1.1% -44.8 p.p. 43.6% 1.9% -41.7 p.p.
EBIT on the same basis2
883.3 747.6 -15.4% 950.6 816.7 -14.1%
EBIT Mg. on the same basis2
43.7% 35.9% -7.8 p.p. 43.6% 36.5% -7.1 p.p.
Adjusted EBITDA5
1,239.6 535.3 -56.8% 1,342.4 640.4 -52.3%
Adjusted EBITDA Mg.4
61.3% 24.0% -37.3 p.p. 61.6% 26.8% -34.8 p.p.
Operating adjusted EBITDA6
1,239.6 1,346.5 8.6% 1,342.4 1,451.5 8.1%
Operating adjusted EBITDA Mg.4
61.3% 60.3% -1.0 p.p. 61.6% 60.8% -0.8 p.p.
Adjusted EBITDA on the same basis2
1,239.6 1,284.4 3.6% 1,342.4 1,389.5 3.5%
Adjusted EBITDA Mg. on the same basis2
61.3% 61.7% 0.4 p.p. 61.6% 62.1% 0.5 p.p.
Net Income 329.1 (307.1) n.m. 329.1 (307.1) n.m.
Net Income on the same basis2
452.2 356.9 -21.1% 452.2 356.9 -21.1%
IFRS Proforma
274,866
263,925
246,897
259,167
249,836
4Q14 4Q15 4Q16 4Q17 4Q18
Traffic – Quarter Change (Proforma*)
6
Consolidated – MM Equivalent Vehicle
Toll Revenue and Traffic 4Q18 X 4Q17 (%)
* Information including proportional traffic of Renovias and ViaRio.
-4.5
-1.9
-4.6
0.5
-6.1
-4.3 -3.4 -3.1
3.8
-1.1
4.3
-0.8
7.1
-6.8
-0.7
-3.5
1.0
4.5
AutoBAn NovaDutra Rodonorte ViaLagos ViaOeste Renovias RodoAnel
Oeste
SPVias MSVia
Traffic Toll Revenues
7
Revenue and EBITDA Analysis (Proforma*)
* Including the proportional results of jointly-owned subsidiaries.
Gross Operating Revenues
(excluding Construction Revenue)
EBITDA Breakdown
Payment Means
AutoBAn
21.8%
NovaDutra
14.5%
Airports
10.3%
ViaOeste
9.8%
RodoNorte
7.1%
SPVias
6.6%
Metrô Bahia
5.6%
ViaQuatro
5.1%
TAS
3.5%
ViaMobilidade
3.2%
MSVia
3.0%
RodoAnel
Oeste
2.7%
Renovias
1.8% Others
5.0%
92% 93%
85% 79%
2% 1%
10% 13%
5% 5% 4% 8%
1% 1% 1%
4Q15 4Q16 4Q17 4Q18
Highways Urban Mobility Airports Services
70% 68% 67% 68%
30% 32% 33% 32%
3Q15 4Q16 4Q17 4Q18
Electronic Cash
2,510
2,601
1,613
115
71 48 49
59 1,035
39
840 830
158
4Q17 Depreciation
and
Amortization
Third-party
Services
Granting
Power
Advanced
Expenses
Personnel
Costs
Construction
Costs
Maintenance
Provision
Other
Costs
4Q18 One-off San José,
ViaMobilidade
and ViaSul
4Q18
Same Basis
8
Conclusion of civil
works in NovaDutra,
RodoNorte and Metrô
Bahia.
ViaMobilidade,
San José and
Severance cost.
IFRS Costs Evolution
ViaMobilidade,
San José and
Independent
Committee.
1 Materials, insurance, rent, marketing, trips, electronic means of payment, fuel and other general expenses.
2 Same-basis costs exclude: : (i) ViaMobilidade, whose concession agreement was signed in April 2018; (ii) San José International Airport, in which we increased our stake and, consequently,
acquired control in October 2018; (iii) provision for fines and penalties arising from a Leniency Agreement signed with the Federal Prosecution Office, pursuant to the Material Fact of March 6,
2019, in the amount of R$750.0 million; (iv) a provision arising from the Settlement Agreement signed with the Public Prosecution Office of São Paulo, with an impact of R$81.5 million; (v) non-
recurring expenses and provisions related to severance costs at the CCR Group, with an impact of R$74.4 million; (vi) non-recurring expenses related to the Independent Committee, with an
impact of R$15.5 million; and (vii) remeasurement of the stake previously held at San José, leading to an increase in investments (concession right generated at the acquisition), with an impact
of R$91.6 million.
Same-basis cash
costs: R$ 799 MM
(+2.2%)
Total Costs (R$ MM)
AutoBAn and
ViaOeste
1
Same-basis
costs:
(-35.7%)
2
65% 240% 210%36% 75%29% 20% 486% 4%
1,240
535
1,346
1,284
811 62
4Q17
Adjusted
EBITDA
4Q18
Adjusted
EBITDA
Non-cash
non-operating
revenue/
expenses
Operating
adjusted
EBITDA
New
Projects and
One-off
4Q18
EBITDA
Same Basis
IFRS EBITDA
9
61.3%
Mg.
R$ MM
Same basis +3.6%
61.7% Mg. (+0.4 p.p.)
24.0%
Mg.
2
60.3%
Mg.
1
1 In addition to non-cash expenses excluded from adjusted EBITDA, it excludes non-cash non-operating revenue and/or expenses: (i) non-recurring from the provisions for fines and penalties
arising from the signature of the Leniency and Settlement Agreements, of -R$750.0 million and -R$81.5 million, respectively; (ii) non-recurring from the remeasurement of the stake held at
Aeris, of R$91.6 million (for more details, see other costs item) and; (iii) provision from the Collaboration Incentive Program (PIC), of -R$71.2 million.
2 Same-basis figures exclude: (i) ViaMobilidade, whose concession agreement was signed in April 2018; (ii) San José International Airport, in which we increased our stake and, consequently,
acquired control in October 2018; (iii) provision for fines and penalties arising from a Leniency Agreement signed with the Federal Prosecution Office, pursuant to the Material Fact of March 6,
2019, with an impact of R$750.0 million on EBITDA; (iv) a provision arising from the Settlement Agreement signed with the Public Prosecution Office of São Paulo, with an impact of R$81.5
million on EBITDA; (v) non-recurring expenses and provisions related to severance costs at the CCR Group, with an impact of R$74.4 million on EBITDA; (vi) non-recurring expenses related to
the Independent Committee, with an impact of R$15.5 million on EBITDA; and (vii) remeasurement of the stake previously held at San José, leading to an increase in investments (concession
right generated at the acquisition), with an impact of R$91.6 million on EBITDA.
10
R$ MM
IFRS Financial Results
Average cash balance 4Q18 x 4Q17 = - 13.9%
Chg. of average CDI 4Q18 X 4Q17= - 1.1 p.p.
Gross Debt = R$ 17.0 bn (+0.7%)
365
277
( 25 ) 3 ( 12 ) 56
5
( 91 ) (16 ) (1 ) 168
4Q17 Net
Financial Result
Income from
Hedge Operation
Monetary variation
on loans, financ.
and debentures
Monetary Variation
on Liabilities
related to the
Granting Power
Exchange Rate
Variation on Loans,
Financing,
Debentures,
Derivatives and
Suppliers
Present Value
Adjustment of
Maintenance Prov.
and Liabilities
related to the
Granting Power
Interest on Loans,
Financing and
Debentures
Investment Income
and Other Income
Fair Value of
Hedge Operation
Others 4Q18 Net
Financial Result
24%
4Q18 4Q17
11
• Total Gross Debt: R$ 17.0 bi
(R$17.8 Bn proforma)
• Net Debt / EBITDA: 2.8 x
(2.7 x proforma)
Not hedged
Hedged
4Q18
Debt in December 31, 2018
Hedged
Indebtedness and leverage position
Gross debt by indexer Hedged gross debt by indexer
CDI
44.4%
IPCA
22.8%
TJLP
25.4%
USD
7.4%
CDI
56.9%
IPCA
11.9%
TJLP
24.2%
USD
3.5%
Others
3.5%
CDI
51.7%
IPCA
15.5%
TJLP
25.4%
USD
7.4%
Debt Structure and Amortization
December 31, 2018
Amortization 2019 - 2020 Amortization Schedule/ Not hedged (R$ MM)
12
1,271
2,272
1,771
872
1,424
78
112
116
120
3,931
1,584
585
330
801
594
44
346
272
191
411
3
2019 2020 2021 2022 From
2023
CDI TJLP IPCA USD Others
6,358
2,489
3,315
2,979
1,984
Amortization (R$ MM) 2019 2020
RodoNorte 838 0
AutoBAn 720 751
Metrô Bahia 524 105
NovaDutra 229 164
SPVias 208 493
ViaOeste 198 330
ViaQuatro 73 38
Samm 57 0
TAS 32 48
ViaMobilidade 30 0
BH AIRPORT 20 25
CCR S.A. 15 770
Others 34 592
TOTAL 2,979 3,315
13
4Q18 Fundraising
Company Issuance Amount (R$ MM) Debt Cost Maturity
NovaDutra Oct-18 60.0 Debentures 105.50% of CDI Sep-19
BH Airport Nov-18 418.0 BNDES TJLP + 2.31% Dec-35
Total 478.0
Company Issuance Amount (USD MM) Debt Cost Maturity
TAS Oct-18 12.2 Credit Facility LIBOR 6M + 3.20% Oct-20
Quito - Quiport (100%) Dec-18 66.0 Credit Facility LIBOR 3M + 4.00% Jan-20
Total 78.2
12,423
12,971
13,945
13,261
14,443
10,759
11,961 11,801
12,703 12,719
13,780
13,401
14,365
12,628
13,741
3.0 3.0 3.1
2.2 2.4
1.8 1.8
2.2 2.3 2.2
2.6 2.6 2.7 2.6 2.8
-5.5
-4.5
-3.5
-2.5
-1.5
-0.5
0.5
1.5
2.5
3.5
5,000
7,000
9,000
11,000
13,000
15,000
17,000
19,000
4Q15 1Q16 2Q16 3Q16 4Q16 1Q17 2Q17 3Q17 4Q17 1Q18 2Q18 3Q18 4Q18 3Q18 4Q18
Net Debt (R$ MM) Net Debt/Operating adjusted EBITDA* (x)
14
R$ MM
Proforma Data IFRS
Debt
Net Debt / Operating adjusted EBITDA LTM
*Operational Adjusted EBITDA excludes in 4Q18 and 2018: (i) non-recurring from the provisions for fines and penalties arising from the signature of the Leniency and Settlement
Agreements mentioned in the costs section, of -R$750.0 million and -R$81.5 million, respectively; (ii) non-recurring from the remeasurement of the stake held at Aeris, of R$91.6 million
and; (iii) provision from the Collaboration Incentive Program (PIC), of -R$71.2 million.
329 357
-307
697 33
4Q17
Net Income
4Q18
Net Income
One-off San José,
ViaMobilidade
and ViaSul
4Q18 Same Basis*
Net Income
15
R$ MM
Net Income
Same basis
(-21.1%)
*Same-basis figures exclude: (i) ViaMobilidade, whose concession agreement was signed in April 2018; (ii) San José International Airport, in which we increased our stake and,
consequently, acquired control in October 2018; (iii) provision for fines and penalties arising from a Leniency Agreement signed with the Federal Prosecution Office, pursuant to the
Material Fact of March 6, 2019, in the amount of R$644.4 million; (iv) a provision arising from the Settlement Agreement signed with the Public Prosecution Office of São Paulo, with an
impact of R$53.8 million; (v) non-recurring expenses and provisions related to severance costs at the CCR Group, with an impact of R$49.1 million; (vi) non-recurring expenses related to
the Independent Committee, with an impact of R$10.2 million; and (vii) remeasurement of the stake previously held at San José, leading to an increase in investments (concession right
generated at the acquisition), with an impact of R$60.5 million
16
1 - The investments made by the Company, which will be reimbursed by the Granting Authority as monetary consideration or contribution, compose the financial assets.
2 - Includes CCR, CPC and eliminations.
3 - Installment payments of the land acquired in the municipalities of Cajamar and Caieiras, as announced in the Material Fact of October 5, 2016.
Investments and Maintenance
1Q18
4Q18 2018 4Q18 2018 4Q18 2018 4Q18 2018 4Q18 2018 4Q18 2018
NovaDutra 25.7 105.2 4.1 18.8 29.8 124.0 30.7 136.0 0.0 0.0 60.5 260.0
ViaLagos 0.7 2.3 1.3 2.9 2.0 5.2 3.8 4.1 0.0 0.0 5.8 9.3
RodoNorte 90.7 382.6 1.4 5.7 92.1 388.3 23.0 85.1 0.0 0.0 115.1 473.4
AutoBAn 10.7 70.5 2.6 10.8 13.3 81.3 1.5 5.5 0.0 0.0 14.8 86.8
ViaOeste 4.1 23.8 1.7 8.2 5.8 32.0 0.7 28.8 0.0 0.0 6.5 60.8
ViaQuatro 26.5 101.7 3.8 9.8 30.3 111.5 0.0 0.0 0.0 0.0 30.3 111.5
RodoAnel Oeste 11.0 26.1 1.8 7.1 12.8 33.2 0.0 0.0 0.0 0.0 12.8 33.2
Samm 3.0 5.0 6.0 13.5 9.0 18.5 0.0 0.0 0.0 0.0 9.0 18.5
SPVias 7.3 32.7 4.0 10.8 11.3 43.5 47.5 92.2 0.0 0.0 58.8 135.7
CAP 11.1 52.4 0.0 0.0 11.1 52.4 0.0 0.0 0.0 0.0 11.1 52.4
Barcas 0.0 0.0 0.2 0.4 0.2 0.4 0.0 0.0 0.0 0.0 0.2 0.4
Metrô Bahia (13.0) 231.3 1.2 3.6 (11.8) 234.9 0.0 0.0 46.2 180.9 34.4 415.8
BH Airport 21.9 56.3 1.9 6.0 23.8 62.3 0.0 0.0 0.0 0.0 23.8 62.3
MSVia 2.6 139.6 4.3 7.1 6.9 146.7 0.0 0.0 0.0 0.0 6.9 146.7
TAS 0.1 2.6 1.0 15.2 1.1 17.8 0.0 0.0 0.0 0.0 1.1 17.8
Renovias (40%) 0.2 0.2 0.2 1.5 0.4 1.7 0.1 3.7 0.0 0.0 0.5 5.4
ViaRio (66,66%) 0.4 0.9 0.9 2.2 1.3 3.1 0.0 0.0 0.0 0.0 1.3 3.1
VLT (24,93%) (2.8) (1.1) 0.0 0.1 (2.8) (1.0) 0.0 0.0 8.5 28.6 5.7 27.6
Quito - Quiport (50%) 12.9 43.7 0.8 3.1 13.7 46.8 0.0 0.0 0.0 0.0 13.7 46.8
San José - Aeris 75.2 75.2 1.3 1.3 76.5 76.5 0.0 0.0 0.0 0.0 76.5 76.5
ViaMobilidade 7.5 36.3 4.3 12.0 11.8 48.3 0.0 0.0 0.0 0.0 11.8 48.3
Others2
3.5 (2.9) 36.4 47.4 39.9 44.5 (0.8) (5.1) 0.0 0.0 39.1 39.4
Total 299.3 1,384.4 79.2 187.5 378.5 1,571.9 106.5 350.3 54.7 209.5 539.7 2,131.7
SPCP3
0.0 0.0 0.0 65.2 0.0 65.2 0.0 0.0 0.0 0.0 0.0 65.2
Total
Intangible Assets
Performad
Maintenance
R$ MM
Improvements
Performa Financial
Asset1
Equipments and
Others
Total Maintenance Cost
CCR PRESENTATION 4Q18

More Related Content

CCR PRESENTATION 4Q18

  • 2. Disclaimer 2 This presentation may contain certain forward-looking projections and trends that neither represent realized financial results nor historical information. These forward-looking projections and trends are subject to risk and uncertainty, and future results may differ materially from the projections. Many of these risks and uncertainties are related to factors that are beyond CCR’s ability to control or to estimate, such as market conditions, currency swings, the behavior of other market participants, the actions of regulatory agencies, the ability of the company to continue to obtain financing, changes in the political and social context in which CCR operates or economic trends or conditions, including changes in the rate of inflation and changes in consumer confidence on a global, national or regional scale. Readers are advised not to fully trust these projections and trends. CCR is not obliged to publish any revision of these projections and trends that should reflect new events or circumstances after the realization of this presentation.
  • 3.  TRAFFIC: Consolidated traffic fell by 3.9%. Excluding the effects of the suspended axle exemption, consolidated traffic increased by 0.4%.  EBITDA: Same-basis1 adjusted EBITDA increased by 3.6%, with an adjusted margin of 61.7% (+0.4 p.p.). Operational Adjusted EBITDA2 went up 8.6%, with a margin of 60.3% (-1.0 p.p.).  NET PROFIT: Same-basis1 net income totaled R$356.9 million, down 21.1%. Net income totaled R$337.3 million, up 2.5%. 4Q18 x 4Q17 Highlights 3 1 Same-basis figures exclude: (i) ViaMobilidade, whose concession agreement was signed in April 2018; (ii) San José International Airport, in which we increased our stake and, consequently, acquired control in October 2018; (iii) provision for fines and penalties arising from a Leniency Agreement signed with the Federal Prosecution Office, pursuant to the Material Fact of March 6, 2019, with an impact of R$750.0 million on EBITDA and R$644.4 million on net income; (iv) a provision arising from the Settlement Agreement signed with the Public Prosecution Office of São Paulo, with an impact of R$81.5 million on EBITDA and R$53.8 million on net income; (v) non-recurring expenses and provisions related to severance costs at the CCR Group, with an impact of R$74.4 million on EBITDA and R$49.1 million on net income; (vi) non-recurring expenses related to the Independent Committee, with an impact of R$15.5 million on EBITDA and R$10.2 million on net income; and (vii) remeasurement of the stake previously held at San José, leading to an increase in investments (concession right generated at the acquisition), with an impact of R$91.6 million on EBITDA and R$60.5 million on net income. 2 In addition to non-cash expenses excluded from adjusted EBITDA, it excludes non-cash non-operating revenue and/or expenses: (i) non-recurring from the provisions for fines and penalties arising from the signature of the Leniency and Settlement Agreements mentioned above, of -R$750.0 million and -R$81.5 million, respectively; (ii) non-recurring from the remeasurement of the stake held at Aeris, of R$91.6 million and; (iii) provision from the Collaboration Incentive Program (PIC), of -R$71.2 million.
  • 4.  On January 11, we signed a 30-year concession agreement for Rodovias Integradas do Sul S.A. (ViaSul). The commercial operations began on February 15, with two toll plazas.  On March 11, the consortium comprised of CCR (80%) and RuasInvest Participações S.A. (20%) presented the best proposal, under onerous concession, to provide public passenger transport services for Line 15 (Silver) of the São Paulo rail network. Subsequent Events
  • 5. Financial Highlights 5 1 Net revenue excludes construction revenue. 2 Same-basis figures exclude: (i) ViaMobilidade, whose concession agreement was signed in April 2018; (ii) San José International Airport, in which we increased our stake and, consequently, acquired control in October 2018; (iii) provision for fines and penalties arising from a Leniency Agreement signed with the Federal Prosecution Office, pursuant to the Material Fact of March 6, 2019, with an impact of R$750.0 million on EBITDA and R$644.4 million on net income; (iv) a provision arising from the Settlement Agreement signed with the Public Prosecution Office of São Paulo, with an impact of R$81.5 million on EBITDA and R$53.8 million on net income; (v) non-recurring expenses and provisions related to severance costs at the CCR Group, with an impact of R$74.4 million on EBITDA and R$49.1 million on net income; (vi) non-recurring expenses related to the Independent Committee, with an impact of R$15.5 million on EBITDA and R$10.2 million on net income; and (vii) remeasurement of the stake previously held at San José, leading to an increase in investments (concession right generated at the acquisition), with an impact of R$91.6 million on EBITDA and R$60.5 million on net income. 3 Calculated by adding net revenue, construction revenue, cost of services and administrative expenses. 4 The operational adjusted and adjusted EBIT and EBITDA margins were calculated by dividing operational adjusted and adjusted EBIT and EBITDA by net revenue, excluding construction revenue, as required by IFRS. 5 Calculated excluding non-cash expenses: depreciation and amortization, provision for maintenance and the recognition of prepaid concession expenses. 6 In addition to non-cash expenses excluded from adjusted EBITDA, it excludes non-cash non-operating revenue and/or expenses: In 4Q18 and 2018: (i) non-recurring from the provisions for fines and penalties arising from the signature of the Leniency and Settlement Agreements mentioned above, of -R$750.0 million and -R$81.5 million; (ii) non-recurring from the remeasurement of the stake held at Aeris, of R$91.6 million and; (iii) provision from the Collaboration Incentive Program (PIC), f -R$71.2 million. Financial Indicators (R$ MM) 4Q17 4Q18 Chg % 4Q17 4Q18 Chg % Net Revenues1 2,021.1 2,233.5 10.5% 2,178.8 2,386.3 9.5% Adjusted Net Revenues on the same basis2 2,021.1 2,083.2 3.1% 2,178.8 2,236.0 2.6% Adjusted EBIT3 883.3 (24.4) n.m. 950.6 44.8 -95.3% Adjusted EBIT Mg.4 43.7% -1.1% -44.8 p.p. 43.6% 1.9% -41.7 p.p. EBIT on the same basis2 883.3 747.6 -15.4% 950.6 816.7 -14.1% EBIT Mg. on the same basis2 43.7% 35.9% -7.8 p.p. 43.6% 36.5% -7.1 p.p. Adjusted EBITDA5 1,239.6 535.3 -56.8% 1,342.4 640.4 -52.3% Adjusted EBITDA Mg.4 61.3% 24.0% -37.3 p.p. 61.6% 26.8% -34.8 p.p. Operating adjusted EBITDA6 1,239.6 1,346.5 8.6% 1,342.4 1,451.5 8.1% Operating adjusted EBITDA Mg.4 61.3% 60.3% -1.0 p.p. 61.6% 60.8% -0.8 p.p. Adjusted EBITDA on the same basis2 1,239.6 1,284.4 3.6% 1,342.4 1,389.5 3.5% Adjusted EBITDA Mg. on the same basis2 61.3% 61.7% 0.4 p.p. 61.6% 62.1% 0.5 p.p. Net Income 329.1 (307.1) n.m. 329.1 (307.1) n.m. Net Income on the same basis2 452.2 356.9 -21.1% 452.2 356.9 -21.1% IFRS Proforma
  • 6. 274,866 263,925 246,897 259,167 249,836 4Q14 4Q15 4Q16 4Q17 4Q18 Traffic – Quarter Change (Proforma*) 6 Consolidated – MM Equivalent Vehicle Toll Revenue and Traffic 4Q18 X 4Q17 (%) * Information including proportional traffic of Renovias and ViaRio. -4.5 -1.9 -4.6 0.5 -6.1 -4.3 -3.4 -3.1 3.8 -1.1 4.3 -0.8 7.1 -6.8 -0.7 -3.5 1.0 4.5 AutoBAn NovaDutra Rodonorte ViaLagos ViaOeste Renovias RodoAnel Oeste SPVias MSVia Traffic Toll Revenues
  • 7. 7 Revenue and EBITDA Analysis (Proforma*) * Including the proportional results of jointly-owned subsidiaries. Gross Operating Revenues (excluding Construction Revenue) EBITDA Breakdown Payment Means AutoBAn 21.8% NovaDutra 14.5% Airports 10.3% ViaOeste 9.8% RodoNorte 7.1% SPVias 6.6% Metrô Bahia 5.6% ViaQuatro 5.1% TAS 3.5% ViaMobilidade 3.2% MSVia 3.0% RodoAnel Oeste 2.7% Renovias 1.8% Others 5.0% 92% 93% 85% 79% 2% 1% 10% 13% 5% 5% 4% 8% 1% 1% 1% 4Q15 4Q16 4Q17 4Q18 Highways Urban Mobility Airports Services 70% 68% 67% 68% 30% 32% 33% 32% 3Q15 4Q16 4Q17 4Q18 Electronic Cash
  • 8. 2,510 2,601 1,613 115 71 48 49 59 1,035 39 840 830 158 4Q17 Depreciation and Amortization Third-party Services Granting Power Advanced Expenses Personnel Costs Construction Costs Maintenance Provision Other Costs 4Q18 One-off San José, ViaMobilidade and ViaSul 4Q18 Same Basis 8 Conclusion of civil works in NovaDutra, RodoNorte and Metrô Bahia. ViaMobilidade, San José and Severance cost. IFRS Costs Evolution ViaMobilidade, San José and Independent Committee. 1 Materials, insurance, rent, marketing, trips, electronic means of payment, fuel and other general expenses. 2 Same-basis costs exclude: : (i) ViaMobilidade, whose concession agreement was signed in April 2018; (ii) San José International Airport, in which we increased our stake and, consequently, acquired control in October 2018; (iii) provision for fines and penalties arising from a Leniency Agreement signed with the Federal Prosecution Office, pursuant to the Material Fact of March 6, 2019, in the amount of R$750.0 million; (iv) a provision arising from the Settlement Agreement signed with the Public Prosecution Office of São Paulo, with an impact of R$81.5 million; (v) non- recurring expenses and provisions related to severance costs at the CCR Group, with an impact of R$74.4 million; (vi) non-recurring expenses related to the Independent Committee, with an impact of R$15.5 million; and (vii) remeasurement of the stake previously held at San José, leading to an increase in investments (concession right generated at the acquisition), with an impact of R$91.6 million. Same-basis cash costs: R$ 799 MM (+2.2%) Total Costs (R$ MM) AutoBAn and ViaOeste 1 Same-basis costs: (-35.7%) 2 65% 240% 210%36% 75%29% 20% 486% 4%
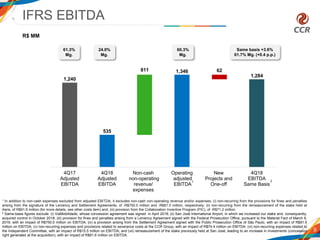
  • 9. 1,240 535 1,346 1,284 811 62 4Q17 Adjusted EBITDA 4Q18 Adjusted EBITDA Non-cash non-operating revenue/ expenses Operating adjusted EBITDA New Projects and One-off 4Q18 EBITDA Same Basis IFRS EBITDA 9 61.3% Mg. R$ MM Same basis +3.6% 61.7% Mg. (+0.4 p.p.) 24.0% Mg. 2 60.3% Mg. 1 1 In addition to non-cash expenses excluded from adjusted EBITDA, it excludes non-cash non-operating revenue and/or expenses: (i) non-recurring from the provisions for fines and penalties arising from the signature of the Leniency and Settlement Agreements, of -R$750.0 million and -R$81.5 million, respectively; (ii) non-recurring from the remeasurement of the stake held at Aeris, of R$91.6 million (for more details, see other costs item) and; (iii) provision from the Collaboration Incentive Program (PIC), of -R$71.2 million. 2 Same-basis figures exclude: (i) ViaMobilidade, whose concession agreement was signed in April 2018; (ii) San José International Airport, in which we increased our stake and, consequently, acquired control in October 2018; (iii) provision for fines and penalties arising from a Leniency Agreement signed with the Federal Prosecution Office, pursuant to the Material Fact of March 6, 2019, with an impact of R$750.0 million on EBITDA; (iv) a provision arising from the Settlement Agreement signed with the Public Prosecution Office of São Paulo, with an impact of R$81.5 million on EBITDA; (v) non-recurring expenses and provisions related to severance costs at the CCR Group, with an impact of R$74.4 million on EBITDA; (vi) non-recurring expenses related to the Independent Committee, with an impact of R$15.5 million on EBITDA; and (vii) remeasurement of the stake previously held at San José, leading to an increase in investments (concession right generated at the acquisition), with an impact of R$91.6 million on EBITDA.
  • 10. 10 R$ MM IFRS Financial Results Average cash balance 4Q18 x 4Q17 = - 13.9% Chg. of average CDI 4Q18 X 4Q17= - 1.1 p.p. Gross Debt = R$ 17.0 bn (+0.7%) 365 277 ( 25 ) 3 ( 12 ) 56 5 ( 91 ) (16 ) (1 ) 168 4Q17 Net Financial Result Income from Hedge Operation Monetary variation on loans, financ. and debentures Monetary Variation on Liabilities related to the Granting Power Exchange Rate Variation on Loans, Financing, Debentures, Derivatives and Suppliers Present Value Adjustment of Maintenance Prov. and Liabilities related to the Granting Power Interest on Loans, Financing and Debentures Investment Income and Other Income Fair Value of Hedge Operation Others 4Q18 Net Financial Result 24%
  • 11. 4Q18 4Q17 11 • Total Gross Debt: R$ 17.0 bi (R$17.8 Bn proforma) • Net Debt / EBITDA: 2.8 x (2.7 x proforma) Not hedged Hedged 4Q18 Debt in December 31, 2018 Hedged Indebtedness and leverage position Gross debt by indexer Hedged gross debt by indexer CDI 44.4% IPCA 22.8% TJLP 25.4% USD 7.4% CDI 56.9% IPCA 11.9% TJLP 24.2% USD 3.5% Others 3.5% CDI 51.7% IPCA 15.5% TJLP 25.4% USD 7.4%
  • 12. Debt Structure and Amortization December 31, 2018 Amortization 2019 - 2020 Amortization Schedule/ Not hedged (R$ MM) 12 1,271 2,272 1,771 872 1,424 78 112 116 120 3,931 1,584 585 330 801 594 44 346 272 191 411 3 2019 2020 2021 2022 From 2023 CDI TJLP IPCA USD Others 6,358 2,489 3,315 2,979 1,984 Amortization (R$ MM) 2019 2020 RodoNorte 838 0 AutoBAn 720 751 Metrô Bahia 524 105 NovaDutra 229 164 SPVias 208 493 ViaOeste 198 330 ViaQuatro 73 38 Samm 57 0 TAS 32 48 ViaMobilidade 30 0 BH AIRPORT 20 25 CCR S.A. 15 770 Others 34 592 TOTAL 2,979 3,315
  • 13. 13 4Q18 Fundraising Company Issuance Amount (R$ MM) Debt Cost Maturity NovaDutra Oct-18 60.0 Debentures 105.50% of CDI Sep-19 BH Airport Nov-18 418.0 BNDES TJLP + 2.31% Dec-35 Total 478.0 Company Issuance Amount (USD MM) Debt Cost Maturity TAS Oct-18 12.2 Credit Facility LIBOR 6M + 3.20% Oct-20 Quito - Quiport (100%) Dec-18 66.0 Credit Facility LIBOR 3M + 4.00% Jan-20 Total 78.2
  • 14. 12,423 12,971 13,945 13,261 14,443 10,759 11,961 11,801 12,703 12,719 13,780 13,401 14,365 12,628 13,741 3.0 3.0 3.1 2.2 2.4 1.8 1.8 2.2 2.3 2.2 2.6 2.6 2.7 2.6 2.8 -5.5 -4.5 -3.5 -2.5 -1.5 -0.5 0.5 1.5 2.5 3.5 5,000 7,000 9,000 11,000 13,000 15,000 17,000 19,000 4Q15 1Q16 2Q16 3Q16 4Q16 1Q17 2Q17 3Q17 4Q17 1Q18 2Q18 3Q18 4Q18 3Q18 4Q18 Net Debt (R$ MM) Net Debt/Operating adjusted EBITDA* (x) 14 R$ MM Proforma Data IFRS Debt Net Debt / Operating adjusted EBITDA LTM *Operational Adjusted EBITDA excludes in 4Q18 and 2018: (i) non-recurring from the provisions for fines and penalties arising from the signature of the Leniency and Settlement Agreements mentioned in the costs section, of -R$750.0 million and -R$81.5 million, respectively; (ii) non-recurring from the remeasurement of the stake held at Aeris, of R$91.6 million and; (iii) provision from the Collaboration Incentive Program (PIC), of -R$71.2 million.
  • 15. 329 357 -307 697 33 4Q17 Net Income 4Q18 Net Income One-off San José, ViaMobilidade and ViaSul 4Q18 Same Basis* Net Income 15 R$ MM Net Income Same basis (-21.1%) *Same-basis figures exclude: (i) ViaMobilidade, whose concession agreement was signed in April 2018; (ii) San José International Airport, in which we increased our stake and, consequently, acquired control in October 2018; (iii) provision for fines and penalties arising from a Leniency Agreement signed with the Federal Prosecution Office, pursuant to the Material Fact of March 6, 2019, in the amount of R$644.4 million; (iv) a provision arising from the Settlement Agreement signed with the Public Prosecution Office of São Paulo, with an impact of R$53.8 million; (v) non-recurring expenses and provisions related to severance costs at the CCR Group, with an impact of R$49.1 million; (vi) non-recurring expenses related to the Independent Committee, with an impact of R$10.2 million; and (vii) remeasurement of the stake previously held at San José, leading to an increase in investments (concession right generated at the acquisition), with an impact of R$60.5 million
  • 16. 16 1 - The investments made by the Company, which will be reimbursed by the Granting Authority as monetary consideration or contribution, compose the financial assets. 2 - Includes CCR, CPC and eliminations. 3 - Installment payments of the land acquired in the municipalities of Cajamar and Caieiras, as announced in the Material Fact of October 5, 2016. Investments and Maintenance 1Q18 4Q18 2018 4Q18 2018 4Q18 2018 4Q18 2018 4Q18 2018 4Q18 2018 NovaDutra 25.7 105.2 4.1 18.8 29.8 124.0 30.7 136.0 0.0 0.0 60.5 260.0 ViaLagos 0.7 2.3 1.3 2.9 2.0 5.2 3.8 4.1 0.0 0.0 5.8 9.3 RodoNorte 90.7 382.6 1.4 5.7 92.1 388.3 23.0 85.1 0.0 0.0 115.1 473.4 AutoBAn 10.7 70.5 2.6 10.8 13.3 81.3 1.5 5.5 0.0 0.0 14.8 86.8 ViaOeste 4.1 23.8 1.7 8.2 5.8 32.0 0.7 28.8 0.0 0.0 6.5 60.8 ViaQuatro 26.5 101.7 3.8 9.8 30.3 111.5 0.0 0.0 0.0 0.0 30.3 111.5 RodoAnel Oeste 11.0 26.1 1.8 7.1 12.8 33.2 0.0 0.0 0.0 0.0 12.8 33.2 Samm 3.0 5.0 6.0 13.5 9.0 18.5 0.0 0.0 0.0 0.0 9.0 18.5 SPVias 7.3 32.7 4.0 10.8 11.3 43.5 47.5 92.2 0.0 0.0 58.8 135.7 CAP 11.1 52.4 0.0 0.0 11.1 52.4 0.0 0.0 0.0 0.0 11.1 52.4 Barcas 0.0 0.0 0.2 0.4 0.2 0.4 0.0 0.0 0.0 0.0 0.2 0.4 Metrô Bahia (13.0) 231.3 1.2 3.6 (11.8) 234.9 0.0 0.0 46.2 180.9 34.4 415.8 BH Airport 21.9 56.3 1.9 6.0 23.8 62.3 0.0 0.0 0.0 0.0 23.8 62.3 MSVia 2.6 139.6 4.3 7.1 6.9 146.7 0.0 0.0 0.0 0.0 6.9 146.7 TAS 0.1 2.6 1.0 15.2 1.1 17.8 0.0 0.0 0.0 0.0 1.1 17.8 Renovias (40%) 0.2 0.2 0.2 1.5 0.4 1.7 0.1 3.7 0.0 0.0 0.5 5.4 ViaRio (66,66%) 0.4 0.9 0.9 2.2 1.3 3.1 0.0 0.0 0.0 0.0 1.3 3.1 VLT (24,93%) (2.8) (1.1) 0.0 0.1 (2.8) (1.0) 0.0 0.0 8.5 28.6 5.7 27.6 Quito - Quiport (50%) 12.9 43.7 0.8 3.1 13.7 46.8 0.0 0.0 0.0 0.0 13.7 46.8 San José - Aeris 75.2 75.2 1.3 1.3 76.5 76.5 0.0 0.0 0.0 0.0 76.5 76.5 ViaMobilidade 7.5 36.3 4.3 12.0 11.8 48.3 0.0 0.0 0.0 0.0 11.8 48.3 Others2 3.5 (2.9) 36.4 47.4 39.9 44.5 (0.8) (5.1) 0.0 0.0 39.1 39.4 Total 299.3 1,384.4 79.2 187.5 378.5 1,571.9 106.5 350.3 54.7 209.5 539.7 2,131.7 SPCP3 0.0 0.0 0.0 65.2 0.0 65.2 0.0 0.0 0.0 0.0 0.0 65.2 Total Intangible Assets Performad Maintenance R$ MM Improvements Performa Financial Asset1 Equipments and Others Total Maintenance Cost