Location via proxy:   [ UP ]  
[Report a bug]   [Manage cookies]                
SlideShare a Scribd company logo
Conference Call
1Q07 Earnings Results

    António Martins da Costa
     Chief Executive Officer

      Antonio José Sellare
     Chief Financial Officer

          Flavia Heller
    Investor Relations Officer


         May 02, 2007
Disclaimer

This presentation may include forward-looking statements of future events or results according to regulations
of the Brazilian and international securities and exchange commissions. These statements are based on
certain assumptions and analysis by the company that reflect its experience, the economic environment and
future market conditions and expected events, many of which are beyond the control of the company.
Important factors that may lead to significant differences between the actual results and the statements of
expectations about future events or results include the company’s business strategy, Brazilian and
international economic conditions, technology, financial strategy, public service industry developments,
hydrological conditions, financial market conditions, uncertainty of the results of future operations, plans,
objectives, expectations and intentions, among others. Considering these factors, the actual results of the
company may be significantly different from those shown or implicit in the statement of expectations about
future events or results.

The information and opinions contained in this presentation should not be understood as a recommendation
to potential investors and no investment decision is to be based on the veracity, current events or
completeness of this information or these opinions. No advisors to the company or parties related to them or
their representatives shall have any responsibility for whatever losses that may result from the use or contents
of this presentation.

This material includes forward-looking statements subject to risks and uncertainties, which are based on
current expectations and projections about future events and trends that may affect the company’s business.
These statements include projections of economic growth and energy demand and supply, as well as
information about the competitive position, the regulatory environment, potential opportunities for growth
and other matters. Several factors may adversely affect the estimates and assumptions on which these
statements are based.


                                                                                                                   2
Operating Performance
Distribution


Volume of Energy Distributed (GWh)        Energy Distributed by Customer Class
                                             (% of total volume distributed)
                3.0%
                                                           3.0%
    5,966                   6,143                                     6,143
                                                5,966
     793                    823                                         1%
                                                 1%
    2,037                   2,105                35%                   37%


    3,136                   3,214                64%                   62%


    1Q06                    1Q07                1Q06                   1Q07
  Bandeirante     Escelsa      Enersul    End Customers   Energy in Transit   Other


 Growth in volume of energy distributed: market recovery in Enersul’s
 concession area


  Increase in the share of free clients in total volume distributed


                                                                                      4
Distribution
  Program for Curbing Losses

In 1Q07, R$10 million were invested in programs to cut down technical
and commercial losses.
           Evolution of commercial losses (% of distributed energy - last 12 months)


                                        6.0                                            7.6    7.6
                                                      5.4    5.4         5.9    6.3
                                               5.2
 2.2       2.4      2.2   2.3


Jun/05 Mar/06 Dec/06 Mar/07            Jun/05 Mar/06 Dec/06 Mar/07      Jun/05 Mar/06 Dec/06 Mar/07


  12.6%          13.2%     12.9%      13.0%
                  3.9%                               ~ 167 thousand inspections were made in 1T07
   4.1%                    4.0%       4.1%
                                                     ~ 72 thousand frauds identified
   8.5%           9.3%     8.9%       8.9%           ~ 700 thousand inspections are scheduled for
                                                     2007
  Jun/05         Mar/06   Dec/06     Mar/07
       Technical                Commercial


                                                                                                      5
Vanguard Project

PDV – Capture of accumulated annualized savings                                                                      Productivity (client/employee)
        Cost of Personnel (R$MM/year)
 Indirect (Accomplished)
                                                                              68.4                                 168%                          108%                         101%
 Direct (Accomplished)                                                                                               1,287
                                                                              8.4                                            1,223
 Indirect(Estimated)                                                                                           1,071                                1,060 1,044
                                                                                                                                                                                    943 929
 Direct (Estimated)                              43.6             40.8
                                                                                                                                                 890
                                40.4                                                                         776                                                              762
                                                   5.7                                                                                     654
28.8            31.9            5.2                               5.2                                                                502                          462
                                                                                                                                                                        585
                                                                                                       456
                 4.2                                                          60.0
4.0
                                35.2             37.9             35.6
24.8            27.7
                                                                                                             Bandeirante                    Escelsa                       Enersul
D ec/ 0 6   A cco mp lished     M ar / 0 7   A cco mp lished      Jun/ 0 7    D ec/ 0 7
              t ill D ec/ 0 6                  t ill M ar / 0 7                                                      1998        2001             2005       2006             1Q07


                                                                                    IT Project

                                                                                    Schedule
                                                                             2005            2006            2007           2008


                                                                                          SIT-Brasil


                                                                                                 Integração


                                                                                                                                                                                              6
Generation


 Volume of Energy Produced (GWh)                     UHE Peixe         UHE            PCH
                                                      Angical      Mascarenhas      São João
                  104%           1,469


        720


        1Q06                      1Q07


        Installed Capacity (MW)                     Peixe Angical and Mascarenhas’ 4th Engine:
          452        50         25        1,043       – Full capacity in 1Q07

 516                                                PCH São João:
                                                     – Energy contract started in Jan/07
                                                     – Commercial operation authorized in
2005
         Peixe
        Angical
                     4th Eng.     PCH
                                          Current
                                                       Apr/07
                      Masc.     S. João


                                                                                                 7
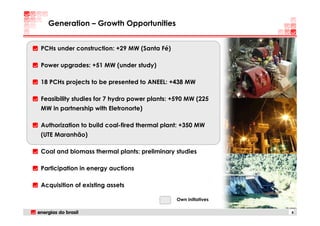
Generation – Growth Opportunities


PCHs under construction: +29 MW (Santa Fé)

Power upgrades: +51 MW (under study)

18 PCHs projects to be presented to ANEEL: +438 MW

Feasibility studies for 7 hydro power plants: +590 MW (225
MW in partnership with Eletronorte)

Authorization to build coal-fired thermal plant: +350 MW
(UTE Maranhão)

Coal and biomass thermal plants: preliminary studies

Participation in energy auctions

Acquisition of existing assets

                                              Own initiatives

                                                                8
Commercialization


Volume of Energy Distributed (GWh)
               2.4%

    1,657              1,697
     303                235


     1,354              1,462


      1Q06               1Q07
    Other    ENBR Group companies


      Number of customers            Growth of volume sold to free customers
              35.2%       73         offset reduction of self-dealing and end of
                                     contract with Enerpeixe
       54


                                     Contract renewal: opportunity to increase
                                     customer base

      1Q06               1Q07


                                                                                   9
Financial Performance


           Net Revenues (R$ MM)                                      EBITDA (R$ MM)

                   13.0%                                                 20.2%
                              1,114                                                   339
         986                                                                           2%
                               10%                             282
         11%                   11%                                                    27%
                                                                6%
         7%
                                                               16%
         82%                   79%
                                                               78%                    71%


         1Q06                 1Q07                            1Q06                    1Q07
Distribution    Generation   Commercialization       Distribution    Generation   Commercialization


                                        Net Income (R$ MM)

                                             28.9%
                                                        128
                                   99


                                  1Q06                  1Q07

                                                                                                      11
EBITDA 1Q06 x 1Q07 (R$ MM)


                                            EBITDA (R$ MM)
                                                +18          -10
                       +63          -7                                 -5        -23
                                                                                        +2      339

           +19
 282


1Q06     Distribution Genera-     Commer-
                                                Tariff *
                                                           Contingen-
                                                                      Bad Debt   PMSO   Other   1Q07
                        tion      cialization                 cies
EBITDA                                                                                          EBITDA
Margin                                                                                          Margin
28.6%                                                                                           30.4%
* Enersul’s tariff readjustment and change in Bandeirante RAB


                                                                                                         12
Costs and Expenses


        Manageable costs should be reduced as result of efficiency programs


                      Costs and Expenses                                   Breakdown of Manageable Expenses
                       Breakdown 1Q07
                                                                                                    st
                                                                   Manageable Expenses            1 Quarter
                                                                                                                          %
                                                                   R$ million              2007          2006

                       Non-                                        Personnel                 69.8         70.8   -1.0    -1.4%
                                            Manageable
                   manageable
                       costs                    costs              Material                   9.7          8.1    1.5    18.6%
                   R$ 549 million           R$ 226 million
                                                (29%)              Third Party Services      78.6         67.3   11.3    16.8%
                       (71%)
                                                                   Provisions                36.5         21.6   14.9    68.9%

                                                                   Other                     31.7         19.9   11.8    59.4%

                                                                   Total                   226.2         187.7   38.5    20.5%

                           R$ 775 million
                                                             Third Party Services         Provisions             Other
                                                             + R$ 3.0 MM: O&M             + R$ 10.5 MM:          + R$ 6.0 MM: shortfall
                                                             Peixe Angical                labor                  in reconciliation of
                                                                                          contingencies          accounts between
                                                             + R$ 5.5 MM: Market
Note:                                                                                                            ENBR and Investco
1   Depreciation and amortization were excluded              growth

                                                                                                                                          13
Investments and Indebtedness

                       Indebtedness – 1Q07 (R$ Million)                                                             Total Debt Index
                                    Net Debt evolution                                                                   (Mar/07)
                                                                                                                             3%
                                                                                  1.8x*
           3,126
                                                                    1.6x*
                          (734)                                                                                                         33%
                                                                     Net Debt / Ebitda

                                          (542)          1,850                    1,879
                                                                                                           60%


                                                                                                                                     4%

                                                                                                         US$                        TJLP
          Gross Debt     (-) Cash and   (-) Regulatory   Net Debt                 Net Debt
                                                                                                                                                **
                                                                                                         Fixed rate                 Floating rate
           Mar.07         Marketable      Assets and      Mar.07                   Dec.06
                           Securities      Liabilities
                                                                                                ** Includes Selic, CDI, IGP-M and INPC
* Ratio: Net Debt / EBITDA 12 months

         Investments* – does not include LFA** (R$ MM)                                             Universalization Program R$MM
                             658                                                                          (includes LFA **)
                             192                                                                                105


                             466
                                                            76
                                                            22                                                                         16
                                                            54
                         2007 (E)                        1Q07 (A)
                                                                                                              2007 (E)              1Q07 (A)
                           Distribution                   Generation

      * Does not include interest capitalization and/or new projects                         **LFA: Light for all

                                                                                                                                                     14
Reconhecimento


      2005 Best Listed               Honorable                     Ranked #1st                        Finalist                    Member in
        Company                       Mention                   Listed Company                                                      2006


                                                                                                                                              Volume
                                                                                                                                               R$ Th.
                                                Market Capitalization: R$5.0 billion
190                                                                                                                                              70,000

180                                                                                                                                              +88%
                                                                                                                                                 60,000
170                                                                                                                                              +81%
160                                                                                                                                              50,000

150
                                                                                                                                                 +79%
                                                                                                                                                 40,000
140                                                                                                                                              +68%
                                                                                                                                                 30,000
130

120                                                                                                                                              20,000
110
                                                                                                                                                 10,000
100

 90                                                                                                                                               0
7/12/2005   8/30/2005 10/20/2005 12/12/2005   2/1/2006   3/24/2006   5/17/2006    7/6/2006   8/24/2006 10/16/2006 12/7/2006   1/31/2007   3/23/2007

                Volume R$ ENBR3                     ENBR3                        Ibovespa                  IEE                     IBX


 Updated until March 31, 2007

                                                                                                                                                        15
Conference Call
    1Q07 Earnings Results


www.energiasdobrasil.com.br

More Related Content

1Q07 Results

  • 1. Conference Call 1Q07 Earnings Results António Martins da Costa Chief Executive Officer Antonio José Sellare Chief Financial Officer Flavia Heller Investor Relations Officer May 02, 2007
  • 2. Disclaimer This presentation may include forward-looking statements of future events or results according to regulations of the Brazilian and international securities and exchange commissions. These statements are based on certain assumptions and analysis by the company that reflect its experience, the economic environment and future market conditions and expected events, many of which are beyond the control of the company. Important factors that may lead to significant differences between the actual results and the statements of expectations about future events or results include the company’s business strategy, Brazilian and international economic conditions, technology, financial strategy, public service industry developments, hydrological conditions, financial market conditions, uncertainty of the results of future operations, plans, objectives, expectations and intentions, among others. Considering these factors, the actual results of the company may be significantly different from those shown or implicit in the statement of expectations about future events or results. The information and opinions contained in this presentation should not be understood as a recommendation to potential investors and no investment decision is to be based on the veracity, current events or completeness of this information or these opinions. No advisors to the company or parties related to them or their representatives shall have any responsibility for whatever losses that may result from the use or contents of this presentation. This material includes forward-looking statements subject to risks and uncertainties, which are based on current expectations and projections about future events and trends that may affect the company’s business. These statements include projections of economic growth and energy demand and supply, as well as information about the competitive position, the regulatory environment, potential opportunities for growth and other matters. Several factors may adversely affect the estimates and assumptions on which these statements are based. 2
  • 4. Distribution Volume of Energy Distributed (GWh) Energy Distributed by Customer Class (% of total volume distributed) 3.0% 3.0% 5,966 6,143 6,143 5,966 793 823 1% 1% 2,037 2,105 35% 37% 3,136 3,214 64% 62% 1Q06 1Q07 1Q06 1Q07 Bandeirante Escelsa Enersul End Customers Energy in Transit Other Growth in volume of energy distributed: market recovery in Enersul’s concession area Increase in the share of free clients in total volume distributed 4
  • 5. Distribution Program for Curbing Losses In 1Q07, R$10 million were invested in programs to cut down technical and commercial losses. Evolution of commercial losses (% of distributed energy - last 12 months) 6.0 7.6 7.6 5.4 5.4 5.9 6.3 5.2 2.2 2.4 2.2 2.3 Jun/05 Mar/06 Dec/06 Mar/07 Jun/05 Mar/06 Dec/06 Mar/07 Jun/05 Mar/06 Dec/06 Mar/07 12.6% 13.2% 12.9% 13.0% 3.9% ~ 167 thousand inspections were made in 1T07 4.1% 4.0% 4.1% ~ 72 thousand frauds identified 8.5% 9.3% 8.9% 8.9% ~ 700 thousand inspections are scheduled for 2007 Jun/05 Mar/06 Dec/06 Mar/07 Technical Commercial 5
  • 6. Vanguard Project PDV – Capture of accumulated annualized savings Productivity (client/employee) Cost of Personnel (R$MM/year) Indirect (Accomplished) 68.4 168% 108% 101% Direct (Accomplished) 1,287 8.4 1,223 Indirect(Estimated) 1,071 1,060 1,044 943 929 Direct (Estimated) 43.6 40.8 890 40.4 776 762 5.7 654 28.8 31.9 5.2 5.2 502 462 585 456 4.2 60.0 4.0 35.2 37.9 35.6 24.8 27.7 Bandeirante Escelsa Enersul D ec/ 0 6 A cco mp lished M ar / 0 7 A cco mp lished Jun/ 0 7 D ec/ 0 7 t ill D ec/ 0 6 t ill M ar / 0 7 1998 2001 2005 2006 1Q07 IT Project Schedule 2005 2006 2007 2008 SIT-Brasil Integração 6
  • 7. Generation Volume of Energy Produced (GWh) UHE Peixe UHE PCH Angical Mascarenhas São João 104% 1,469 720 1Q06 1Q07 Installed Capacity (MW) Peixe Angical and Mascarenhas’ 4th Engine: 452 50 25 1,043 – Full capacity in 1Q07 516 PCH São João: – Energy contract started in Jan/07 – Commercial operation authorized in 2005 Peixe Angical 4th Eng. PCH Current Apr/07 Masc. S. João 7
  • 8. Generation – Growth Opportunities PCHs under construction: +29 MW (Santa Fé) Power upgrades: +51 MW (under study) 18 PCHs projects to be presented to ANEEL: +438 MW Feasibility studies for 7 hydro power plants: +590 MW (225 MW in partnership with Eletronorte) Authorization to build coal-fired thermal plant: +350 MW (UTE Maranhão) Coal and biomass thermal plants: preliminary studies Participation in energy auctions Acquisition of existing assets Own initiatives 8
  • 9. Commercialization Volume of Energy Distributed (GWh) 2.4% 1,657 1,697 303 235 1,354 1,462 1Q06 1Q07 Other ENBR Group companies Number of customers Growth of volume sold to free customers 35.2% 73 offset reduction of self-dealing and end of contract with Enerpeixe 54 Contract renewal: opportunity to increase customer base 1Q06 1Q07 9
  • 11. Financial Performance Net Revenues (R$ MM) EBITDA (R$ MM) 13.0% 20.2% 1,114 339 986 2% 10% 282 11% 11% 27% 6% 7% 16% 82% 79% 78% 71% 1Q06 1Q07 1Q06 1Q07 Distribution Generation Commercialization Distribution Generation Commercialization Net Income (R$ MM) 28.9% 128 99 1Q06 1Q07 11
  • 12. EBITDA 1Q06 x 1Q07 (R$ MM) EBITDA (R$ MM) +18 -10 +63 -7 -5 -23 +2 339 +19 282 1Q06 Distribution Genera- Commer- Tariff * Contingen- Bad Debt PMSO Other 1Q07 tion cialization cies EBITDA EBITDA Margin Margin 28.6% 30.4% * Enersul’s tariff readjustment and change in Bandeirante RAB 12
  • 13. Costs and Expenses Manageable costs should be reduced as result of efficiency programs Costs and Expenses Breakdown of Manageable Expenses Breakdown 1Q07 st Manageable Expenses 1 Quarter % R$ million 2007 2006 Non- Personnel 69.8 70.8 -1.0 -1.4% Manageable manageable costs costs Material 9.7 8.1 1.5 18.6% R$ 549 million R$ 226 million (29%) Third Party Services 78.6 67.3 11.3 16.8% (71%) Provisions 36.5 21.6 14.9 68.9% Other 31.7 19.9 11.8 59.4% Total 226.2 187.7 38.5 20.5% R$ 775 million Third Party Services Provisions Other + R$ 3.0 MM: O&M + R$ 10.5 MM: + R$ 6.0 MM: shortfall Peixe Angical labor in reconciliation of contingencies accounts between + R$ 5.5 MM: Market Note: ENBR and Investco 1 Depreciation and amortization were excluded growth 13
  • 14. Investments and Indebtedness Indebtedness – 1Q07 (R$ Million) Total Debt Index Net Debt evolution (Mar/07) 3% 1.8x* 3,126 1.6x* (734) 33% Net Debt / Ebitda (542) 1,850 1,879 60% 4% US$ TJLP Gross Debt (-) Cash and (-) Regulatory Net Debt Net Debt ** Fixed rate Floating rate Mar.07 Marketable Assets and Mar.07 Dec.06 Securities Liabilities ** Includes Selic, CDI, IGP-M and INPC * Ratio: Net Debt / EBITDA 12 months Investments* – does not include LFA** (R$ MM) Universalization Program R$MM 658 (includes LFA **) 192 105 466 76 22 16 54 2007 (E) 1Q07 (A) 2007 (E) 1Q07 (A) Distribution Generation * Does not include interest capitalization and/or new projects **LFA: Light for all 14
  • 15. Reconhecimento 2005 Best Listed Honorable Ranked #1st Finalist Member in Company Mention Listed Company 2006 Volume R$ Th. Market Capitalization: R$5.0 billion 190 70,000 180 +88% 60,000 170 +81% 160 50,000 150 +79% 40,000 140 +68% 30,000 130 120 20,000 110 10,000 100 90 0 7/12/2005 8/30/2005 10/20/2005 12/12/2005 2/1/2006 3/24/2006 5/17/2006 7/6/2006 8/24/2006 10/16/2006 12/7/2006 1/31/2007 3/23/2007 Volume R$ ENBR3 ENBR3 Ibovespa IEE IBX Updated until March 31, 2007 15
  • 16. Conference Call 1Q07 Earnings Results www.energiasdobrasil.com.br