Bank of America Corporation Shareholders Meeting
- 1. Operating Review Joe Price Chief Financial Officer
- 2. 2006 Financial Results $ in billions, except per share data 2005 YOY Percent YOY Percent Change Change 2006 (GAAP) (Pro forma) Revenue $74.2 30 % 10 % Expense 35.6 24 % - Provision 5.0 25 % (1) Net Income 21.1 28 % 16 EPS (diluted) 4.59 14 % 19 2 Note: Revenue is on a Fully taxable-equivalent basis
- 3. Business Segment Results 2006 vs. 2005 – $ in millions YOY Percent YOY Percent Net Change Change Income (GAAP) (Pro forma) Global Consumer & Small Business $11,520 64% 26% Global Corporate & Investment Banking 5,832 2 1 Global Wealth & Investment Management 2,198 6 4 All Other 1,583 (2) 46 Total Company $21,133 28% 16% 3 Note: Revenue is on a Fully taxable-equivalent basis
- 4. Global Consumer & Small Business Banking Highlights • Record 2.4 million net new retail checking accounts • Retail product sales up 7% • e-Commerce sales up 44% • Debit card revenue up 22% • Average small business loans up 25% Note: Amounts proforma for MBNA 4
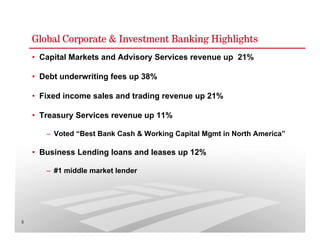
- 5. Global Corporate & Investment Banking Highlights • Capital Markets and Advisory Services revenue up 21% • Debt underwriting fees up 38% • Fixed income sales and trading revenue up 21% • Treasury Services revenue up 11% – Voted “Best Bank Cash & Working Capital Mgmt in North America” • Business Lending loans and leases up 12% – #1 middle market lender 5
- 6. Global Wealth & Investment Management Highlights • Loans and leases up 14% • Assets Under Management up 13% • Based on 3 year AUM, more than 95% of equity mutual fund assets in top 2 quartiles among their peer groups1 • Premier Banking households with brokerage relationships up 10% • Completed more than 200,000 client referrals • Signed US Trust Deal 1 Average Rankings (min. 10 funds; $10 billion in AUM) as of 12/31/06. Columbia Management based on Morningstar data; rankings include actively managed equity 6 funds but exclude index and Fund of Funds; share classes used may have limited eligibility and may not be available to all investors.
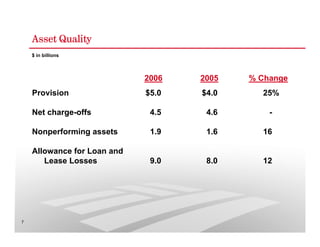
- 7. Asset Quality $ in billions 2006 2005 % Change Provision $5.0 $4.0 25% Net charge-offs 4.5 4.6 - Nonperforming assets 1.9 1.6 16 Allowance for Loan and Lease Losses 9.0 8.0 12 7
- 8. 2007 Environment • Intense competitive landscape • Continued pressure from flat yield curve • More normal credit environment • Moderate economic growth • Customers and clients remain strong 8
- 9. 2007 First Quarter Results $ in billions, except per share data 1Q2007 1Q2006 % Change Revenue $18.4 $17.9 3% Expense 9.1 8.9 2 Provision 1.2 1.3 (3) Net Income 5.3 5.0 5 EPS (diluted) 1.16 1.07 8 9 Note: Revenue is on a fully taxable-equivalent basis
- 10. First Quarter Highlights 1Q2007 vs. 1Q2006 • Average managed loans up 11% • Deposit growth up 5% • Added 487,000 net new checking accounts • Debit card income up 16% • E-commerce sales up 47% • Mass market small business product sales up 34% • Investment Banking income up 35% • Investment and brokerage services income up 12% • Columbia Management’s asset management fees up 16% 10
- 11. Consistent Attractive Earnings Growth Diluted EPS wt h und G ro $4.59 C ompo 13% $4.04 $3.55 $3.64 $3.05 $2.26 $2.30 2000 2001 2002 2003 2004 2005 2006 11
- 12. 29 Consecutive Years of Dividend Increases $2.12 ow th e d gr liz an nua 13% 1977 2006 12 Yield based on annualized dividend and price as of 2/15/07
- 13. 12 Month Total Returns 12 months ending 4/24/07 JP Morgan 26% US Bancorp 17% Citigroup 14% Wells Fargo 13% Bank of America 12% Wachovia 2% 13
- 14. Providing Good Returns Bank of America 15% JP Morgan US Bancorp KBW Bank 13% Wachovia S & P 500 Index 12% Wells Fargo 11% Citigroup 10% Dow 10% 10% 9% 8% Total Annualized Shareholder Return From 12/31/03 Bank of America 20% Wachovia 16% US Bancorp KBW Bank 12% Index Wells Fargo Citigroup Dow 8% JP Morgan 7% S & P 500 6% 5% 5% 3% Total Annualized Shareholder Return From 12/31/00 14 Note: Through 12/31/06


