Location via proxy:   [ UP ]  
[Report a bug]   [Manage cookies]                
SlideShare a Scribd company logo

1

Bank of America
Global Corporate and Investment
Banking

Brian Moynihan
President, Global Corporate and Investment Banking

Lehman Brothers Financial Services Conference
September 10, 2008

2

Forward Looking Statements

     This presentation contains forward-looking statements, including statements about the financial condition,
     results of operations and earnings outlook of Bank of America Corporation. The forward-looking
     statements involve certain risks and uncertainties. Factors that may cause actual results or earnings to
     differ materially from such forward-looking statements include, among others, the following: 1) changes in
     general economic conditions and economic conditions in the geographic regions and industries in which
     the company operates; 2) changes in the interest rate environment which may reduce interest margins and
     impact funding sources; 3) changes in foreign exchange rates; 4) adverse movements and volatility in debt
     and equity capital markets; 5) changes in market rates and prices which may adversely impact the value of
     financial products; 6) political conditions and related actions by the United States abroad which may
     adversely affect the company’s businesses and economic conditions as a whole; 7) liabilities and actions
     resulting from litigation and regulatory investigations, including costs, expenses, settlements and
     judgments; 8) changes in domestic or foreign tax laws, rules and regulations; 9) various monetary and
     fiscal policies and regulations; 10) changes in accounting standards, rules and interpretations; 11)
     competition from other financial institutions; 12) ability to grow core businesses; 13) ability to develop and
     introduce new banking-related products, services and enhancements, and gain market acceptance thereof;
     14) mergers and acquisitions and their integration into the company; 15) decisions to downsize, sell or
     close units or otherwise change the business mix of the company; and 16) management’s ability to manage
     these and other risks. Accordingly, readers are cautioned not to place undue reliance on forward-looking
     statements, which speak as of the date they are made. Bank of America does not undertake to update any
     forward-looking statements to reflect the impact of circumstances or events that arise after the date the
     forward-looking statements are made. For further information regarding Bank of America Corporation and
     these and other risks and uncertainties, please read the company’s reports filed with the SEC and available
     at www.sec.gov.


2

3

Key Takeaways


    • Delivered solid 2Q results across all business segments

    • Continue to work through illiquid capital markets positions

    • Majority of business restructuring efforts are complete

    • Economic environment continues to be challenging

    • Commercial asset quality is softening; homebuilder credit quality poor

    • Continue to invest in all business areas…commercial banking, treasury
      management, investment banking and capital markets, while managing
      expenses carefully

    • In process of driving growth strategies
3

4

GCIB Overview
    Clients Served                            Businesses up to       Larger companies           Investors
                                              $2B in revenues          and sponsors


    Relationship Management Team              Global Commercial      Global Investment      Capital Market Sales
                                              Bank                   Bank                   Trading Teams


    Capabilities                              Lending                Lending                Research
                                              Treasury               Treasury               Trading
                                              Management             Management             Financing
                                              Strategic Advice       Strategic Advice
                                              Debt/Equity Capital    Debt/Equity Capital
                                              Markets                Markets


    Key 2Q08 Stats (1)                       157,600 Clients        8,100 Clients          5,500 Clients
                                             $256B Loans            $79B Loans             $337B Trading Related
                                                                                            Assets
                                             $102B Deposits         $132B Deposits
                                                                                           $1.1B Revenue
                                             $3.2B Revenue          $1.7B Revenue


    (1 ) Client counts exclude LaSalle and Consumer DFS
4

5

GCIB 2Q Overview
    ($ in Billions)
                      Revenue $5.96                      Net Interest Income $3.82
                        ALM/Other                                             ALM/Other
                        $0.12, 2%
                                                                              $0.12, 3%
                                                                                                    CMAS
                                            CMAS                                                  $1.39, 36%
       Treasury                                                Treasury
                                          $1.95, 33%
      $1.86, 31%                                              $0.86, 23%


                                                                            Business Lending
                       Business Lending
                                                                                  $1.45, 38%
                          $2.03, 34%


                    Expenses $2.80                     Non Interest Income $2.14
                                                                   Trading + Other
                                                                     $0.22, 10%                Card Income

         Other                                                                                 $0.30, 14%

       $1.92, 69%


                                                                                                   Investment
                                                          Service Charges                            Banking
                                                            $0.86, 40%                                Fees
                                       Personnel                                                   $0.76, 36%
                                       $0.88, 31%


5

6

Competitive Advantages


    • Customer base


    • Broad product set


    • Capital strength and stability


    • Business Diversity
        –   Revenue
        –   Risk
        –   Regions


6

7

GCIB 2Q Results

                                                                                    Highlights:
    ($ in millions)                             Increase (decrease) over
                                      2Q08          2Q07              1Q08         • Net interest income increased 6.5 % from 1Q08
    Net interest income (FTE)     $ 3,824       $    1,215        $      233              –   Average loans were up $10 billion from
     Card income                      296                9                46                  1Q08 (or 3 %)
     Service charges                  856              173                68
     Inv. & brokerage services                                                            –   Average deposits up 6 % YOY, flat from
                                      210              (11)              (35)
     Investment banking income        765              (56)              100
                                                                                              1Q08
     Trading account profits
                                        369            (568)           2,159
                                                                                   • Noninterest income increased 594 % from 1Q08
       (losses)
     All other income (loss)           (360)           (745)             230              –   Service charges: up 9% from 1Q08 and
       Total noninterest income       2,136          (1,198)           2,568                  19% from 2Q07 (excluding LaSalle)
       Total revenue, net of
         interest expense (FTE)     5,960               17             2,801              –   $1.6 billion lower charges for capital
    Provision for credit losses       363              321              (160)                 market disruptions
    Noninterest expense             2,801             (426)              337
       Pre-tax income               2,796              122             2,624              –   Strong investment banking fees
    Income tax expense              1,050               69               985
       Net income                 $ 1,746       $       54        $    1,639
                                                                                   • Increased provision for credit losses
    Efficiency ratio                  46.99 %         (732) bps        3,101 bps
    Return on equity                  11.57           (458)            1,084
                                                                                   • Trading assets down 11 % YOY, reflecting more
    ($ in billions)
    Loans                         $     335     $        81       $       10         efficient balance sheet usage
    Deposits                             235             14               (1)
    Average Assets                       814             49              (20)
    Trading Assets                       337            (40)             (25)
    Equity                                61             19                2


7

8

Treasury Services

    Key Facts                                2Q Performance
    • Scaled transaction platform to         • Net Income $600MM
      support all corporate customers on
      worldwide basis                        • Drivers:
                                                  – Revenue Increase of 5%
    • 140,800 customers                           – Organic Deposit growth of 7%
                                                  – Service Fee growth of 28 %
    • 24 million customer transactions per        – Expense growth of 3%
      day

    • 23 countries
                                             • Customer satisfaction improved
                                               to 50% from 44%
    • $340B total liquidity balances
                                             • Transitions on schedule
    • Key areas of focus:
        – World Class Sales & Services
        – Unified Client View
        – Integrated Debt and Liquidity
        – Low Cost Producer
        – Payments Transformation and
           Business Process Improvement
8

9

Business Lending


     Key Facts                           2Q Performance
     •   Lending to large and middle     • Net Income of $650MM
         market companies and business
         banking                         • Drivers:
                                              – Organic Loan growth of 16%
     •   68,600 customers                     – Fee growth of 26%

     •   $306B in loans, $327B           • Organic margin growth of 14%
         unfunded/contingent
         commitments
                                         • Provision $397MM
     •   Diverse loan portfolio
                                         • Transitions on schedule

     •   23 countries


9

10

Capital Markets and Advisory Services


      Key Facts                                                2Q Highlights
       •   In close alignment with GCIB client management
           groups; Global Markets product specialists serve    •   Earnings of $450MM decreased $178MM YOY due to write
           more than 3,000 institutional investors and 4,000       downs on illiquid positions (primarily CDOs)
           issuer clients
                                                               •   Excluding write downs, core Sales and Trading revenue
       •   Debt Market Leadership, YTD 2008:                       ($2.4B) was strong driven by Liquid Products
              – #1 U.S. Leveraged Loans (21% mkt share)
              – #1 U.S. Mortgage-Backed Securities (17%        •   Investment banking revenue had 2nd best quarter ever
                 mkt share)                                        ($0.76B)
              – #2 U.S. Syndicated Loans (18% mkt share)
              – #2 U.S. High Yield Corp Debt (18% mkt
                 share)
                                                               Working through Illiquid Positions
       •   Increasing Equity presence

       •   Recent Successes                                    •    CDOs – Active participation in Monoline restructurings;
                                                                    CDO liquidations upon events of default
              – Best Debt House – North America 2008
                     • Euromoney 2008
                                                               •    Leverage Finance/CMBS – Opportunistic sale of
              – US Dollar HY deal of the Year – Credit 2007
                                                                    positions; Limited financing provided to investors
                     • Platinum Equity’s acquisition of
                        Ryerson, Inc
                                                               •    ARS - Assisting issuer clients in
              – Best Investment Grade Corporate Bond
                                                                    refinancing/restructuring opportunities
                  House
                     • Credit 2007
                                                               •    CMBS – Cleared out fixed rate conduit portfolios,
              – US Loan House of the Year 2007
                                                                    continuing to work on large floating rate loans
                     • IFR 2007

10

11

Restructuring Efforts Proceeding in All Businesses


     • GCIB Reduced approximately 3,400 (15%) headcount October 2007 – June 2008

     • Capital Markets & Advisory Key Initiatives
         – Negotiated Prime Brokerage sale
         – Resized Europe
         – Reduced balance sheet by $40B YOY
         – Continued to exit complex trading products
         – Better aligned Investment Banking industry capabilities across the platform
         – Targeted reduction in expenses achieved

     • Continue to fill talent gaps in Investment Banking, Research, Capital Markets

     • Treasury and Business Lending Key Initiatives
          – Completed alignment of relationship management teams
          – Efforts for driving further efficiencies in progress


11

12

Investment Banking Market Share Gains while Restructuring in Process


12

13

Asset Quality


     • Economic environment driving consumer losses higher

     • Commercial asset quality softening from recent historic low points


     • Primary driver of problem assets continues to be homebuilder exposure
       and residential real estate related industries


     • Total commercial criticized exposure represented 6.15% of total
       exposure at 2Q08, an increase of 100 bps from 1Q08
         – Excluding commercial real estate the increase was 85 bps to 4.48%


     • Solid coverage ratios against NPLs and C/Os


13

14

Diverse Portfolio of Commercial and Industrial Loans – 2Q08


               *Excludes small business commercial domestic and commercial real estate


14

15

Commercial Asset Quality - Commercial Loan & Leases

      Commercial Loan & Leases (1)


     ($ in millions)                                       2Q07              3Q07               4Q07       1Q08     2Q08

     Avg Balance                                         $ 188,468 $ 200,163 $ 241,893 $ 240,694 $ 249,764

     Ratios:

     Net charge-offs                                          0.05%             0.01%              0.14%    0.14%    0.13%
     90+ performing DPD                                       0.04%             0.06%              0.07%    0.09%    0.12%
     Nonperforming loans                                      0.22%             0.32%              0.37%    0.48%    0.44%
     Criticized utilized exposure 2                           2.40%             2.72%              2.95%    3.55%    4.44%
     Allowance                                                1.03%             0.99%              0.96%    0.99%    0.88%


       (1) Excludes Small Business (managed in Global Consumer) and Commercial Real estate and FVO loans
       (2) Excludes FVO loans and assets held for sale

15

16

Commercial Asset Quality – Real Estate

     Commercial Real Estate (1)

                                                                                                         Excl.
                                                                                                      Homebuilders
     ($ in millions)                                 2Q07         3Q07     4Q07     1Q08     2Q08        2Q08

     Avg Balance                                  $ 36,589 $ 38,732 $ 59,486 $ 61,890 $ 62,640 $           49,203

     Ratios:

     Net charge-offs                                  -0.01%       0.28%    0.12%    0.70%    0.88%         0.06%
     90+ performing DPD                                   0.00%    0.06%    0.06%    0.36%    0.42%            NA
     Nonperforming loans                                  0.76%    0.87%    1.79%    2.59%    4.16%         0.97%
                                          (2)
     Criticized utilized exposure                         2.96%    7.63%   10.35%   13.36%   15.62%         4.98%
     Allowance                                            1.63%    1.60%    1.77%    1.92%    2.12%            NA


        (1) Excludes FVO loans
        (2) Excludes FVO loans and assets held for sale

16

17

Commercial Real Estate Diversity – 2Q08


17

18

Strategies for Growth


     • Leverage restructured platforms

     • Focus primarily on our U.S. client base and extensions of their businesses
       internationally

     • Drive client strategies that
         – Leverage the strength of our franchise
         – Deliver an integrated sales and service experience
         – Prioritize markets and industry sectors
         – Balance risk and reward

     • Effective utilization of balance sheet and capital

     • Continue to invest in people and technology


18

19

Key Takeaways


     • Delivered solid 2Q results across all business segments

     • Continue to work through illiquid capital markets positions

     • Majority of business restructuring efforts are complete

     • Economic environment continues to be challenging

     • Commercial asset quality is softening; homebuilder credit quality poor

     • Continue to invest in all business areas…commercial banking, treasury
       management, investment banking and capital markets, while managing
       expenses carefully

     • In process of driving growth strategies
19

20

20

More Related Content

Lehman Brothers Conference

  • 1. Bank of America Global Corporate and Investment Banking Brian Moynihan President, Global Corporate and Investment Banking Lehman Brothers Financial Services Conference September 10, 2008
  • 2. Forward Looking Statements This presentation contains forward-looking statements, including statements about the financial condition, results of operations and earnings outlook of Bank of America Corporation. The forward-looking statements involve certain risks and uncertainties. Factors that may cause actual results or earnings to differ materially from such forward-looking statements include, among others, the following: 1) changes in general economic conditions and economic conditions in the geographic regions and industries in which the company operates; 2) changes in the interest rate environment which may reduce interest margins and impact funding sources; 3) changes in foreign exchange rates; 4) adverse movements and volatility in debt and equity capital markets; 5) changes in market rates and prices which may adversely impact the value of financial products; 6) political conditions and related actions by the United States abroad which may adversely affect the company’s businesses and economic conditions as a whole; 7) liabilities and actions resulting from litigation and regulatory investigations, including costs, expenses, settlements and judgments; 8) changes in domestic or foreign tax laws, rules and regulations; 9) various monetary and fiscal policies and regulations; 10) changes in accounting standards, rules and interpretations; 11) competition from other financial institutions; 12) ability to grow core businesses; 13) ability to develop and introduce new banking-related products, services and enhancements, and gain market acceptance thereof; 14) mergers and acquisitions and their integration into the company; 15) decisions to downsize, sell or close units or otherwise change the business mix of the company; and 16) management’s ability to manage these and other risks. Accordingly, readers are cautioned not to place undue reliance on forward-looking statements, which speak as of the date they are made. Bank of America does not undertake to update any forward-looking statements to reflect the impact of circumstances or events that arise after the date the forward-looking statements are made. For further information regarding Bank of America Corporation and these and other risks and uncertainties, please read the company’s reports filed with the SEC and available at www.sec.gov. 2
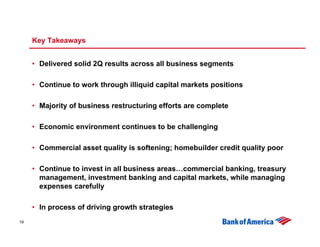
  • 3. Key Takeaways • Delivered solid 2Q results across all business segments • Continue to work through illiquid capital markets positions • Majority of business restructuring efforts are complete • Economic environment continues to be challenging • Commercial asset quality is softening; homebuilder credit quality poor • Continue to invest in all business areas…commercial banking, treasury management, investment banking and capital markets, while managing expenses carefully • In process of driving growth strategies 3
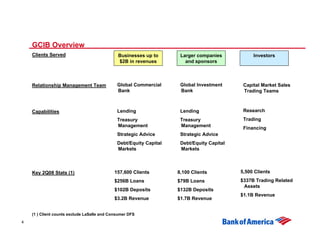
  • 4. GCIB Overview Clients Served Businesses up to Larger companies Investors $2B in revenues and sponsors Relationship Management Team Global Commercial Global Investment Capital Market Sales Bank Bank Trading Teams Capabilities Lending Lending Research Treasury Treasury Trading Management Management Financing Strategic Advice Strategic Advice Debt/Equity Capital Debt/Equity Capital Markets Markets Key 2Q08 Stats (1) 157,600 Clients 8,100 Clients 5,500 Clients $256B Loans $79B Loans $337B Trading Related Assets $102B Deposits $132B Deposits $1.1B Revenue $3.2B Revenue $1.7B Revenue (1 ) Client counts exclude LaSalle and Consumer DFS 4
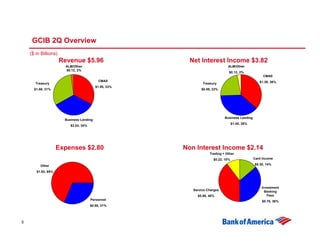
  • 5. GCIB 2Q Overview ($ in Billions) Revenue $5.96 Net Interest Income $3.82 ALM/Other ALM/Other $0.12, 2% $0.12, 3% CMAS CMAS $1.39, 36% Treasury Treasury $1.95, 33% $1.86, 31% $0.86, 23% Business Lending Business Lending $1.45, 38% $2.03, 34% Expenses $2.80 Non Interest Income $2.14 Trading + Other $0.22, 10% Card Income Other $0.30, 14% $1.92, 69% Investment Service Charges Banking $0.86, 40% Fees Personnel $0.76, 36% $0.88, 31% 5
  • 6. Competitive Advantages • Customer base • Broad product set • Capital strength and stability • Business Diversity – Revenue – Risk – Regions 6
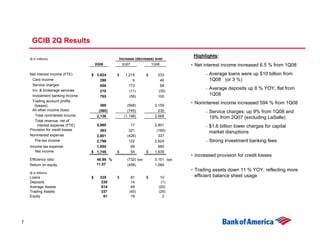
  • 7. GCIB 2Q Results Highlights: ($ in millions) Increase (decrease) over 2Q08 2Q07 1Q08 • Net interest income increased 6.5 % from 1Q08 Net interest income (FTE) $ 3,824 $ 1,215 $ 233 – Average loans were up $10 billion from Card income 296 9 46 1Q08 (or 3 %) Service charges 856 173 68 Inv. & brokerage services – Average deposits up 6 % YOY, flat from 210 (11) (35) Investment banking income 765 (56) 100 1Q08 Trading account profits 369 (568) 2,159 • Noninterest income increased 594 % from 1Q08 (losses) All other income (loss) (360) (745) 230 – Service charges: up 9% from 1Q08 and Total noninterest income 2,136 (1,198) 2,568 19% from 2Q07 (excluding LaSalle) Total revenue, net of interest expense (FTE) 5,960 17 2,801 – $1.6 billion lower charges for capital Provision for credit losses 363 321 (160) market disruptions Noninterest expense 2,801 (426) 337 Pre-tax income 2,796 122 2,624 – Strong investment banking fees Income tax expense 1,050 69 985 Net income $ 1,746 $ 54 $ 1,639 • Increased provision for credit losses Efficiency ratio 46.99 % (732) bps 3,101 bps Return on equity 11.57 (458) 1,084 • Trading assets down 11 % YOY, reflecting more ($ in billions) Loans $ 335 $ 81 $ 10 efficient balance sheet usage Deposits 235 14 (1) Average Assets 814 49 (20) Trading Assets 337 (40) (25) Equity 61 19 2 7
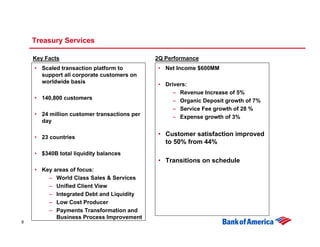
  • 8. Treasury Services Key Facts 2Q Performance • Scaled transaction platform to • Net Income $600MM support all corporate customers on worldwide basis • Drivers: – Revenue Increase of 5% • 140,800 customers – Organic Deposit growth of 7% – Service Fee growth of 28 % • 24 million customer transactions per – Expense growth of 3% day • 23 countries • Customer satisfaction improved to 50% from 44% • $340B total liquidity balances • Transitions on schedule • Key areas of focus: – World Class Sales & Services – Unified Client View – Integrated Debt and Liquidity – Low Cost Producer – Payments Transformation and Business Process Improvement 8
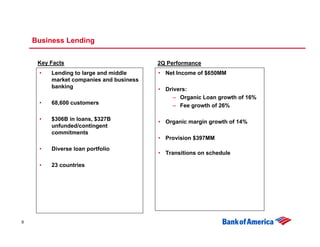
  • 9. Business Lending Key Facts 2Q Performance • Lending to large and middle • Net Income of $650MM market companies and business banking • Drivers: – Organic Loan growth of 16% • 68,600 customers – Fee growth of 26% • $306B in loans, $327B • Organic margin growth of 14% unfunded/contingent commitments • Provision $397MM • Diverse loan portfolio • Transitions on schedule • 23 countries 9
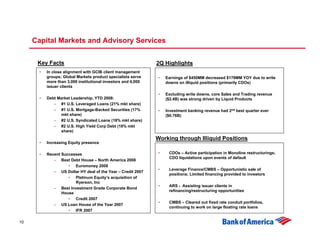
  • 10. Capital Markets and Advisory Services Key Facts 2Q Highlights • In close alignment with GCIB client management groups; Global Markets product specialists serve • Earnings of $450MM decreased $178MM YOY due to write more than 3,000 institutional investors and 4,000 downs on illiquid positions (primarily CDOs) issuer clients • Excluding write downs, core Sales and Trading revenue • Debt Market Leadership, YTD 2008: ($2.4B) was strong driven by Liquid Products – #1 U.S. Leveraged Loans (21% mkt share) – #1 U.S. Mortgage-Backed Securities (17% • Investment banking revenue had 2nd best quarter ever mkt share) ($0.76B) – #2 U.S. Syndicated Loans (18% mkt share) – #2 U.S. High Yield Corp Debt (18% mkt share) Working through Illiquid Positions • Increasing Equity presence • Recent Successes • CDOs – Active participation in Monoline restructurings; CDO liquidations upon events of default – Best Debt House – North America 2008 • Euromoney 2008 • Leverage Finance/CMBS – Opportunistic sale of – US Dollar HY deal of the Year – Credit 2007 positions; Limited financing provided to investors • Platinum Equity’s acquisition of Ryerson, Inc • ARS - Assisting issuer clients in – Best Investment Grade Corporate Bond refinancing/restructuring opportunities House • Credit 2007 • CMBS – Cleared out fixed rate conduit portfolios, – US Loan House of the Year 2007 continuing to work on large floating rate loans • IFR 2007 10
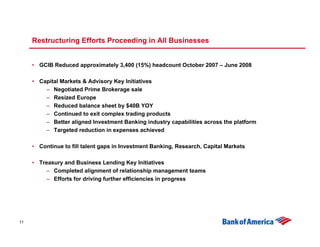
  • 11. Restructuring Efforts Proceeding in All Businesses • GCIB Reduced approximately 3,400 (15%) headcount October 2007 – June 2008 • Capital Markets & Advisory Key Initiatives – Negotiated Prime Brokerage sale – Resized Europe – Reduced balance sheet by $40B YOY – Continued to exit complex trading products – Better aligned Investment Banking industry capabilities across the platform – Targeted reduction in expenses achieved • Continue to fill talent gaps in Investment Banking, Research, Capital Markets • Treasury and Business Lending Key Initiatives – Completed alignment of relationship management teams – Efforts for driving further efficiencies in progress 11
  • 12. Investment Banking Market Share Gains while Restructuring in Process 12
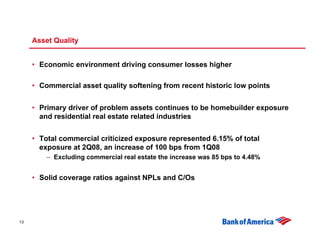
  • 13. Asset Quality • Economic environment driving consumer losses higher • Commercial asset quality softening from recent historic low points • Primary driver of problem assets continues to be homebuilder exposure and residential real estate related industries • Total commercial criticized exposure represented 6.15% of total exposure at 2Q08, an increase of 100 bps from 1Q08 – Excluding commercial real estate the increase was 85 bps to 4.48% • Solid coverage ratios against NPLs and C/Os 13
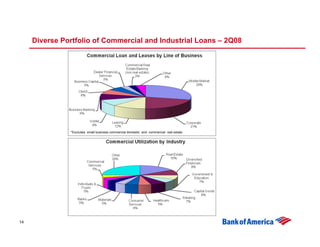
  • 14. Diverse Portfolio of Commercial and Industrial Loans – 2Q08 *Excludes small business commercial domestic and commercial real estate 14
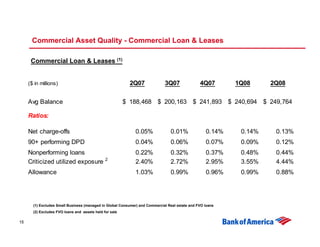
  • 15. Commercial Asset Quality - Commercial Loan & Leases Commercial Loan & Leases (1) ($ in millions) 2Q07 3Q07 4Q07 1Q08 2Q08 Avg Balance $ 188,468 $ 200,163 $ 241,893 $ 240,694 $ 249,764 Ratios: Net charge-offs 0.05% 0.01% 0.14% 0.14% 0.13% 90+ performing DPD 0.04% 0.06% 0.07% 0.09% 0.12% Nonperforming loans 0.22% 0.32% 0.37% 0.48% 0.44% Criticized utilized exposure 2 2.40% 2.72% 2.95% 3.55% 4.44% Allowance 1.03% 0.99% 0.96% 0.99% 0.88% (1) Excludes Small Business (managed in Global Consumer) and Commercial Real estate and FVO loans (2) Excludes FVO loans and assets held for sale 15
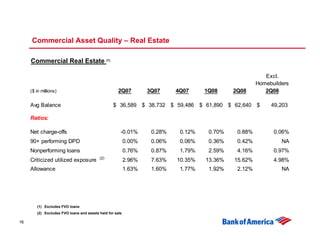
  • 16. Commercial Asset Quality – Real Estate Commercial Real Estate (1) Excl. Homebuilders ($ in millions) 2Q07 3Q07 4Q07 1Q08 2Q08 2Q08 Avg Balance $ 36,589 $ 38,732 $ 59,486 $ 61,890 $ 62,640 $ 49,203 Ratios: Net charge-offs -0.01% 0.28% 0.12% 0.70% 0.88% 0.06% 90+ performing DPD 0.00% 0.06% 0.06% 0.36% 0.42% NA Nonperforming loans 0.76% 0.87% 1.79% 2.59% 4.16% 0.97% (2) Criticized utilized exposure 2.96% 7.63% 10.35% 13.36% 15.62% 4.98% Allowance 1.63% 1.60% 1.77% 1.92% 2.12% NA (1) Excludes FVO loans (2) Excludes FVO loans and assets held for sale 16
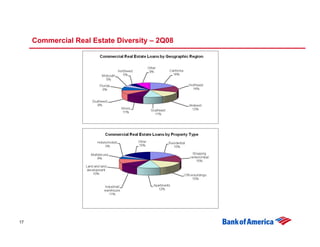
  • 17. Commercial Real Estate Diversity – 2Q08 17
  • 18. Strategies for Growth • Leverage restructured platforms • Focus primarily on our U.S. client base and extensions of their businesses internationally • Drive client strategies that – Leverage the strength of our franchise – Deliver an integrated sales and service experience – Prioritize markets and industry sectors – Balance risk and reward • Effective utilization of balance sheet and capital • Continue to invest in people and technology 18
  • 19. Key Takeaways • Delivered solid 2Q results across all business segments • Continue to work through illiquid capital markets positions • Majority of business restructuring efforts are complete • Economic environment continues to be challenging • Commercial asset quality is softening; homebuilder credit quality poor • Continue to invest in all business areas…commercial banking, treasury management, investment banking and capital markets, while managing expenses carefully • In process of driving growth strategies 19
  • 20. 20