Electrification: Towards a Sustainable Future for our Transportation System
- 1. Electrification: Towards a Sustainable Future for Our Transportation System Regan Zane
- 2. Cost 15% 28%Total Energy Use 50%Air Pollution 90%Air pollution near high density roadways 70%Petroleum use Impacts of Transportation in the US
- 4. Emissions/Pollution Cost Benefits to Electrification 75 % reduction in PM10 / 2.5 50% reduction in CO2 Zero Tailpipe Emissions 50% reduction in total cost
- 5. Why not?
- 6. 16 gal, 100 lb, 540 kWhFuel tank Refuel time Vehicle Cost 300 gal, 4,000 lb, 180 kWh 4 hours (45 kW) $25,000 $125,000 Gasoline EV 500 Mile Range Vehicle Comparison 3 min 24 hours (7.5 kW) 60 hours (3 kW) (10 MW)
- 8. Center for Sustainable Electrified Transportation (SELECT) Strategic Partners Industry Community National Labs Government Market Adoption Systems Integration Vehicle-scale Demonstrations
- 10. SELECT Vehicle-Scale Integration Facilities Electric Vehicle and Roadway (EVR) Research Facility and Test Track Power Electronics Lab
- 11. Extending battery lifetime by more than 50% Battery Range / Lifetime
- 12. • Removing existing HV-12V DC-DC • Removing existing Battery Management System (BMS) • Adding integrated modular DC-DC+BMS • Enabling advanced monitoring and control 7.6 kWh Battery Cells BMS 3 kW HV-12V DC/DC How are we doing it?
- 13. How are we doing it? 7.6 kWh Battery Cells BMS 3 kW HV-12V DC/DC
- 14. How are we doing it?
- 15. Full-scale integration on commercial Ford Fusion PHEV battery pack Undergoing 3rd party 12-month aging tests and validation at NREL Status & Commercialization • Multiple auto OEMs • Ford has continued interest in the technology Extending to plug-and-play renewable energy micro-grid Active Industry Partner Program
- 19. Integrating 100 kW AC & DC fast chargers at no cost Fast Charging
- 20. • Removing external AC-DC charging station • Removing existing DC-AC motor drive • Removing existing vehicle DC-DC • Adding modular multi-function DC-DC with innovative AC unfolder How are we doing it? Raytheon IRAD USTAR startup Navy underwater Military procurement Navy HESM large power Retrofit EV OEM Automotive OEM USTAR SELECT Commercial micro-grid Milestones/Events for Program 64 kW DC-DC modules, >96% efficiency 128 kW DC-AC motor drive/charger Commercialization
- 21. Eliminating range anxiety by electrifying future roadways Sustainable Future
- 23. Delivering Power on the Go
- 24. 24 Electrified Roadway 2016 Milestones In-motion wireless charging of the “Aggie Bus” on the EVR track Autonomous operation of the Ford Focus EV on the EVR track Roadway enclosures for wireless charging pads and smart sensors
- 25. Recent or Planned Field Trials on Electrified Roadways U.K., Highways England running 18-month off-road trials OLEV Korea trials in Seoul, Jejudo, Dae-jeon, & Sejong
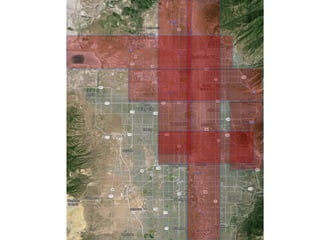
- 26. 38% 58% 2% 28%60% 14% 0% 10% 20% 30% 40% 50% 60% 70% 80% 90% 100% Paved Roads Miles Driven United States Roadways Rural Cost for Electrified Roadways
- 27. Infrastructure Cost Breakdown $1.2 million Roadway $960k Electronics $240k Grid Connection
- 28. Payback Time
- 29. Parameter Energy at wheel (Wh/Km) Tank-to wheel eff. n (%) ICE SELECT Weight (Kg) Cost ($) Maintenance (% cost) Electrical Energy ($/kWh) Fuel ($/gal) 685 28 2000 31,000 8 -- 4.07 44% 616 84 1400 -- 4 0.107 22,00
- 30. We’ve Been Here Before
- 31. Trucking Industry Example Diesel Trucks & Drivers Fuel: $120 Billion Driver: $100 Billion Maint: $100 Billion Total: $320 Billion Autonomous Electric Trucks Electricity: $59 Billion Maint: $100 Billion Total: $159 Billion Interstate Infrastructure Cost Roadways: $300 Billion Power plants: $55 Billion R&D: $1 Billion Total: $356 Billion $161 Billion savings per year
- 32. Come Get Involved! • Industry Members • Community Partners SELECT Membership Sponsorship Events • Student Fellowships • EVR facility, renewable energy • STEM Outreach & Lab Tours • Conference on Electric Roads and Vehicles (CERV) May 15-17, Logan, UT
Editor's Notes
- Power Electronics Lab
- I’d break this up into two slides. Most people won’t know what HV-12V DC-DC, and DC-DC + BMS means. See next two slides.
- I don’t think you need the bullet points if you animate the boxes to appear when you say the two things that you’re removing. Do you have a version of this photo that is a higher resolution?
- Again I’d break this up into multiple slides. First introduce who your active industry partners are, and then go into then tell what technologies of yours they are interested in/adopting. Check out the next couple of slides.
- Wen have active industry partners, particularly Ford
- Full-scale integration on commercial Ford Fusion PHEV battery pack; Undergoing 3rd party 12-month aging tests and validation at NREL. I don’t think you need this text on the slide. I think it’s enough for you to just say it.
- I think you’ll need some sort of explanation about why this improves charging times
- Again, I’d break this up into multiple slides. I’d highlight what you are removing like you did with the battery components in slide 13. I find the commercialization figure unclear. That might just be because I don’t have you to explain it. I’d definitely put it on it’s own slide and perhaps with the success highlighted on slide 24.
- If you have higher resolution images, I would put each of these as a full size image and as their own slide.
- This introduces the base cost of the roadway first, and indicates that only half of the total 2.4 million comes from the electrification
- I’d break this into two slides. To my understanding, the graph captures the payback for the infrastructure, whereas the table captures comparisons the vehicle.
- Remind me what you’re main point is for slides 26 and 27?


