UX STRAT Europe 2019: Tom Ablewhite, Jamie Horne, Foolproof
- 1. UXStrat Workshop How to measure UX improvements with metrics driven by business objectives Tom Ablewhite – Principal Consultant Jamie Horne – Senior Consultant J U N E 2 0 1 9
- 2. 2 Agenda 1. 14:00 Introductions 2. 14:15 The challenges of measuring business objectives & solutions 3. 15:30 Break 4. 16:00 Tips & advice 5. 16:15 Put into practice & playback
- 3. 3 The Chatham House Rule When a meeting, or part thereof, is held under the Chatham House Rule, participants are free to use the information received, but neither the identity nor the affiliation of the speaker(s), nor that of any other participant, may be revealed.
- 4. 4 What happens in Amsterdam stays in Amsterdam
- 5. 5 Real life scenarios & examples - keeping it real and practical
- 8. 8
- 9. 9 Foolproof helped Autoglass increase mobile conversion by 32%
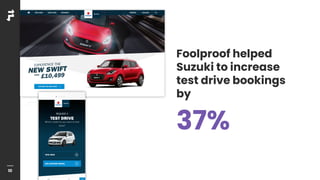
- 10. 10 Foolproof helped Suzuki to increase test drive bookings by 37% Video of Suzuki desktop experience
- 11. 11 Foolproof helped TSB to increase mortgage applications by 45%
- 12. 12 Who we are Tom Ablewhite Principal consultant Jamie Horne Senior consultant David Rogerson Principal consultant Laurent Picalausa Account Manager
- 13. 13 But first… ! A show of hands…. ! We wanted to reveal all the challenges you will face when putting together objectives, measuring results, and acting upon them. ! How do you get it right in the first place?
- 14. 14 A case study
- 15. 15 The £2.5 billion sales growth challenge
- 17. 17 An additional £1.14 per shop
- 19. 19 Strategy: Activate a change in consumer behaviour
- 20. 20
- 21. 21 So they went through the following process: 1. Understood what they were trying to change and why. 2. Wrote down and agreed their basic hypothesis. 3. Agreed OKRs and created a measurement framework. 4. Collected data about what was happening today. 5. Put things in place to collect data when they changed it. 6. Followed-up and collected data, analysed, reported and acted on it. 7. Documented and shared the story of what they did with their stakeholders.
- 22. 22 What was was the most important thing they did?
- 23. 23 I N T R O D U C T I O NUnderstand the behavioural outcome ! What is the customer behaviour you need to change to achieve the business objective? ! What is the outcome you’re trying to achieve?
- 24. 24 I N T R O D U C T I O N Behaviour is… What is behaviour design? ! A person who performs a specific action in a specific context. Behavioural design is… ! a fork off of design thinking ! About designing for cultural change ! It’s a divergent thinking exercise
- 25. 25 I N T R O D U C T I O NWhat is the golden behaviour? ! Behaviour is a solid, specific group of things that you can measure ! The golden behaviour is the one that works And has to be: ⎯ Effective at accomplishing your goal ⎯ Something you want to do ⎯ Something that you can get yourself to do Behaviours Aspirations (solid) (vivid) Effective WantEasy golden behaviour
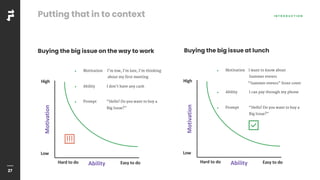
- 26. 26 I N T R O D U C T I O N Behaviour = Motivation + Ability + Prompt The fundamental model: B-MAP ! The behaviour model shows that three elements must converge at the same moment for a behaviour to occur: ⎯ Motivation ⎯ Ability ⎯ Prompt ! When a behavior does not occur, at least one of those three elements is missing. Actionline Motivation Ability Prompts fail here Prompts succeed here High Low Hard to do Easy to do
- 27. 27 I N T R O D U C T I O N Buying the big issue on the way to work Putting that in to context ! Motivation I’m low, I’m late, I’m thinking about my first meeting ! Ability I don’t have any cash ! Prompt “Hello! Do you want to buy a Big Issue?” Motivation Ability High Low Hard to do Easy to do ! Motivation I want to know about Summer events “Summer events” front cover ! Ability I can pay through my phone ! Prompt “Hello! Do you want to buy a Big Issue?” Motivation Ability High Low Hard to do Easy to do Buying the big issue at lunch
- 28. 28 I N T R O D U C T I O NWhat is measurement? ! A set of observations, ! expressed as a quantity, ! that reduces uncertainty.
- 29. 29 Examples of terminology I N T R O D U C T I O N “Market leading levels of service” “Customers no longer rely on human support services” “Successful log-in rate” “Successful log-ins” Sources: Web analytics, survey results, A/B Testing, or Session replay Segments: By device, country, or segment
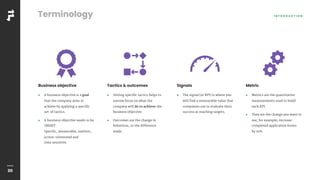
- 30. 30 I N T R O D U C T I O N Business objective ! A business objective is a goal that the company aims to achieve by applying a specific set of tactics. ! A business objective needs to be SMART: Specific, measurable, realistic, action-orientated and time sensitive. Tactics & outcomes ! Setting specific tactics helps to narrow focus on what the company will do to achieve the business objective. ! Outcomes are the change in behaviour, or the difference made. Signals ! The signal (or KPI) is where you will find a measurable value that companies use to evaluate their success at reaching targets. Metric ! Metrics are the quantitative measurements used to build each KPI. ! They are the change you want to see, for example; increase completed application forms by 10%. Terminology
- 31. 31 I N T R O D U C T I O NWe’re here today to: ! Find what’s the best approach when you need to provide metrics driven by business objectives? ! Understand the hidden challenges you will face delivering against a robust. measurement framework. ! Solve those challenges together. ! Prioritise those solutions into a timeline. ! Give you an action plan for a measurement approach. ! Give you some tips & advice along the way. ! This is not a lecture from PowerPoint. ! This is not a training on measurement or dashboard software. ! This is highly interactive & real-life, problem solving session.
- 33. 33 What is it?
- 37. 37 And everyone is making post-it notes
- 38. 38 A LDJ is a creative problem-solving loop
- 39. 39
- 40. 40 It helps us to avoid unstructured discussion
- 41. 41 &
- 42. 42 Define a list of prioritised actions
- 43. 43 Note Stick Vote Prioritise
- 44. 44
- 45. 45 Note alone. EVERY IDEA IS IMPORTANT
- 46. 46
- 47. 47 Stick them up. SO EVERYONE CAN SEE
- 48. 48
- 49. 49 Vote alone. DON’T FOLLOW THE MASSES
- 50. 50
- 51. 51 Prioritise. LET’S DO IT NOW
- 52. 52 But first, some rules…
- 53. 53 Write BIG! ! No misunderstanding. Be SPECIFIC! ! No essays. No CURLY post-its! ! Tear off you post-it downward. Or peel it of side-ways. No devices! ! We need your full attention. But first, some rules…
- 54. 54 The Sailing Boat When we try to use metrics driven by business objectives….
- 55. 55 What is holding us back? What is moving us forward?
- 56. 56 We have… We must…We know… STEP 1 - Note alone What is moving us forward? 5 minutes
- 57. 57 Stick them on to the top half of your picture Group playback 5 minutes
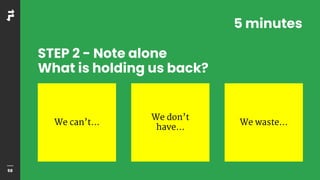
- 58. 58 STEP 2 - Note alone What is holding us back? We don’t have… We waste…We can’t… 5 minutes
- 59. 59 Stick them on to the bottom half of your picture Read individually 5 minutes
- 60. 60 STEP 3 - Together alone Vote on what is holding us back 5 minutes
- 61. 61 Merge the similar ones 5 minutes
- 62. 62 STEP 4 - Group discussion Arrange and select top three 10 minutes
- 64. 64 STEP 5 - Moderated discussion Transform the top 3 into "HMW" Objectives are unachievable! How Might We… Align our teams and our stakeholders to a more relevant set of objectives & key results?
- 65. 65 Get consensus within your groups All to playback 10 minutes
- 66. 66 STEP 6 - Note alone Create solutions 5 minutes
- 67. 67 STEP 7 - Vote alone Vote the best solutions 5 minutes
- 68. 68 STEP 8 - Choose top solutions The most voted win
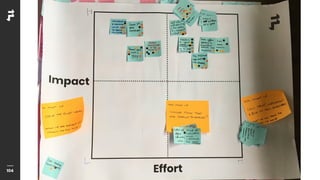
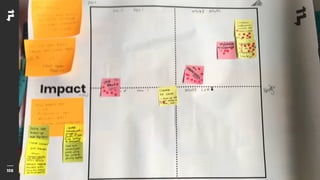
- 69. 69 Impact & Efforts 10 minutes
- 70. 70 Effort Impact
- 71. 71 Get consensus within your groups All to playback 10 minutes
- 72. 72 Let’s get in to 4 groups of 12 people
- 73. 73 q Effort Impact DO IT NOW MAKE A PROJECT FORGET FOR NOW MAKE A TASK Effort
- 74. 74 Break (15:30)
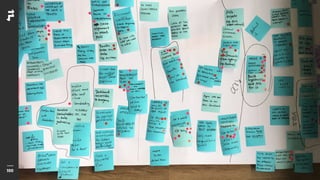
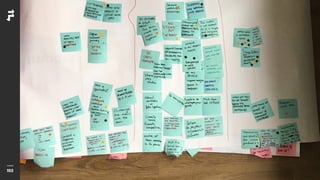
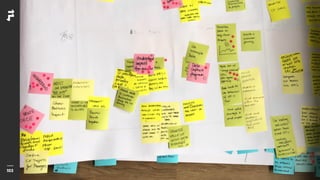
- 75. 75 Results
- 76. 76
- 77. 77
- 78. 78
- 79. 79
- 80. 80 Main opportunities ! Ability to prioritise focus. ! Data based decisions are good. ! Creates transparency. ! Helps track progress. ! Ability to talk the language of the business. ! Ability to build trust in what they are advising. ! Ability to demonstrate success of approach and therefore request more time/resource/budget.
- 81. 81 Main challenges ! The absence or constant shifting of organisational or project goals ! Disconnect between product teams and business objectives ! Not everything is measurable (or perhaps, not easy or efficient to measure) ! Getting buy in to the objectives and metrics ! Lack of understanding of how to analyse data ! Don’t know how to distinguish between metrics and signals or the constant search for the one or two good key indicators ! Lack of time and prioritisation of UX and measurement specifically ! Low UX maturity
- 82. 82 How might we… Highest voted How might we’s 1. Build trust in the owners of the metrics and the metrics themselves? 2. How might we interpret the data without existing benchmarks? 3. How might we find meaning in qualitative data? Solution 1. Co-design metrics together. 2. Choose a baseline and improve/compare from that. 3. Use metrics to create hypotheses, use qualitative methods to understand the full picture.
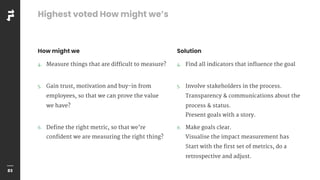
- 83. 83 How might we Highest voted How might we’s 4. Measure things that are difficult to measure? 5. Gain trust, motivation and buy-in from employees, so that we can prove the value we have? 6. Define the right metric, so that we’re confident we are measuring the right thing? Solution 4. Find all indicators that influence the goal 5. Involve stakeholders in the process. Transparency & communications about the process & status. Present goals with a story. 6. Make goals clear. Visualise the impact measurement has Start with the first set of metrics, do a retrospective and adjust.
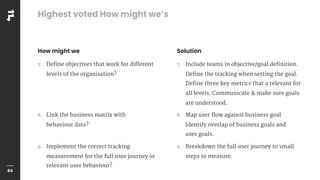
- 84. 84 How might we Highest voted How might we’s 7. Define objectives that work for different levels of the organisation? 8. Link the business matrix with behaviour data? 9. Implement the correct tracking measurement for the full user journey or relevant user behaviour? Solution 7. Include teams in objective/goal definition. Define the tracking when setting the goal. Define three key metrics that a relevant for all levels. Communicate & make sure goals are understood. 8. Map user flow against business goal Identify overlap of business goals and user goals. 9. Breakdown the full user journey to small steps to measure.
- 85. 85 How might we Highest voted How might we’s 10. Find alignment on relevant KPIs across the organisation? 11. Place value on long-term customer experience vs/ short term profits? 12. Identify and access all the data we need to make informed decisions? Solution 10. Customer experience ‘owned’ by C-level. Stakeholder requirements and align KPIs 11. Create a CX vison, follow up with how it relates to customer-based KPIs. Integrate customer experience into corporate strategy. 12. Just start.
- 86. 86 Tips & advice
- 87. 87 Every project we do has a direct or indirect impact on business outcomes. Different types of work have different metrics. Business outcomes What happens to the metrics the business cares about Business strategy and plan What the business decides to focus its effort on The experience customers get What people do and how they feel about it Execution against the plan How the business uses design and technology to change the customer experience
- 88. 88 Business related ! Drive more sales, Increase number of active users, Increase usage of a particular feature- set. Experience related ! Shorten time on task, Increase understanding of how to do a bunch of tasks, Reduce telephone calls to customer support centre. IT/Policy related ! Reduce single sign-on issues by half, Improve up time to 99.9%, Reduce the use of this expensive system. Product delivery related ! Update the roadmap with contextually relevant customer challenges, reduce time to market for new & robust feature-sets. Behaviour-based challenge like we need customers to stop doing "this" and start doing "that". There are many areas in and around a product that will need to change/improve.
- 89. 89 Whatever is agreed, go through the following process: 1. Understand what you are trying to change and why. 2. Write down and agree your basic hypothesis. 3. Agree OKRs and create a measurement framework. 4. Collect data about what is happening today. 5. Put things in place to collect data when you change it. 6. Follow-up and collect data, analyse, report and act on it. 7. Document and share the story of what you did with your stakeholders.
- 90. 90 T I P S & A D V I C E Get set ! Internal team session. ! Gather inventory of previous measurement projects. ! Review of current tagging code. ! Ideate potential areas to measure. Measurement timeline S T E P O N E Measurement workshop ! Present the challenge and principles of measurement. ! Team to agree, assess & prioritise key (SMART) objectives a key results required. ! Agree what digital/operational tactics will be deployed to achieve each objective. ! Agree how each tactic will be measured, what the KPI is and the data breakdown. S T E P T W O Data insight & architecture ! Meet with specialists; Product BA, Data scientist, Digital analytics lead, & Marketing insight. ! Collect data about what is happening today. ! Agree solution design and agree what’s needed to complete. S T E P F O U R Framework & hypotheses ! Write up measurement framework document. ! Advise any additional requirements; tagging, new tools needed & next actions. ! Propose hypotheses to test against. S T E P T H R E E Dashboard ! Write up final report, recommendations and strategic plan. ! Gather initial data against objectives (if available), and assess for quality and design dashboard. ! Governance and cadence of analysis, and how to use the data going forward. S T E P F I V E
- 91. 91 T I P S & A D V I C EAn example Increase sales by 25% to $14M by the end of March 2020 ⎯ Drive more traffic to case studies and services pages ! Sessions / users / engaged sessions ⎯ Increase quality leads ! New vs. returning users ! Successful form completed % ⎯ Understand consumer behaviour ! Pages per session ! User flows ! Landing page conversion rate ⎯ Reduce the response time ! Average response time to request <For each tactic, agree relevant metric required to reach> <Discuss possible sources for each KPI>
- 92. 92 T I P S & A D V I C EAn example output O B J E C T I V E 1 : I N C R E A S E S A L E S B Y 2 5 % T O £ 1 4 M B Y M A R C H 2 0 2 0 Digital tactic KPI Breakdown Notes Additional requirements Drive more traffic to Case Studies and Services Pages Sessions / Users / Engaged sessions Channel, Country, Content type, Device type, Page Internal IP address of Freshdesk and Partners to be excluded Create new engaged session metric: users who have consumed more than one page and scrolled at least 25% on a page. Requires enabling scroll tracking events. Increase Quality Leads New vs. Returning Users channel, country, content type, device type, page Recommend analysis to see what quality leads characteristics are before seeing if we can guess. Recommend a tool like Jumplead to see where users are from (what organisation) to help rank quality. Successful form completed % channel, country, content type, device type, page Event already setup ec: Form ea: Successful Submission, el: New business Create calculated metric % of applications submitted Understand consumer behaviour Pages per session channel, country, content type, device type, personas Personas: job hunters, professionals Create new segments for different personas to the website User Flows channel, country, content type, device type, personas Especially Users' path from 'services' to 'contact' Create new segments for different personas to the website Landing page conversion rate channel, country, content type, device type, personas Create new segments for different personas to the website Reduce the response time by 10% Average response time to request channel, country, content type, device type Recommend using either a ticketing system (rather than basic email) for all forms on website, example: Freshdesk, Zendesk, Salseforce AND/OR dynamic number tracking solutions like ResponseTap, Callroot and Salesforce.
- 93. 93 Next steps: engage & test ! Do we have access to this information? Is it set up correctly? Do you need new tools? ! It may open bigger discussions like data architecture & platforms review. ! However, we get to a point where systems are correctly tagged, tested & live and monitoring what's important. ! We then need to gather insight & intelligence and make data accessible through dashboards to understand & review. ! Create further hypotheses. ! Before optimising, testing, uplifting, and keeping on track.
- 94. 94 Measurement principles ! Make it simple. (no more than 3/4 objectives) ! Make it relevant. (be specific) ! Use tools that are already available. ! Get group consensus on a measurement plan. ! Identify the ‘hero’ tasks. ! Use more than one measurement. ! Compare to your own benchmarks. ! Use multiple methods. ! Measure now, and agree when next. ! Present back as a visual scorecard or dashboard.
- 96. 96 ! Get into pairs or threes. ! Read through & select a brief. (5 mins) ! Break it down and understand the business objectives. (5 mins) ! Identify the outcomes needed to achieve the business objectives. (10 mins) ! Agree tactics, signals & metrics. (10 mins) ! Turn to the group beside you and playback what you did. (5 mins each group) Putting it in to practice
- 97. 97 Brief 01: Enable digital HR service Briefs ! Design an experience that enables employee HR self-service to drive behavioral change from a ‘Line Manager first’ culture. The business objective of this is to lower the HR cost center by reducing reliance on HR staff. Brief 02: Normalise online life insurance ! Design an experience that enables customers to confidently take out the right life insurance for them. The business objective is an increase in the overall number of life insurance policies being taken out online in the U.K, primarily from customers who are not also taking out mortgages.
- 98. 98 Seebohm House 2-4 Queen Street Norwich NR2 4SQ +44 (0) 1603 230 800 25 Seah Street #03-02 Singapore 188381 +65 6336 9270 45 Folgate Street Spitalfields London E1 6GL +44 (0) 20 7539 3840 Contact Thank you! Tom Ablewhite Jamie Horne David Rogerson Laurent Picalausa
- 99. 99 Miscellaneous
- 100. 100
- 101. 101
- 102. 102
- 103. 103
- 104. 104
- 105. 105
- 106. 106
- 107. 107


