Location via proxy:   [ UP ]  
[Report a bug]   [Manage cookies]                
SlideShare a Scribd company logo
© 2015 Adobe Systems Incorporated. All Rights Reserved. Adobe Confidential.
2015 HOLIDAY SHOPPING REPORT
ADOBE DIGITAL INDEX
© 2015 Adobe Systems Incorporated. All Rights Reserved. Adobe Confidential.
Methodology
2
Adobe
Analytics
Adobe
Mobile Services
Adobe
Social
Most comprehensive and accurate report of its kind in industry
 Adobe measures 80% of all online transactions from top 100 U.S. retailers **
 $7.50 of every $10 spent online with top 500 U.S. retailers go through Adobe Marketing Cloud **
 Report based on analysis of 1 trillion visits to over 4,500 retail websites and 55 million SKUs
 Companion research based on survey with 400+ U.S. consumers
Data from different Adobe Marketing Cloud solutions:
Based on analysis of aggregated and anonymous data
** Latest IR Top 500 Report 2015
Adobe Marketing Cloud has seen strong
adoption in the retail space – Adobe’s
leadership in the Web analytics market has
given it a big advantage here. Retailers need
“big data” insights to optimize their cross-
channel digital experiences and campaigns –
and deliver the personalized, relevant
experiences that inspire customer loyalty and
advocacy. – Melissa Webster, IDC
© 2015 Adobe Systems Incorporated. All Rights Reserved. Adobe Confidential.
Key Trends
3
83 billion spent online during 2015 holiday season (November and December)
Higher than expected growth (+12.7%) due to last minute sales surge
Shoppers prefer Phones to Tablets, and iOS to Android
Early birds got best prices, high out-of-stock after Thanksgiving
Phone traffic exceeds desktop to drive last minute sales growth, tablets decline
Email and Display Advertising gaining momentum
1
2
3
4
5
6
© 2015 Adobe Systems Incorporated. All Rights Reserved. Adobe Confidential.
83 billion spent online during 2015 holiday season
During November and December US
retailers raked in an impressive $83 billion
 31 billion-dollar-days
 Each day between Nov 22- Dec 22
accounted for more than a billion in
online sales.
 Holiday season sales up 12.7% over 2014.
US retailers are more dependent on the
holiday shopping season than those of any
other country as this key time period
represents 19.6% of annual online sales.
© 2015 Adobe Systems Incorporated. All Rights Reserved. Adobe Confidential.
Higher than expected growth due to last minute sales surge
Last minute shoppers push year-over-year growth for Dec 23rd above
56%, indicating growing confidence in online shopping.
The week prior to Christmas is traditional a less important online
shopping time, as consumers historically have chosen to shop at local
retailers, but it 2015 that started to change.
5
Traffic growth drove sales during last week prior to
Christmas; AOV stayed flat and Conversion dipped
Average consumer spent $113 per purchase
 Average order value peaked on Thanksgiving and
stayed flat through-out the rest of the season.
2.98 percent of visits resulted in a purchase
 Consumers felt most confident pulling the trigger on
Cyber Monday
 Conversion fell during despite heavy traffic during the
week prior to Christmas
Highest YoY sales growth
despite falling conversion
rates during the last week
before Christmas
© 2015 Adobe Systems Incorporated. All Rights Reserved. Adobe Confidential.
Phone traffic exceeds desktop to drive last minute sales growth
Phone visit share peaked on Christmas day. Phone: 49%, Desktop/Laptop: 38%, Tablet: 13%
 On Average 39% of retail traffic came from phones, and only 11% from tablets
6
The share of visits from phones nearly
exceeded that from desktop and tablet
combined on Christmas day.
Year-over-year, the share of
traffic from phones has
increased while desktop and
tablet has decreased.
© 2015 Adobe Systems Incorporated. All Rights Reserved. Adobe Confidential.
Shopper prefer Phones to Tablets, and iOS to Android
7
Tablets are no longer the preferred mobile shopping tool. Consumers browse and buy more on phones
 Phones drove 17% of sales despite having much lower average conversion than tablets (1.7% to 2.8%)
iOS phones and tablets combined to contribute 75% of mobile sales. Only 23% from Android.
 Android tablet users made larger purchase at $132 per order compared to $114 for iPad users
© 2015 Adobe Systems Incorporated. All Rights Reserved. Adobe Confidential.
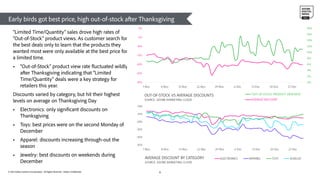
Early birds got best price, high out-of-stock after Thanksgiving
8
“Limited Time/Quantity” sales drove high rates of
“Out-of-Stock” product views. As customer search for
the best deals only to learn that the products they
wanted most were only available at the best price for
a limited time.
 “Out-of-Stock” product view rate fluctuated wildly
after Thanksgiving indicating that “Limited
Time/Quantity” deals were a key strategy for
retailers this year.
Discounts varied by category, but hit their highest
levels on average on Thanksgiving Day
 Electronics: only significant discounts on
Thanksgiving
 Toys: best prices were on the second Monday of
December
 Apparel: discounts increasing through-out the
season
 Jewelry: best discounts on weekends during
December
© 2015 Adobe Systems Incorporated. All Rights Reserved. Adobe Confidential.
Email and Display Advertising gaining momentum
9
 Email drove 15% of traffic to retailers. 6 percent more than 2014.
 Display advertising drove 41% more traffic over 2014
 Search and Referral sources still most important
 Social is key to awareness, but not a good traffic referrer
© 2015 Adobe Systems Incorporated. All Rights Reserved. Adobe Confidential.
Social & Display best marketing channels for deals
1
0
SURVEY: Signs of Consumers Getting More
Efficient at Holiday Shopping:
The majority (58%) report anticipating spending
as much time as they did last year in terms of
holiday shopping, but a quarter (25%) say they
expect to spend less time this year. Those 18-34
(28%) and 35-49 (32%) are the most likely to
anticipate spending less time on holiday
shopping. Given that those 18-34 are the biggest
online spenders, we can assume they see online
shopping as a time saver.
39% of respondents say they have gotten more
efficient at holiday shopping over the last several
years. Those 18-34 are the most likely to say this
(52%).
For discounts of 10% or more:
 Shoppers have the best chances on display ads and
social media
 Search engines are least effective (more than 3 times
less likely than Display)
© 2015 Adobe Systems Incorporated. All Rights Reserved. Adobe Confidential.
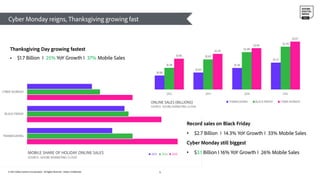
Cyber Monday reigns, Thanksgiving growing fast
11
Thanksgiving Day growing fastest
 $1.7 Billion Ι 25% YoY Growth Ι 37% Mobile Sales
Record sales on Black Friday
• $2.7 Billion Ι 14.3% YoY Growth Ι 33% Mobile Sales
Cyber Monday still biggest
• $3.1 Billion Ι 16% YoY Growth Ι 26% Mobile Sales
© 2015 Adobe Systems Incorporated. All Rights Reserved. Adobe Confidential.
Singles Day fails to capture the American consumer
US sales barely surpass normal
 $1.35 Billion spent by US consumers online, +10% YoY
 Expected to rank 24th among top online shopping days of 2015
 Average discount increased by 2% to 20%
 Highest discount level seen so far this holiday season
 Promotions associated with both Veteran’s Day and
Singles Day
 Top 4 products by revenue:
 Air Jordan Nike Shoes
 PS4
 Samsung Curve LED 4k TV
 Apple Ipad Air/Mini 2
 Top 3 products most likely to run out of stock:
 Star Wars The Black Series 6-Inch Kylo Ren
 Shopkins Shoppies Season 1 Dolls
 Xbox Elite Wireless Controller
 $5.02 spent per internet user in the US
 Phones used for 24% of browsing, 11% of online sales
 Tablets used for 10% of browsing, 9% of online sales
Prime Day got more buzz
 Singles Day was mentioned 75k times
 Global English mentions
 Amazon Prime Day created 300k mentions
 Black Friday 2014 had 3 million.
Mostly foreign chatter:
 26% mentions of Singles Day from US vs. 74% of Prime Day
chatter
 Sentiment split; 40% sadness, 35% joy or admiration, 5%
anticipation, and 20% surprise
 Sadness buzz mostly due to a baby formula shortage in
Australia associated with Singles Day demand
Alibaba mentioned 5x more (50k+) than normal,
 Only 2% of the mentions (2.5 million) Amazon got on
Prime Day.
Singles Day drowned out Veteran’s Day talk in the US
 Americans love Veterans Day with 500k mentions as of
Noon EST and looks to close in on 1 million by end of day
 13x more than Singles Day
VS
© 2015 Adobe Systems Incorporated. All Rights Reserved. Adobe Confidential.
45%
55%
Social Mentions
Author by Gender
Male Female
17,002,874
16,034,411
5,394,236
3,144,804
403,734 238,532
Amazon eBay Target Walmart Macys Nordstrom
Store Social Mentions
Amazon and eBay were most talked about retailers
Social mentions:
• Online only retailers: Amazon barely beat out eBay as most talked
about pure-play retailers.
• Big Box: Target punched above its weight to Walmart
• Department Stores: Macy’s heard nearly twice as much from its
customers as Nordstrom.
© 2015 Adobe Systems Incorporated. All Rights Reserved. Adobe Confidential.
China, US have largest holiday season.
China’s massive and growing economy led it to
have the most online shopping during the holiday
season.
Europe is led by United Kingdom in total sales,
followed by Germany and France.
In Asia, Japanese retailers will brought in the most
revenue during November and December, followed
by Australia.
© 2015 Adobe Systems Incorporated. All Rights Reserved. Adobe Confidential.
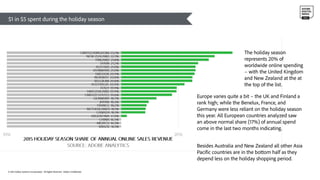
$1 in $5 spent during the holiday season
Europe varies quite a bit – the UK and Finland a
rank high; while the Benelux, France, and
Germany were less reliant on the holiday season
this year. All European countries analyzed saw
an above normal share (17%) of annual spend
come in the last two months indicating.
Besides Australia and New Zealand all other Asia
Pacific countries are in the bottom half as they
depend less on the holiday shopping period.
The holiday season
represents 20% of
worldwide online spending
– with the United Kingdom
and New Zealand at the at
the top of the list.
© 2015 Adobe Systems Incorporated. All Rights Reserved. Adobe Confidential.
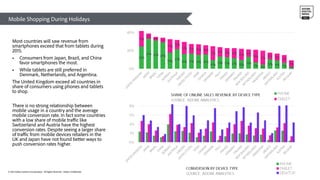
Mobile Shopping During Holidays
Most countries will saw revenue from
smartphones exceed that from tablets during
2015.
 Consumers from Japan, Brazil, and China
favor smartphones the most.
 While tablets are still preferred in
Denmark, Netherlands, and Argentina.
The United Kingdom exceed all countries in
share of consumers using phones and tablets
to shop.
There is no strong relationship between
mobile usage in a country and the average
mobile conversion rate. In fact some countries
with a low share of mobile traffic like
Switzerland and Austria have the highest
conversion rates. Despite seeing a larger share
of traffic from mobile devices retailers in the
UK and Japan have not found better ways to
push conversion rates higher.

More Related Content

ADI 2015 Holiday Shopping Report

  • 1. © 2015 Adobe Systems Incorporated. All Rights Reserved. Adobe Confidential. 2015 HOLIDAY SHOPPING REPORT ADOBE DIGITAL INDEX
  • 2. © 2015 Adobe Systems Incorporated. All Rights Reserved. Adobe Confidential. Methodology 2 Adobe Analytics Adobe Mobile Services Adobe Social Most comprehensive and accurate report of its kind in industry  Adobe measures 80% of all online transactions from top 100 U.S. retailers **  $7.50 of every $10 spent online with top 500 U.S. retailers go through Adobe Marketing Cloud **  Report based on analysis of 1 trillion visits to over 4,500 retail websites and 55 million SKUs  Companion research based on survey with 400+ U.S. consumers Data from different Adobe Marketing Cloud solutions: Based on analysis of aggregated and anonymous data ** Latest IR Top 500 Report 2015 Adobe Marketing Cloud has seen strong adoption in the retail space – Adobe’s leadership in the Web analytics market has given it a big advantage here. Retailers need “big data” insights to optimize their cross- channel digital experiences and campaigns – and deliver the personalized, relevant experiences that inspire customer loyalty and advocacy. – Melissa Webster, IDC
  • 3. © 2015 Adobe Systems Incorporated. All Rights Reserved. Adobe Confidential. Key Trends 3 83 billion spent online during 2015 holiday season (November and December) Higher than expected growth (+12.7%) due to last minute sales surge Shoppers prefer Phones to Tablets, and iOS to Android Early birds got best prices, high out-of-stock after Thanksgiving Phone traffic exceeds desktop to drive last minute sales growth, tablets decline Email and Display Advertising gaining momentum 1 2 3 4 5 6
  • 4. © 2015 Adobe Systems Incorporated. All Rights Reserved. Adobe Confidential. 83 billion spent online during 2015 holiday season During November and December US retailers raked in an impressive $83 billion  31 billion-dollar-days  Each day between Nov 22- Dec 22 accounted for more than a billion in online sales.  Holiday season sales up 12.7% over 2014. US retailers are more dependent on the holiday shopping season than those of any other country as this key time period represents 19.6% of annual online sales.
  • 5. © 2015 Adobe Systems Incorporated. All Rights Reserved. Adobe Confidential. Higher than expected growth due to last minute sales surge Last minute shoppers push year-over-year growth for Dec 23rd above 56%, indicating growing confidence in online shopping. The week prior to Christmas is traditional a less important online shopping time, as consumers historically have chosen to shop at local retailers, but it 2015 that started to change. 5 Traffic growth drove sales during last week prior to Christmas; AOV stayed flat and Conversion dipped Average consumer spent $113 per purchase  Average order value peaked on Thanksgiving and stayed flat through-out the rest of the season. 2.98 percent of visits resulted in a purchase  Consumers felt most confident pulling the trigger on Cyber Monday  Conversion fell during despite heavy traffic during the week prior to Christmas Highest YoY sales growth despite falling conversion rates during the last week before Christmas
  • 6. © 2015 Adobe Systems Incorporated. All Rights Reserved. Adobe Confidential. Phone traffic exceeds desktop to drive last minute sales growth Phone visit share peaked on Christmas day. Phone: 49%, Desktop/Laptop: 38%, Tablet: 13%  On Average 39% of retail traffic came from phones, and only 11% from tablets 6 The share of visits from phones nearly exceeded that from desktop and tablet combined on Christmas day. Year-over-year, the share of traffic from phones has increased while desktop and tablet has decreased.
  • 7. © 2015 Adobe Systems Incorporated. All Rights Reserved. Adobe Confidential. Shopper prefer Phones to Tablets, and iOS to Android 7 Tablets are no longer the preferred mobile shopping tool. Consumers browse and buy more on phones  Phones drove 17% of sales despite having much lower average conversion than tablets (1.7% to 2.8%) iOS phones and tablets combined to contribute 75% of mobile sales. Only 23% from Android.  Android tablet users made larger purchase at $132 per order compared to $114 for iPad users
  • 8. © 2015 Adobe Systems Incorporated. All Rights Reserved. Adobe Confidential. Early birds got best price, high out-of-stock after Thanksgiving 8 “Limited Time/Quantity” sales drove high rates of “Out-of-Stock” product views. As customer search for the best deals only to learn that the products they wanted most were only available at the best price for a limited time.  “Out-of-Stock” product view rate fluctuated wildly after Thanksgiving indicating that “Limited Time/Quantity” deals were a key strategy for retailers this year. Discounts varied by category, but hit their highest levels on average on Thanksgiving Day  Electronics: only significant discounts on Thanksgiving  Toys: best prices were on the second Monday of December  Apparel: discounts increasing through-out the season  Jewelry: best discounts on weekends during December
  • 9. © 2015 Adobe Systems Incorporated. All Rights Reserved. Adobe Confidential. Email and Display Advertising gaining momentum 9  Email drove 15% of traffic to retailers. 6 percent more than 2014.  Display advertising drove 41% more traffic over 2014  Search and Referral sources still most important  Social is key to awareness, but not a good traffic referrer
  • 10. © 2015 Adobe Systems Incorporated. All Rights Reserved. Adobe Confidential. Social & Display best marketing channels for deals 1 0 SURVEY: Signs of Consumers Getting More Efficient at Holiday Shopping: The majority (58%) report anticipating spending as much time as they did last year in terms of holiday shopping, but a quarter (25%) say they expect to spend less time this year. Those 18-34 (28%) and 35-49 (32%) are the most likely to anticipate spending less time on holiday shopping. Given that those 18-34 are the biggest online spenders, we can assume they see online shopping as a time saver. 39% of respondents say they have gotten more efficient at holiday shopping over the last several years. Those 18-34 are the most likely to say this (52%). For discounts of 10% or more:  Shoppers have the best chances on display ads and social media  Search engines are least effective (more than 3 times less likely than Display)
  • 11. © 2015 Adobe Systems Incorporated. All Rights Reserved. Adobe Confidential. Cyber Monday reigns, Thanksgiving growing fast 11 Thanksgiving Day growing fastest  $1.7 Billion Ι 25% YoY Growth Ι 37% Mobile Sales Record sales on Black Friday • $2.7 Billion Ι 14.3% YoY Growth Ι 33% Mobile Sales Cyber Monday still biggest • $3.1 Billion Ι 16% YoY Growth Ι 26% Mobile Sales
  • 12. © 2015 Adobe Systems Incorporated. All Rights Reserved. Adobe Confidential. Singles Day fails to capture the American consumer US sales barely surpass normal  $1.35 Billion spent by US consumers online, +10% YoY  Expected to rank 24th among top online shopping days of 2015  Average discount increased by 2% to 20%  Highest discount level seen so far this holiday season  Promotions associated with both Veteran’s Day and Singles Day  Top 4 products by revenue:  Air Jordan Nike Shoes  PS4  Samsung Curve LED 4k TV  Apple Ipad Air/Mini 2  Top 3 products most likely to run out of stock:  Star Wars The Black Series 6-Inch Kylo Ren  Shopkins Shoppies Season 1 Dolls  Xbox Elite Wireless Controller  $5.02 spent per internet user in the US  Phones used for 24% of browsing, 11% of online sales  Tablets used for 10% of browsing, 9% of online sales Prime Day got more buzz  Singles Day was mentioned 75k times  Global English mentions  Amazon Prime Day created 300k mentions  Black Friday 2014 had 3 million. Mostly foreign chatter:  26% mentions of Singles Day from US vs. 74% of Prime Day chatter  Sentiment split; 40% sadness, 35% joy or admiration, 5% anticipation, and 20% surprise  Sadness buzz mostly due to a baby formula shortage in Australia associated with Singles Day demand Alibaba mentioned 5x more (50k+) than normal,  Only 2% of the mentions (2.5 million) Amazon got on Prime Day. Singles Day drowned out Veteran’s Day talk in the US  Americans love Veterans Day with 500k mentions as of Noon EST and looks to close in on 1 million by end of day  13x more than Singles Day VS
  • 13. © 2015 Adobe Systems Incorporated. All Rights Reserved. Adobe Confidential. 45% 55% Social Mentions Author by Gender Male Female 17,002,874 16,034,411 5,394,236 3,144,804 403,734 238,532 Amazon eBay Target Walmart Macys Nordstrom Store Social Mentions Amazon and eBay were most talked about retailers Social mentions: • Online only retailers: Amazon barely beat out eBay as most talked about pure-play retailers. • Big Box: Target punched above its weight to Walmart • Department Stores: Macy’s heard nearly twice as much from its customers as Nordstrom.
  • 14. © 2015 Adobe Systems Incorporated. All Rights Reserved. Adobe Confidential. China, US have largest holiday season. China’s massive and growing economy led it to have the most online shopping during the holiday season. Europe is led by United Kingdom in total sales, followed by Germany and France. In Asia, Japanese retailers will brought in the most revenue during November and December, followed by Australia.
  • 15. © 2015 Adobe Systems Incorporated. All Rights Reserved. Adobe Confidential. $1 in $5 spent during the holiday season Europe varies quite a bit – the UK and Finland a rank high; while the Benelux, France, and Germany were less reliant on the holiday season this year. All European countries analyzed saw an above normal share (17%) of annual spend come in the last two months indicating. Besides Australia and New Zealand all other Asia Pacific countries are in the bottom half as they depend less on the holiday shopping period. The holiday season represents 20% of worldwide online spending – with the United Kingdom and New Zealand at the at the top of the list.
  • 16. © 2015 Adobe Systems Incorporated. All Rights Reserved. Adobe Confidential. Mobile Shopping During Holidays Most countries will saw revenue from smartphones exceed that from tablets during 2015.  Consumers from Japan, Brazil, and China favor smartphones the most.  While tablets are still preferred in Denmark, Netherlands, and Argentina. The United Kingdom exceed all countries in share of consumers using phones and tablets to shop. There is no strong relationship between mobile usage in a country and the average mobile conversion rate. In fact some countries with a low share of mobile traffic like Switzerland and Austria have the highest conversion rates. Despite seeing a larger share of traffic from mobile devices retailers in the UK and Japan have not found better ways to push conversion rates higher.