Location via proxy:   [ UP ]  
[Report a bug]   [Manage cookies]                
SlideShare a Scribd company logo
4Q12 Results
February, 2013
2012 Highlights

Operational

 Investments of R$ 831 million in 2012, a 12% increase in comparison with 2011
 D
Decrease of 19% i SAIDI and 15% i SAIFI
f
in
d
in
 1.0% increase in energy consumption

Financial

$ ,
,
 Gross revenues totaled R$ 15,314 million, a 0.5% increase
 Ebitda of R$ 656 million in 2012, a reduction of 77%
 Net income of R$ 108 million, a 93% decrease

Regulatory

 O J
On January 24th, 2013 it was applied th i d of th extraordinary t iff review b
2013,
li d the index f the t
di
tariff
i
based on th E
d
the Energy C t
Costs
Reduction Program, regulated through the Provisional Measure 579, converted into Law No. 12,783 in January
14th, 2013. The average tariff reduction is estimated in 20%, effective from January 24th, 2013

Dividends

.
 The Management proposes proceeds distribution in the amount of R$ 55 million, representing 25% of 2012
distributable income plus interest on equity, composed of R$ 0.31 per common share and R$ 0.34 per preferred
share

Eletrobrás Case

 In February 21th, 2013, State Court published decision in favor of AES Eletropaulo, revoking the decision of 1stt
instance of December 12, 2012
2
2012 Highlights
 Safety: 19% drop in accidents with employees and contractors, being recorded one fatality with contractors and

Social

19% decrease in fatal accidents with the population
I
Innovation and Excellence for Customer Satisfaction: customer satisfaction index reached 80.6% i th
ti
dE
ll
f C t
S ti f ti
t
ti f ti i d
h d 80 6% in the
Abradee research, the highest since the survey was started
 Development and Enhancement of Communities: investment of R$ 122 million in social projects, energy
efficiency and legal access to electric power, benefiting about 1.7 million people

Environment

 Efficient Use of Energy Resources: R$ 44 million invested in 520 units - such as hospitals, schools and public
buildings, generating efficiency and having their electricity consumption reduced by 38,846 MW

Awards

 National Quality Award - PNQ 2012, of Fundação Nacional da Qualidade – FNQ
 ISE- Corporate Sustainability Index of BM&FBovespa - 2012/2013 - portfolio for the 8th consecutive year
 Brazil's most admired company, for the fourth consecutive year, in the category "Electricity Supply" award
.
sponsored by the magazine Carta Capital
 Child Award, Fundação Abrinq/ Save the Children, for attending to children up to 6 years in the Centro de
Educação Infantil Luz e Lápis
 Guia Exame de Sustentabilidade: AES Brasil group was recognized by Exame magazine as one out of
recognized,
magazine,
twenty model companies in sustainability
.

3
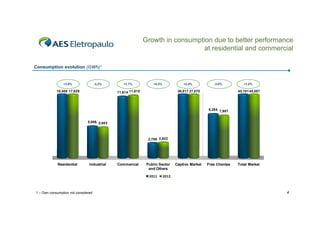
Growth in consumption due to better performance
at residential and commercial
Consumption evolution (GWh)¹

+3.8%

-3.2%

16,408 17,029

+1.7%

+4.4%

+2.0%

11,614 11,815

-3.6%

36,817 37,570

+1.0%

45,101 45,557

8,284 7,987
5,996 5,803

2,799 2,922

Residential

Industrial

Commercial

Public Sector
and Others
2011

1 – Own consumption not considered

Captive Market

Free Clientes

Total Market

2012

4
SAIDI below regulatory limits and in
its lowest level since 2006
SAIDI¹ (last 12 months)

SAIDI1 (LTM)

-17%

10.09

11.86

2009

9.32

8.68

10.60

10.36

2010

2011

SAIDI Aneel Reference

►

8.67

8.49

9.87

8.35

2012

jan/13

8.23

jan/12

jan/13

8.23

SAIDI (hours)

SAIDI (hours)

ANEEL Reference for 2012 SAIDI: 8.49 hours

1 - System Average Interruption Duration Index
Source: ANEEL and AES Eletropaulo

5
SAIFI remains below regulatory limits

SAIFI¹ (last 12 months)
7.87
7 87

7.39

SAIFI1 (LTM)

6.93

6.87

6.64
-15%

6.17

2009

5.46

5.45

2010

2011

SAIFI Aneel Reference

►

4.65

4.55

2012

jan/13

SAIFI (times)

5.37

jan/12

4.55

jan/13

SAIFI (times)

ANEEL Reference for 2012 SAIDI: 6.64 times

1 - System Average Interruption Duration Index
Source: ANEEL and AES Eletropaulo

6
Losses level below the regulatory reference
for the 3rd Cycle of Tariff Reset
Losses (last 12 months)

11.8
11 8

10.9

Regulatory Reference² - Total Losses (last 12 months)

10.5

10.2

5.3

4.4

4.0

6.5

6.5

2010

2011

2012

9.8

9.4

2013/2014

2014/2015

6.1

2009

10.3

4.1

6.5

10.6

Technical Losses ¹

2011/2012

2012/2013

Non Technical Losses

1 – In January 2012, the Company improved the assessment of the technical losses. As a consequence of this improvement, technical losses calculated are in a level of 6.1%.
2 – Values estimated by the Company to make them comparable with the reference for non-technical losses determined by the Aneel

7
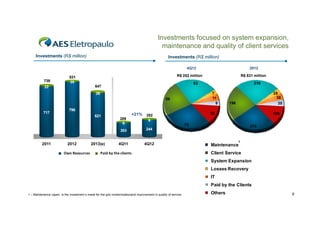
Investments focused on system expansion,
maintenance and quality of client services
Investments (R$ million)

Investments (R$ million)
4Q12

800 

739

R$ 252 million

831
35

R$ 831 million

216

63

647

22

2012

700 

7
11
9

26
600 

59

500 
400 

717

28
36
35

196

796
621

300 

+21%

32

252
9

200 
200

209
6

100 

203

244

4Q11

4Q12

108

72

213

0 

2011

2012
Own Resources

2013(e)

Paid by the clients

1

Maintenance

Client Service
System Expansion
Losses Recovery
IT
Paid by the Clients

1 – Maintenance capex is the investment s made for the grid modernizationand improvement in quality of service

Others

8
Gross revenues reflects expansion in residential
and commercial and new tariff
Gross Revenues (R$ million)

+0.5%

15.240

15.314

5.405

5.354

3.838

3.885

23

72

1.373
13 3

1.308
1 308

23

72

2.453

2.556

9.813

2011

9.887

+1.2%

4T11
4T12
2012
Net revenue ex‐construction revenue
Construction revenues
Deduction to Gross Revenue

9
Operating Costs and Expenses ¹ (R$ million)

Higher average cost of energy purchased
due to energy from auctions, exchange variation
and adjustment of bilateral contract

+21%

8,390
6,940

1,531

1,251
1 251
+27%

5,689

2011

6,858

1,827
358
1,469

2,321
398
1,923

2012

4Q11

4Q12

Energy Supply and Transmission Charges

1 - Depreciation and other operating income and expenses are not included

PMS² and Other Expenses

2 - Personnel, Material and Services

10
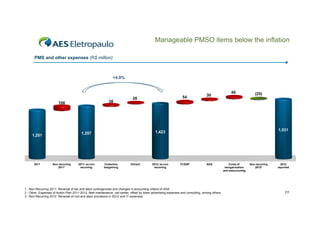
Manageable PMSO items below the inflation
PMS and other expenses (R$ million)

+4.9%
4 9%

38

106

1,251

1,251

2011

Non recurring
2011¹

49

(25)

1,507

1,555

1,531

1,531

ADA

Costs of
reorganization
and restructuring

Non recurring
2012³

2012
reported

54

28

30

1,357

1,357

1,423

1,423

1,423

2011: ex non
recurring

Collective
bargaining

Others²

2012: ex non
recorring

FCESP

1 - Non Recurring 2011: Reversal of tax and labor contingencies and changes in accounting criteria of ADA
2 - Other: Expenses of Action Plan 2011-2012, fleet maintenance, call center, offset by lower advertising expenses and consulting, among others.
3 - Non Recurring 2012: Reversal of civil and labor provisions in 2Q12 and IT expenses

11
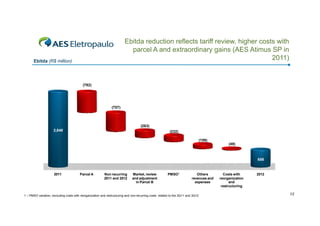
Ebitda reduction reflects tariff review, higher costs with
p
parcel A and extraordinary g
y gains (
(AES Atimus SP in
2011)

Ebitda (R$ million)

(782)

(707)

(263)
2,848

(232)
(159)

2,066

(49)
1,358
1 358

1,126

967
656

2011

Parcel A

Non recurring
2011 and 2012

Market,
Market review
and adjustment
in Parcel B

PMSO¹

Others
revenues and
expenses

1 – PMSO variation, excluding costs with reorganization and restructuring and non-recurring costs related to the 3Q11 and 3Q12

Costs with
reorganization
and
restructuring

2012

12
Lower interest and fair value of assets related to
concession impacted the financial results
p
Financial Result (R$ million)

2011

2012

(21)

4Q11
(22)

143%

4Q12
(2)
- 93%

(52)

13
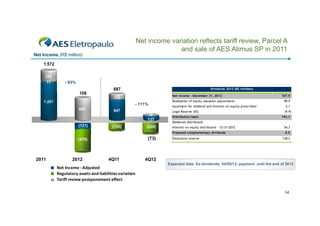
Net income variation reflects tariff review, Parcel A
and sale of AES Atimus SP in 2011
Net Income (R$ million)
1.572
354
11

- 93%

108

Dividends 2012 (R$ milhões)

687

Net income - December 31, 2012

172
1.207
1 207

- 111%
699

647

18
137
(121)

(132)

(228)
(
)

Realization of equity valuation adjustments
Ajustment for dividend and Interest on equity prescribed
Legal Reserve (5%)
Distribution basis
Dividends distributed
Interest on equity distributed - 12/31/2012
Proposed complementary dividends

(73)

(470)

2011

2012

4Q11

Net Income ‐ Adjusted
Regulatory assets and liabilities variation
Regulatory assets and liabilities variation
Tariff review postponement effect

Estatutory reserve

107.9
89.9
89 9
5.1
(9.9)
193.1
54.3
0.5
138.2

4Q12
Expected date: Ex-dividends: 04/05/13; payment: until the end of 2013

14
Lower cash generation due to tariff review and
higher expenses with Parcel A

Operational Cash Generation (R$ million)

Final Cash Balance (R$ million)

- 48%

- 41%

2,416
1,218

1,390
814

2011

2012

2011

2012

15
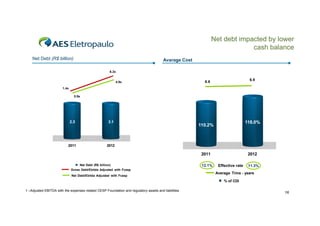
Net debt impacted by lower
cash balance
Net Debt (R$ billion)

Avarage Cost
6.2x
4.9x

6.9

6.6

1.4x
0.9x

2.3

3.1

2011

2012

118.0%

110.2%
110 2%

2011
Net Debt (R$ billion)

12.1%

2012
Effective rate

11.3%

Gross Debt/Ebitda Adjusted with Fcesp
Net Debt/Ebitda Adjusted with Fcesp

Average Time - years
% of CDI

1 –Adjusted EBITDA with the expenses related CESP Foundation and regulatory assets and liabilities.

16
Focus on efficiency
Main initiatives

 Change of corporate headquarters
g

Operational

 Optimization of operational bases
 Stores review by increasing of outsourcing
 Organizational restructuring
 30% growth in the productivity of operations teams of the regional north (being implemented for
other regional)
 Increase in the number of clients served by automatic channels
 Renegotiation of supplies contracts
f

 Sale of real estate with an estimated value of $ 239 million, of which R$ 160 million was already

Financial
Fi
i l

sold
 Covenants renegotiation and lengthening debt profile
 Reducing manageable costs estimated at R$ 100 million from 2013

17
4Q12 Results
The statements contained in this document with regard to the
business prospects, projected operating and fi
b i
t
j t d
ti
d financial results,
i l
lt
and growth potential are merely forecasts based on the
expectations of the Company’s Management in relation to its
future performance.
Such estimates are highly dependent on market behavior and
on the conditions affecting Brazil’s macroeconomic
performance as well as the electric sector and international
market, and they are therefore subject to changes.

More Related Content

Apresentacao aes eletropaulo_4_q12_eng

  • 2. 2012 Highlights Operational  Investments of R$ 831 million in 2012, a 12% increase in comparison with 2011  D Decrease of 19% i SAIDI and 15% i SAIFI f in d in  1.0% increase in energy consumption Financial $ , ,  Gross revenues totaled R$ 15,314 million, a 0.5% increase  Ebitda of R$ 656 million in 2012, a reduction of 77%  Net income of R$ 108 million, a 93% decrease Regulatory  O J On January 24th, 2013 it was applied th i d of th extraordinary t iff review b 2013, li d the index f the t di tariff i based on th E d the Energy C t Costs Reduction Program, regulated through the Provisional Measure 579, converted into Law No. 12,783 in January 14th, 2013. The average tariff reduction is estimated in 20%, effective from January 24th, 2013 Dividends .  The Management proposes proceeds distribution in the amount of R$ 55 million, representing 25% of 2012 distributable income plus interest on equity, composed of R$ 0.31 per common share and R$ 0.34 per preferred share Eletrobrás Case  In February 21th, 2013, State Court published decision in favor of AES Eletropaulo, revoking the decision of 1stt instance of December 12, 2012 2
  • 3. 2012 Highlights  Safety: 19% drop in accidents with employees and contractors, being recorded one fatality with contractors and Social 19% decrease in fatal accidents with the population I Innovation and Excellence for Customer Satisfaction: customer satisfaction index reached 80.6% i th ti dE ll f C t S ti f ti t ti f ti i d h d 80 6% in the Abradee research, the highest since the survey was started  Development and Enhancement of Communities: investment of R$ 122 million in social projects, energy efficiency and legal access to electric power, benefiting about 1.7 million people Environment  Efficient Use of Energy Resources: R$ 44 million invested in 520 units - such as hospitals, schools and public buildings, generating efficiency and having their electricity consumption reduced by 38,846 MW Awards  National Quality Award - PNQ 2012, of Fundação Nacional da Qualidade – FNQ  ISE- Corporate Sustainability Index of BM&FBovespa - 2012/2013 - portfolio for the 8th consecutive year  Brazil's most admired company, for the fourth consecutive year, in the category "Electricity Supply" award . sponsored by the magazine Carta Capital  Child Award, Fundação Abrinq/ Save the Children, for attending to children up to 6 years in the Centro de Educação Infantil Luz e Lápis  Guia Exame de Sustentabilidade: AES Brasil group was recognized by Exame magazine as one out of recognized, magazine, twenty model companies in sustainability . 3
  • 4. Growth in consumption due to better performance at residential and commercial Consumption evolution (GWh)¹ +3.8% -3.2% 16,408 17,029 +1.7% +4.4% +2.0% 11,614 11,815 -3.6% 36,817 37,570 +1.0% 45,101 45,557 8,284 7,987 5,996 5,803 2,799 2,922 Residential Industrial Commercial Public Sector and Others 2011 1 – Own consumption not considered Captive Market Free Clientes Total Market 2012 4
  • 5. SAIDI below regulatory limits and in its lowest level since 2006 SAIDI¹ (last 12 months) SAIDI1 (LTM) -17% 10.09 11.86 2009 9.32 8.68 10.60 10.36 2010 2011 SAIDI Aneel Reference ► 8.67 8.49 9.87 8.35 2012 jan/13 8.23 jan/12 jan/13 8.23 SAIDI (hours) SAIDI (hours) ANEEL Reference for 2012 SAIDI: 8.49 hours 1 - System Average Interruption Duration Index Source: ANEEL and AES Eletropaulo 5
  • 6. SAIFI remains below regulatory limits SAIFI¹ (last 12 months) 7.87 7 87 7.39 SAIFI1 (LTM) 6.93 6.87 6.64 -15% 6.17 2009 5.46 5.45 2010 2011 SAIFI Aneel Reference ► 4.65 4.55 2012 jan/13 SAIFI (times) 5.37 jan/12 4.55 jan/13 SAIFI (times) ANEEL Reference for 2012 SAIDI: 6.64 times 1 - System Average Interruption Duration Index Source: ANEEL and AES Eletropaulo 6
  • 7. Losses level below the regulatory reference for the 3rd Cycle of Tariff Reset Losses (last 12 months) 11.8 11 8 10.9 Regulatory Reference² - Total Losses (last 12 months) 10.5 10.2 5.3 4.4 4.0 6.5 6.5 2010 2011 2012 9.8 9.4 2013/2014 2014/2015 6.1 2009 10.3 4.1 6.5 10.6 Technical Losses ¹ 2011/2012 2012/2013 Non Technical Losses 1 – In January 2012, the Company improved the assessment of the technical losses. As a consequence of this improvement, technical losses calculated are in a level of 6.1%. 2 – Values estimated by the Company to make them comparable with the reference for non-technical losses determined by the Aneel 7
  • 8. Investments focused on system expansion, maintenance and quality of client services Investments (R$ million) Investments (R$ million) 4Q12 800  739 R$ 252 million 831 35 R$ 831 million 216 63 647 22 2012 700  7 11 9 26 600  59 500  400  717 28 36 35 196 796 621 300  +21% 32 252 9 200  200 209 6 100  203 244 4Q11 4Q12 108 72 213 0  2011 2012 Own Resources 2013(e) Paid by the clients 1 Maintenance Client Service System Expansion Losses Recovery IT Paid by the Clients 1 – Maintenance capex is the investment s made for the grid modernizationand improvement in quality of service Others 8
  • 9. Gross revenues reflects expansion in residential and commercial and new tariff Gross Revenues (R$ million) +0.5% 15.240 15.314 5.405 5.354 3.838 3.885 23 72 1.373 13 3 1.308 1 308 23 72 2.453 2.556 9.813 2011 9.887 +1.2% 4T11 4T12 2012 Net revenue ex‐construction revenue Construction revenues Deduction to Gross Revenue 9
  • 10. Operating Costs and Expenses ¹ (R$ million) Higher average cost of energy purchased due to energy from auctions, exchange variation and adjustment of bilateral contract +21% 8,390 6,940 1,531 1,251 1 251 +27% 5,689 2011 6,858 1,827 358 1,469 2,321 398 1,923 2012 4Q11 4Q12 Energy Supply and Transmission Charges 1 - Depreciation and other operating income and expenses are not included PMS² and Other Expenses 2 - Personnel, Material and Services 10
  • 11. Manageable PMSO items below the inflation PMS and other expenses (R$ million) +4.9% 4 9% 38 106 1,251 1,251 2011 Non recurring 2011¹ 49 (25) 1,507 1,555 1,531 1,531 ADA Costs of reorganization and restructuring Non recurring 2012³ 2012 reported 54 28 30 1,357 1,357 1,423 1,423 1,423 2011: ex non recurring Collective bargaining Others² 2012: ex non recorring FCESP 1 - Non Recurring 2011: Reversal of tax and labor contingencies and changes in accounting criteria of ADA 2 - Other: Expenses of Action Plan 2011-2012, fleet maintenance, call center, offset by lower advertising expenses and consulting, among others. 3 - Non Recurring 2012: Reversal of civil and labor provisions in 2Q12 and IT expenses 11
  • 12. Ebitda reduction reflects tariff review, higher costs with p parcel A and extraordinary g y gains ( (AES Atimus SP in 2011) Ebitda (R$ million) (782) (707) (263) 2,848 (232) (159) 2,066 (49) 1,358 1 358 1,126 967 656 2011 Parcel A Non recurring 2011 and 2012 Market, Market review and adjustment in Parcel B PMSO¹ Others revenues and expenses 1 – PMSO variation, excluding costs with reorganization and restructuring and non-recurring costs related to the 3Q11 and 3Q12 Costs with reorganization and restructuring 2012 12
  • 13. Lower interest and fair value of assets related to concession impacted the financial results p Financial Result (R$ million) 2011 2012 (21) 4Q11 (22) 143% 4Q12 (2) - 93% (52) 13
  • 14. Net income variation reflects tariff review, Parcel A and sale of AES Atimus SP in 2011 Net Income (R$ million) 1.572 354 11 - 93% 108 Dividends 2012 (R$ milhões) 687 Net income - December 31, 2012 172 1.207 1 207 - 111% 699 647 18 137 (121) (132) (228) ( ) Realization of equity valuation adjustments Ajustment for dividend and Interest on equity prescribed Legal Reserve (5%) Distribution basis Dividends distributed Interest on equity distributed - 12/31/2012 Proposed complementary dividends (73) (470) 2011 2012 4Q11 Net Income ‐ Adjusted Regulatory assets and liabilities variation Regulatory assets and liabilities variation Tariff review postponement effect Estatutory reserve 107.9 89.9 89 9 5.1 (9.9) 193.1 54.3 0.5 138.2 4Q12 Expected date: Ex-dividends: 04/05/13; payment: until the end of 2013 14
  • 15. Lower cash generation due to tariff review and higher expenses with Parcel A Operational Cash Generation (R$ million) Final Cash Balance (R$ million) - 48% - 41% 2,416 1,218 1,390 814 2011 2012 2011 2012 15
  • 16. Net debt impacted by lower cash balance Net Debt (R$ billion) Avarage Cost 6.2x 4.9x 6.9 6.6 1.4x 0.9x 2.3 3.1 2011 2012 118.0% 110.2% 110 2% 2011 Net Debt (R$ billion) 12.1% 2012 Effective rate 11.3% Gross Debt/Ebitda Adjusted with Fcesp Net Debt/Ebitda Adjusted with Fcesp Average Time - years % of CDI 1 –Adjusted EBITDA with the expenses related CESP Foundation and regulatory assets and liabilities. 16
  • 17. Focus on efficiency Main initiatives  Change of corporate headquarters g Operational  Optimization of operational bases  Stores review by increasing of outsourcing  Organizational restructuring  30% growth in the productivity of operations teams of the regional north (being implemented for other regional)  Increase in the number of clients served by automatic channels  Renegotiation of supplies contracts f  Sale of real estate with an estimated value of $ 239 million, of which R$ 160 million was already Financial Fi i l sold  Covenants renegotiation and lengthening debt profile  Reducing manageable costs estimated at R$ 100 million from 2013 17
  • 18. 4Q12 Results The statements contained in this document with regard to the business prospects, projected operating and fi b i t j t d ti d financial results, i l lt and growth potential are merely forecasts based on the expectations of the Company’s Management in relation to its future performance. Such estimates are highly dependent on market behavior and on the conditions affecting Brazil’s macroeconomic performance as well as the electric sector and international market, and they are therefore subject to changes.