Location via proxy:   [ UP ]  
[Report a bug]   [Manage cookies]                
SlideShare a Scribd company logo
Latibex Forum
November, 2009
AES Brasil Group
                     7 million Clients
                                                  ... with a 2008 result:
Market Share     6 thousand AES People
                                                  R$ 3.2 billion (Ebitda)
                                                  R$ 1.7 billion (net income)
 Discos


     14.6%


   85.4%


 Gencos

    3.0%


   97.0%
                                              Investments 1998 - 2008:
                                              R$ 5 billion after privatization

    AES Brasil   Disco             Genco
                 Trading Company   Telecom
    Others

                                                                                 2
AES Tietê
Overview


                                                  •   30 year concession until 2029 and renewable for another 30
                                                      year

                                                  •   10 hydroelectric plants in the State of São Paulo at Tietê,
                                                      Pardo and Mogi Guaçu rivers

                                                  •   Installed capacity of 2,651 MW with assured energy of 1,275
                                                      MW

                                                  •   100% of assured energy contracted with AES Eletropaulo
                                                      until the end of 2015

                                                  •   8 Small Hydro Projects under analysis with total capacity of
                                                      133MW

                                                  •   2 Small Hydro Plants under construction totalizing 7 MW
   UHE Bariri             UHE Água Vermelha
   UHE Barra Bonita       UHE Caconde
   UHE Ibitinga           UHE Euclides da Cunha
   UHE Promissão          UHE Limoeiro
   UHE Nova Avanhandava   PCH Mogi-Guaçu


                                                                                                                    3
Financial Facts
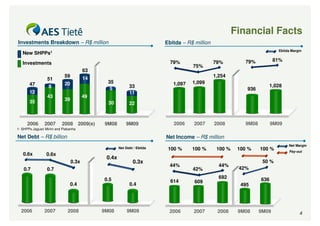
Investments Breakdown – R$ million                                       Ebitda – R$ million
                                                                                                                          Ebitda Margin
   New SHPPs1
                                                                           79%                 79%         79%           81%
   Investments
                                                                                    75%
                                        63
                            59                                                                 1,254
                  51                    14
       47                   20                 35                           1,097   1,099
                  8                                        33                                                        1,028
                                                5                                                           936
       12                                                  11
                  43                    49
       35                   39
                                               30          22


      2006      2007      2008 2009(e)       9M08        9M09               2006     2007      2008        9M08         9M09
1- SHPPs Jaguari Mirim and Piabanha

Net Debt – R$ billion                                                    Net Income – R$ million
                                                                                                                               Net Margin
                                                     Net Debt / Ebitda    100 %     100 %       100 %    100 %    100 %        Pay-out
   0.6x          0.6x
                                              0.4x
                                 0.3x                        0.3x                                                  50 %
                                                                           44%                   44%
    0.7           0.7                                                               42%                  42%

                                             0.5                                                 692              636
                                                                           614       609
                               0.4                         0.4                                            495


  2006          2007          2008           9M08         9M09            2006       2007       2008     9M08     9M09               4
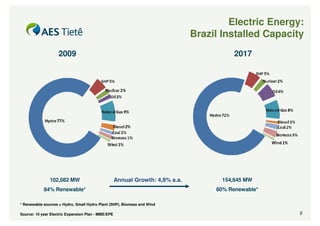
Electric Energy:
                                                                               Brazil Installed Capacity
                    2009                                                                 2017


               102,082 MW                           Annual Growth: 4,8% a.a.          154,645 MW
            84% Renewable*                                                          80% Renewable*

* Renewable sources = Hydro, Small Hydro Plant (SHP), Biomass and Wind

Source: 10 year Electric Expansion Plan - MME/EPE                                                      5
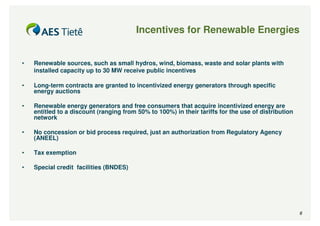
Incentives for Renewable Energies


•   Renewable sources, such as small hydros, wind, biomass, waste and solar plants with
    installed capacity up to 30 MW receive public incentives

•   Long-term contracts are granted to incentivized energy generators through specific
    energy auctions

•   Renewable energy generators and free consumers that acquire incentivized energy are
    entitled to a discount (ranging from 50% to 100%) in their tariffs for the use of distribution
    network

•   No concession or bid process required, just an authorization from Regulatory Agency
    (ANEEL)

•   Tax exemption

•   Special credit facilities (BNDES)


                                                                                                     6
Generation Potential
                                                                                Hydro
        Brazilian Hydroelectric Potential (MW)


        Amazonas                               835     77,058   28,256   106,149   42.2
        Paraná                               41,696    10,742    5,363    57,801   23.0
        Tocantins/ Araguaia                  12,198    11,297    4,540    28,035   11.2
        São Francisco                        10,290    5,550     1,917    17,757   7.1
        Atlântico Sudeste                     4,107    9,501     1,120    14,728   5.9
        Uruguai                               5,182    6,482     1,152    12,816   5.1
        Atlântico Sul                         1,637    1,734     2,066    5,437    2.2
        Atlântico Leste                       1,100    1,950     1,037    4,087    1.6
        Paraguai                               499      846      1,757    3,102    1.2
        Parnaíba                               225      819         0     1,044    0.4
        Atlântico NE Oc.                        0        58       318      376     0.1
        Atlântico NE Or.                        8       127        23      158     <0.1
        Total                                77,777   126,164   47,549   251,490
                                                                                   100.0
        %                                     30.9      50.2      18.9    100.0


Source: 10 year Electric Expansion Plan - MME/EPE                                          7
Generation Potential
                                                                                                  Bioelectricity

     Potential Bioelectricity Market for Export (MWavg)


                                                                                                                                13,158
                                                                                                                      12,158
                                                                                                            11,158
                                                                                                  10,158
                                                                                        9,158
                                    CAGR: 18%                                 8,158
                                                                    7,158
                                                          6,158
                                                5,158
                                      4,158
                            3,358
        1,800 2,087
      09


                10


                          11


                                    12


                                              13


                                                        14


                                                                  15


                                                                            16


                                                                                      17


                                                                                                18


                                                                                                          19


                                                                                                                    20


                                                                                                                              21
     20


               20


                          20


                                    20


                                              20


                                                        20


                                                                  20


                                                                            20


                                                                                      20


                                                                                                20


                                                                                                          20


                                                                                                                    20


                                                                                                                              20
   /


              /


                        /


                                  /


                                            /


                                                      /


                                                                /


                                                                          /


                                                                                    /


                                                                                              /


                                                                                                        /


                                                                                                                  /


                                                                                                                            /
08


           09


                     10


                               11


                                         12


                                                   13


                                                             14


                                                                       15


                                                                                 16


                                                                                           17


                                                                                                     18


                                                                                                               19


                                                                                                                         20
20


          20


                     20


                               20


                                         20


                                                   20


                                                             20


                                                                       20


                                                                                 20


                                                                                           20


                                                                                                     20


                                                                                                               20


                                                                                                                         20
     Source: Unica                                                                                                                       8
Generation Potential
                                                                          Wind

First Energy Auction from Wind Farms
                                                   TOTAL WIND POTENTIAL OF 143.5 GW
approved by the Regulatory Agency (ANEEL)

                                                          North 9%
• Auction scheduled for 14th of December of 2009          (12.8 GW)
                                                                                  Northeast 52%
• Energy supply through wind farms starting in
                                                                                       (75 GW)
July, 2012
• 20 years PPA                                              Center West 2%
• Ceiling bidding prices established in US$                     (3.1 GW)
93/MWh (Dutch Auction) (FX = R$ 2.02 /US$)
                                                                           Southeast 21%
• Estimated amount of energy to be                                             (29.7 GW)
                                                                      South
commercialized:13.3 GW (441 subscribed
                                                                      16%
projects)
                                                                  (22.8 GW)


                                                                              Source: ANEEL, Eletrobras   9
Generation Potential
                                                                                                                                 Small Hydro
                                                                   Installed Capacity (MW)

                                                                                                                                                                 5,356
                COD with environmental hazard
                COD with environmental restrictions
                COD without any restrictions
                                                                                                                                                       3,845
                In operation                                                                                                                   3,806
                                                                                                                                    3,677

                                                                                                                         3,240


                                                                                                          2,507


                                                                                           1,733


                                                                                1,090
                                                                   837
                                                      609
                                415       483
          92          147
  23


                                                                                                                                                                         2014...
                                                                                                                                 2010


                                                                                                                                            2011


                                                                                                                                                       2012


                                                                                                                                                               2013
   2000


                                                                                    2007


                                                                                                   2008


                                                                                                                  2009
            2001


                         2002


                                   2003


                                               2004


                                                            2005


                                                                         2006


Source: ANEEL
                                                                                                                                                                             10
The statements contained in this document with
regard to the business prospects, projected operating
and financial results, and growth potential are merely
forecasts based on the expectations of the
                                                         Contacts:
Company’s Management in relation to its future
performance. Such estimates are highly dependent         ri.aestiete@aes.com
on market behavior and on the conditions affecting
Brazil’s macroeconomic performance as well as the        + 55 11 2195 7048
electric sector and international market, and they are
therefore subject to changes.

More Related Content

Latibex – november, 2009

  • 2. AES Brasil Group 7 million Clients ... with a 2008 result: Market Share 6 thousand AES People R$ 3.2 billion (Ebitda) R$ 1.7 billion (net income) Discos 14.6% 85.4% Gencos 3.0% 97.0% Investments 1998 - 2008: R$ 5 billion after privatization AES Brasil Disco Genco Trading Company Telecom Others 2
  • 3. AES Tietê Overview • 30 year concession until 2029 and renewable for another 30 year • 10 hydroelectric plants in the State of São Paulo at Tietê, Pardo and Mogi Guaçu rivers • Installed capacity of 2,651 MW with assured energy of 1,275 MW • 100% of assured energy contracted with AES Eletropaulo until the end of 2015 • 8 Small Hydro Projects under analysis with total capacity of 133MW • 2 Small Hydro Plants under construction totalizing 7 MW UHE Bariri UHE Água Vermelha UHE Barra Bonita UHE Caconde UHE Ibitinga UHE Euclides da Cunha UHE Promissão UHE Limoeiro UHE Nova Avanhandava PCH Mogi-Guaçu 3
  • 4. Financial Facts Investments Breakdown – R$ million Ebitda – R$ million Ebitda Margin New SHPPs1 79% 79% 79% 81% Investments 75% 63 59 1,254 51 14 47 20 35 1,097 1,099 8 33 1,028 5 936 12 11 43 49 35 39 30 22 2006 2007 2008 2009(e) 9M08 9M09 2006 2007 2008 9M08 9M09 1- SHPPs Jaguari Mirim and Piabanha Net Debt – R$ billion Net Income – R$ million Net Margin Net Debt / Ebitda 100 % 100 % 100 % 100 % 100 % Pay-out 0.6x 0.6x 0.4x 0.3x 0.3x 50 % 44% 44% 0.7 0.7 42% 42% 0.5 692 636 614 609 0.4 0.4 495 2006 2007 2008 9M08 9M09 2006 2007 2008 9M08 9M09 4
  • 5. Electric Energy: Brazil Installed Capacity 2009 2017 102,082 MW Annual Growth: 4,8% a.a. 154,645 MW 84% Renewable* 80% Renewable* * Renewable sources = Hydro, Small Hydro Plant (SHP), Biomass and Wind Source: 10 year Electric Expansion Plan - MME/EPE 5
  • 6. Incentives for Renewable Energies • Renewable sources, such as small hydros, wind, biomass, waste and solar plants with installed capacity up to 30 MW receive public incentives • Long-term contracts are granted to incentivized energy generators through specific energy auctions • Renewable energy generators and free consumers that acquire incentivized energy are entitled to a discount (ranging from 50% to 100%) in their tariffs for the use of distribution network • No concession or bid process required, just an authorization from Regulatory Agency (ANEEL) • Tax exemption • Special credit facilities (BNDES) 6
  • 7. Generation Potential Hydro Brazilian Hydroelectric Potential (MW) Amazonas 835 77,058 28,256 106,149 42.2 Paraná 41,696 10,742 5,363 57,801 23.0 Tocantins/ Araguaia 12,198 11,297 4,540 28,035 11.2 São Francisco 10,290 5,550 1,917 17,757 7.1 Atlântico Sudeste 4,107 9,501 1,120 14,728 5.9 Uruguai 5,182 6,482 1,152 12,816 5.1 Atlântico Sul 1,637 1,734 2,066 5,437 2.2 Atlântico Leste 1,100 1,950 1,037 4,087 1.6 Paraguai 499 846 1,757 3,102 1.2 Parnaíba 225 819 0 1,044 0.4 Atlântico NE Oc. 0 58 318 376 0.1 Atlântico NE Or. 8 127 23 158 <0.1 Total 77,777 126,164 47,549 251,490 100.0 % 30.9 50.2 18.9 100.0 Source: 10 year Electric Expansion Plan - MME/EPE 7
  • 8. Generation Potential Bioelectricity Potential Bioelectricity Market for Export (MWavg) 13,158 12,158 11,158 10,158 9,158 CAGR: 18% 8,158 7,158 6,158 5,158 4,158 3,358 1,800 2,087 09 10 11 12 13 14 15 16 17 18 19 20 21 20 20 20 20 20 20 20 20 20 20 20 20 20 / / / / / / / / / / / / / 08 09 10 11 12 13 14 15 16 17 18 19 20 20 20 20 20 20 20 20 20 20 20 20 20 20 Source: Unica 8
  • 9. Generation Potential Wind First Energy Auction from Wind Farms TOTAL WIND POTENTIAL OF 143.5 GW approved by the Regulatory Agency (ANEEL) North 9% • Auction scheduled for 14th of December of 2009 (12.8 GW) Northeast 52% • Energy supply through wind farms starting in (75 GW) July, 2012 • 20 years PPA Center West 2% • Ceiling bidding prices established in US$ (3.1 GW) 93/MWh (Dutch Auction) (FX = R$ 2.02 /US$) Southeast 21% • Estimated amount of energy to be (29.7 GW) South commercialized:13.3 GW (441 subscribed 16% projects) (22.8 GW) Source: ANEEL, Eletrobras 9
  • 10. Generation Potential Small Hydro Installed Capacity (MW) 5,356 COD with environmental hazard COD with environmental restrictions COD without any restrictions 3,845 In operation 3,806 3,677 3,240 2,507 1,733 1,090 837 609 415 483 92 147 23 2014... 2010 2011 2012 2013 2000 2007 2008 2009 2001 2002 2003 2004 2005 2006 Source: ANEEL 10
  • 11. The statements contained in this document with regard to the business prospects, projected operating and financial results, and growth potential are merely forecasts based on the expectations of the Contacts: Company’s Management in relation to its future performance. Such estimates are highly dependent ri.aestiete@aes.com on market behavior and on the conditions affecting Brazil’s macroeconomic performance as well as the + 55 11 2195 7048 electric sector and international market, and they are therefore subject to changes.