


FTIR spectrophotometer
- 2. CONTENTS • Introduction • Theory of FTIR • Instrumentation of FTIR • Advantages • Disadvantages • Applications 21/31/2016
- 3. INTRODUCTION • Infrared spectrum is an important record which gives sufficient information about the functional groups of a compound. • The region from o.8 µ to 2.5µ is called Near IR, from 2.5µ to 15µ is called Mid IR or Ordinary IR and that from 15µ to 200µ is called Far IR. • FTIR stands for Fourier Transform Infra Red Spectrophotometer — the preferred method of infrared spectroscopy. • A method for measuring all of the infrared frequencies simultaneously, rather than individually as with dispersive instruments. 31/31/2016
- 4. FTIR spectroscopy is preferred over dispersive method of IR spectral analysis for several reasons: It is a non-destructive technique. It provides a precise measurement method which requires no external calibration. It can increase scan speed, collecting a scan every second. It is mechanically simple with only one moving part. 41/31/2016
- 5. Theory of FTIR Fourier Transform Infrared (FT-IR) spectrophotometry was developed in order to overcome the limitations encountered with dispersive instruments. The main difficulty was the slow scanning process. A method for measuring all of the infrared frequencies simultaneously, rather than individually, was needed. A solution was developed which employed a very simple optical device called an interferometer. The interferometer produces a unique type of signal which has all of the infrared frequencies “encoded” into it. 51/31/2016
- 6. Most interferometers employ a beam-splitter which takes the incoming infrared beam and divides it into two optical beams. One beam reflects off a flat mirror which is fixed in place. The other beam reflects off a flat mirror which is on a mechanism which allows this mirror to move a very short distance (typically a few millimeters) away from the beam- splitter. The two beams reflect off of their respective mirrors and are recombined when they meet back at the beam-splitter. Because the path that one beam travels is a fixed length and the other is constantly changing as its mirror moves, the signal which exits the interferometer is the result of these two beams “interfering” with each other. 6 1/31/2016
- 7. The resulting signal is called an interferogram which has the unique property that every data point (a function of the moving mirror position) which makes up the signal has information about every infrared frequency which comes from the source. Because the analyst requires a frequency spectrum (a plot of the intensity at each individual frequency) in order to make an identification, the measured interferogram signal can not be interpreted directly. Hence Fourier transformation is performed by the computer which then presents the user with the desired spectral information for analysis. 71/31/2016
- 8. Spectrometer components Three basic components of FT system are 1. Radiation source 2. Interferometer 3. Detector 81/31/2016
- 9. Radiation sources Incandecent lamp Nernst glower Globar source High pressure mercury arc 91/31/2016
- 10. Interferometer • The heart of the FTIR is a Michelson Interferometer. • The monochromator is replaced by an interferometer, which divides radiant beam, then recombines them in order to produce repetitive interference signals measured as a function of optical path difference as the name implies, the interferometer produces interference signals, which contain IR spectral information generated after passing through a sample. • Consists of three active components- • A moving mirror • A fixed mirror • A beam splitter 101/31/2016
- 11. 1 .Mirrors in an FTIR are generally made of metal. The mirrors are polished on the front surface and may be gold- coated to improve corrosion resistance. - commercial FTIRs use a variety of flat and curved mirrors to move light within the spectrometer, to focus the source onto the beam splitter, ant to focus light from the sample onto the detector. 2.The beam splitter can be constructed of a material such as Si or Ge deposited in a thin coating onto an IR- transparent substance. The germanium or silicon is coated onto the highly polished substrate by vapour deposition. 1/31/2016 11
- 12. 1/31/2016 12 - A common beam splitter material for the mid-IR region is germanium and the most common substrate for this region is KBr. Both the substrate and the coating must be optically flat. KBr is an excellent substrate for the mid-IR region.
- 13. Schematic diagram of Michelson Interferometer. 131/31/2016
- 14. Construction: The two mirrors are perpendicular to each other. The beam-splitter is a semi-reflecting device and is often made by depositing a thin film of Germanium onto a flat KBr substrate. Working: Radiation from the broadband IR source is collimated and directed into the interferometer, and impinges on the beam- splitter. • At the beam-splitter half of the IR beam is transmitted to the fixed mirror and the remaining half is reflected to the moving mirror. • After the divided beams are reflected from the two mirrors, they are recombined at the beam-splitter. • Due to changes in the relative position of the moving mirror, an interference pattern is generated. The resulting beam then passes through the sample and is eventually focused on the detector. 14 1/31/2016
- 15. Fixed mirror Moving mirror positions Michelson interferometer sampleTo detector IR Source Schematic diagram of FTIR spectrometer ZPD ¼ λ ¼ λ • NERNST GLOWER • GLOBAR SOURCE • HIGH PRESSURE MERCURY ARC LAMP • Dueterated triglycine sulphate (DTGS) • Mercury cadmium telluride (MCT) 151/31/2016
- 16. FTIR spectrophotometer FTIR spectrophotometer obtains an infrared spectra by collecting an interferogram of a sample signal using an interferometer and then performs a Fourier transform on the interferogram to obtain a spectrum. Fourier transform defines a relationship between signal in time domain and its representation in frequency domain. 161/31/2016
- 17. 1/31/2016 17
- 18. • The sampling rate is controlled by an internal, independent reference, a modulated monochromatic beam from a Helium-Neon Laser focused on a separate detector. Source interferometer sample detector interferogram (encoded data of sample at each frequency) decoding by FT IR Spectra 1/31/2016 18
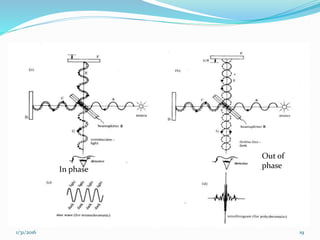
- 20. When the mirror is moved at a constant velocity, the intensity of radiation reaching the detector varies in a sinusoidal manner to produce the interferogram. The interferogram (which has every infrared frequency encoded into it) is the record of the interference signal. It is a time domain spectrum and records the detector response changes versus time within the mirror scan. If the sample happens to absorb at this frequency, the amplitude of the sinusoidal wave is reduced by an amount proportional to the amount of sample. The IR signal after interaction with the sample is uniquely characteristics of the sample. The beam finally arrives at the detector and is measurde by the detector. 1/31/2016 20
- 21. Cont... The detected interferogram can not be directly interpreted. It has to be decoded with a well-known mathematical technique in term of Fourier Transformation. 1/31/2016 21
- 22. Detectors in FTIR Two most popular detectors for FTIR spectrometer are 1. Pyroelectric Detector: Deuterated triglycine sulphate (DTGS). 2. Photon-sensitive semiconducting Detectors: Mercury cadmium teluride (MCT) 221/31/2016
- 23. Pyroelectric Detector Pyroelectric materials change their electric polarization as a function of temperature. These materials may be insulators, ferroelectric materials or semiconductors. A dielectric placed in an electrostatic field becomes polarized with the magnitude of the induced polarization depending on the dielectric constant. The induced polarization generally disappears when the field is removed. Pyroelectric materials, however, stay polarized and the polarization is temperature dependent. 1/31/2016 23
- 24. Cont... It consists of a thin single crystal of pyroelectric material placed between two electrodes. Upon exposure to IR radiation, the temperature and the polarization of the crystal changes. The change in the polarization is detected as a current in the circuit connecting the electrodes. The signal depends on the rate of change of polarization with temperature and the surface area of the crystal.These crystals are small: they vary in size from about 0.25 to 12.0 mm². Pyroelectric material used as an IR detector is Deuterated triglycine sulfate(DGTS), Lithium tantalite(LiTaO3) and Strontium barium niobate. 1/31/2016 24
- 25. Photon Detectors Here semiconductors are used. Semiconductors are materials that are insulators when no radiation falls on them but become conductors when radiation falls on them. Exposure to radiation causes very rapid change in their electrical resistance and therefore a very rapid response to the IR signal. The response time of a semiconductor detector is the time required to change the semiconductor from an insulator to a conductor. 1/31/2016 25
- 26. Cont... It consists of a thin film of suitable semiconductors like lead telluride or germanium which are non conducting at lower energy state. When the radiation falls on these, they are raised to higher level which can conduct and produce a signal which is proportional to amount of radiations. In this, there is drop of electrical resistance and if small voltage is applied there is large increase in current which can be applied and indicated on meter or recorder. Materials such as lead selenide(PbSe), indium gallium arsenide(InGaAs), indium antimonide(InSb) and Mercury cadmium telluride(HgCdTe, also called MCT) are intrinsic semiconductors commonly used. 1/31/2016 26
- 27. Advantages of FTIR FTIR instruments have distinct advantage over dispersive spectrometers. 1. Simpler mechanical design. 2. Elimination of Stray light and emission contributions. 3. Powerful data station. 4. Majority of molecules in the universe absorb mid-infrared light, making it a highly useful tool. 5. Universal technique. 6. Sensitive, fast and easy. 7. Relatively inexpensive and provides rich information. 8. Sensitive to “molecules”-anything that contains chemical bonds. 271/31/2016.
- 28. Disadvantages of FT-IR • Cannot detect atoms or monoatomic ions - single atomic entities contain no chemical bonds. • Cannot detect molecules comprised of two identical atoms symmetric-such as N2 or O2. • Aqueous solutions are very difficult to analyze - water is a strong IR absorber. • Complex mixtures - samples give rise to complex spectra. 281/31/2016
- 29. Applications 1. Identification of an organic compound. 2. Structure determination. 3. Study of chemical reaction. 4. Study of Keto-Enol tautomerism. 5. Study of complex molecules. 6. Detection of impurities in a compound. 7. Conformational analysis. 291/31/2016
- 30. Reference 1. Instrumental analysis. Skoog, Holler, Crouch. Pg No:488-493. 2. Fundamentals of Analytical chemistry. F James Holler, Stanley R. Crouch. Pg No:749-750. 3. Introduction to Instrumental Analysis. Robert D. Braun. Pg No:372-373. 4. Instrumental methods of Chemical Analysis. Gurudeep R. Chatwal, Sham K.Anand. Pg No:2.49-2.59. 5. Text book of Quantitative Chemical Analysis. Vogel’s et al.,Pg No:680-681. 301/31/2016
- 31. 6. Elementary organic spectroscopy. Y. R. Sharma. Pg No:137- 140. 7. Instrumental methods of Analysis. Willard, Merritt. Pg No:302-305. 1/31/2016 31
- 32. 321/31/2016