Correlation analysis
•Download as PPTX, PDF•
11 likes•17,624 views

This document discusses correlation analysis and how to perform it using SPSS software. Correlation analysis determines the relationship between two or more variables and the strength and direction of that relationship. It calculates a correlation coefficient between -1 and 1 to indicate the degree of association. The document explains how to calculate correlation by hand and how to use SPSS to select variables, choose a correlation coefficient type, run the analysis, and interpret the results, including identifying outliers. Correlation only indicates relationship, not causation.
Report
Share


Correlation analysis
- 1. Hochschule Bonn Rhein Sieg Submitted By : Divyanshu Singh Yalin Wang Submitted To : Prof. Dr. Dr. Franz Peren WS- 2011 MBA-NGO : Business Statistics
- 2. Suppose you have now your own NGO, and you find yourself asking a question like one of the following: A) Your NGO is still at the starting phase, you have different budget each year, and you want to expand the NGO size, have more staff, then you have a list of the recent years staff numbers and budget numbers, you wonder if there is any connection between. B) You ask two of your project officers to independently evaluate all the 5 projects in your NGO according to how good they perceive each project to be (by giving from low to high points) . Are the evaluations consistent between the two officers, or do they have different perceptions about which the better performing project is? If you have faced such questions and don't know exactly how to approach them, this presentation will provide you some help. The appropriate approach for these examples is correlation analysis, and we would like to introduce you the ABC of correlation analysis and how to use SPSS to perform all the necessary calculations.
- 3. Contents 1) What is Correlation Analysis? 2) How is it calculated? 3) What is the purpose of Correlation Analysis? 4) How are the results of Correlation Analysis interpreted? 5) How to perform Correlation Analysis using SPSS software? 6) How to interpret the results from SPSS?
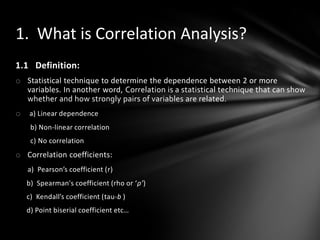
- 4. 1. What is Correlation Analysis? 1.1 Definition: o Statistical technique to determine the dependence between 2 or more variables. In another word, Correlation is a statistical technique that can show whether and how strongly pairs of variables are related. o a) Linear dependence b) Non-linear correlation c) No correlation o Correlation coefficients: a) Pearson’s coefficient (r) b) Spearman's coefficient (rho or ‘ρ’) c) Kendall’s coefficient (tau-b ) d) Point biserial coefficient etc…
- 5. 2. How is it calculated?
- 6. Correlation Co-efficient Example: To find the Correlation of Your NGO Number of staff Project Budget, 10K Year (X Values) (Y Values) 2008 2.1 18 2009 17 2.0 2010 22 1.5 2011 21 2.2 Step 1: Count the number of values or elements, suppose we want to evaluate the relationship between X and Y N=4
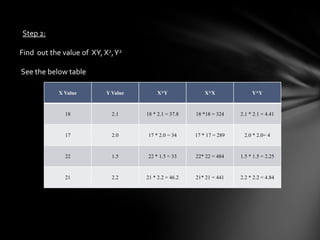
- 7. Step 2: Find out the value of XY, X2, Y2 See the below table X Value Y Value X*Y X*X Y*Y 18 2.1 18 * 2.1 = 37.8 18 *18 = 324 2.1 * 2.1 = 4.41 17 2.0 17 * 2.0 = 34 17 * 17 = 289 2.0 * 2.0= 4 22 1.5 22 * 1.5 = 33 22* 22 = 484 1.5 * 1.5 = 2.25 21 2.2 21 * 2.2 = 46.2 21* 21 = 441 2.2 * 2.2 = 4.84
- 8. Step 3: Find ΣX, ΣY, ΣXY, ΣX2, ΣY2. ΣX = 78 ΣY = 7.8 ΣXY = 151 ΣX2 = 1538 ΣY2 = 15.5
- 9. 3. How are the results of Correlation Analysis interpreted?
- 10. 3. Interpretation of results of Correlation Analysis o Correlation coefficient value ranges between +1 and -1 o Correlation Coefficient Values symbolized by ‘r’ : +1 and -1 Linear dependence r = 1 Perfect positive linear correlation r = -1 Perfect negative linear correlation 0 No correlation 0 < r < 1 positive linear correlation -1 < r < 0 negative linear correlation
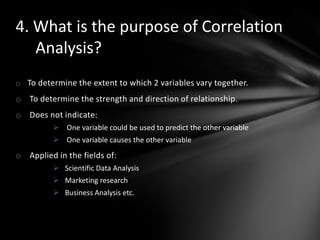
- 11. 4. What is the purpose of Correlation Analysis? o To determine the extent to which 2 variables vary together. o To determine the strength and direction of relationship. o Does not indicate: One variable could be used to predict the other variable One variable causes the other variable o Applied in the fields of: Scientific Data Analysis Marketing research Business Analysis etc.
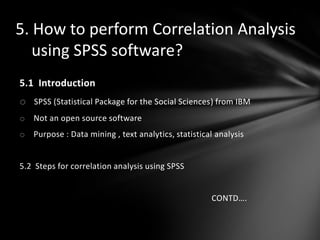
- 12. 5. How to perform Correlation Analysis using SPSS software? 5.1 Introduction o SPSS (Statistical Package for the Social Sciences) from IBM o Not an open source software o Purpose : Data mining , text analytics, statistical analysis 5.2 Steps for correlation analysis using SPSS CONTD….
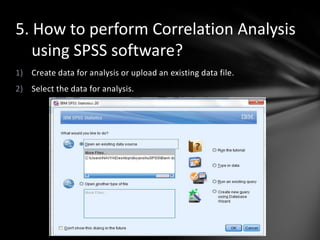
- 13. 5. How to perform Correlation Analysis using SPSS software? 1) Create data for analysis or upload an existing data file. 2) Select the data for analysis.
- 14. Using SPSS… 3) To visualize data and variables.
- 15. Using SPSS… 4) Correlate the data using Bivariate function.
- 16. Using SPSS… 5) Parameters for statistical analysis. Selection of Variables to correlate. Selection of type of Correlation Coefficient. Selection of type of Significance test.
- 17. 6.How to interpret the results from SPSS?
- 18. 6.How to interpret the results from SPSS? In this case the results look good but when they are not scatter plot can be used to reveal the outliers which could be avoided for further analysis. This is how we get the scatter plot of the data.
- 19. 6.How to interpret the results from SPSS? Split the data file using the Data->Split File->Compare groups->No.of working hours-> Ok More accurate view of association
- 20. Interpretation of Case Study Increase in the use of Technology and Efficient service by the bank increase simultaneously. Computerized techniques and ATMs made banking easier and faster. Automated procedures reduced errors caused manually. The same applies to other variables as well. But there is no causation between these variables.
- 21. References http://idlastro.gsfc.nasa.gov/idl_html_help/Correlation_Analysis.html http://www.statsoft.com/textbook/basic-statistics/ SPSS- Tutorial http://www.csulb.edu/~msaintg/ppa696/696stsig.htm http://academic.uofs.edu/department/psych/methods/cannon99/level2a. html http://mathworld.wolfram.com/CorrelationCoefficient.html http://www.cs.uu.nl/docs/vakken/wo2/SPSS/spss3.pdf http://easycalculation.com/statistics/learn-correlation.php
- 22. Thank You For Your Attention
Editor's Notes
- (a) is a perfect linear correlation with r = 1 and (d) has a positive linear correlation with 0 <r< 1. Example (b) is a perfect linear correlation with r = -1 and (e) has a negative linear correlation with -1 <r< 0. Example (c) is not correlated with r= 0 and (f) has a non-linear correlation which cause r to be close to zero.
- Linear correlation is measured by calculating the Pearson correlation coefficient. This coefficient is symbolized by r for a sample of data values and by the Greek letter ρ for a population. It is common practice to simply refer to this as the correlation coefficient.The correlation coefficient varies between -1.00 and +1.00. An r value of 1 indicates a perfect positive linear correlation. This happens when the values of both variables increase together and their coordinates on a scatter plot form a straight line. An r value of -1 indicates a perfect negative linear correlation. This happens when the values of one variable increases while the other variable decreases and their coordinates on a scatter plot form a straight line. Values of r that are not zero show decreasing significance as they approach zero. The scatter plot of variables with r values not equal to 1 or -1 do not form a straight line.An r value of zero indicates that there is no relationship between the two variables. Note that the correlation coefficient is only intended to detect linear relationships between variables that are normally distributed.
- Correlation analysis shows the extent to which two quantitative variables vary together, including the strength and direction of their relationship. The strength of the relationship refers to the extent to which one variable predicts the other. For example, in a study of consumers, you might find that the amount of money spent weekly on groceries varies directly with the size of the household; you'd expect it to be a strong positive relationship. However, you'd expect to find a weak correlation (or none at all) between amount spent weekly on groceries and scores on a customer satisfaction survey. The direction of the relationship shows whether the two variables vary together directly or inversely. In a direct relationship, the two variables increase together. In an inverse relationship, one variable tends to decrease as the other increases.Correlation analysis can be used to make inferences about one variable which cannot be easily measured based on which can be. For example, we cannot measure sales of a product which hasn't yet been produced or marketed. Correlation analysis of similar products may show us the variables which affect sales. The snack food industry might do a correlation analysis of sales of snack foods with salt content, discovering that the more salt in potato chips, the higher the sales. This might lead to a business decision to produce snack foods with increasing amounts of salt, with the goal of driving sales.
- The Bivariate Correlations procedure computes the pairwise associations for a set of variables and displays the results in a matrix. It is useful for determining the strength and direction of the association between two scale or ordinal variables.
- ->For quantitative, normally distributed variables, choosethe Pearson correlation coefficient. If your data are not normally distributed or have ordered categories, choose Kendall's tau-b or Spearman, which measure the associationbetween rank orders. ->To check if the result is not by chance. When your research hypothesis states the direction of the difference or relationship, then you use a one-tailed probability. While it is generally safest to use a two-tailed tests, there are situations where a one-tailed test seems more appropriate. ->Flag significant correlations. Correlation coefficients significant at the 0.05 level areidentified with a single asterisk, and those significant at the 0.01 level are identifiedwith two asterisks.
- -> Pearson's correlation coefficient (0.891) is significant at the 0.000 level which means that they are positively correlated.
- -> The plot shows that efficiency increases with automation and the number of working hours decreases due to less intake of human resources.