Location via proxy:   [ UP ]  
[Report a bug]   [Manage cookies]                
SlideShare a Scribd company logo
UNITED STATES
                                          SECURITIES AND EXCHANGE COMMISSION
                                                   Washington, D.C. 20549

                                                               Form 8-K

                                                        Current Report
                            Pursuant to Section 13 or 15(d) of the Securities Exchange Act of 1934

                                  Date of Report (Date of Earliest Event Reported): 2/14/2008

                                           CLEAR CHANNEL COMMUNICATIONS INC
                                         (Exact Name of Registrant as Specified in its Charter)

                                                Commission File Number: 001-09645

                    TX                                                                                       74-1787539
       (State or Other Jurisdiction of                                                                     (IRS Employer
      Incorporation or Organization)                                                                     Identification No.)

                                                             200 E. Basse
                                                       San Antonio, TX 78209
                                     (Address of Principal Executive Offices, Including Zip Code)

                                                              210-822-2828
                                          (Registrant’s Telephone Number, Including Area Code)

Check the appropriate box below if the Form 8-K filing is intended to simultaneously satisfy the filing obligation of the registrant
under any of the following provisions (see General Instruction A.2. below):

⃞ Written communications pursuant to Rule 425 under the Securities Act (17 CFR 230.425)

⃞ Soliciting material pursuant to Rule 14a-12 under the Exchange Act (17 CFR 240.14a-12)

⃞ Pre-commencement communications pursuant to Rule 14d-2(b) under the Exchange Act (17 CFR 240.14d-2(b))

⃞ Pre-commencement communications pursuant to Rule 13e-4(c) under the Exchange Act (17 CFR 240.13e-4(c))
Items to be Included in this Report

Item 2.02    RESULTS OF OPERATIONS AND FINANCIAL CONDITION.

      On February 14, 2008, Clear Channel Communications, Inc. issued a press release announcing its earnings for the quarter and
year ended December 31, 2007.

      The information contained in Exhibit 99.1 is incorporated herein by reference. The information in this Current Report is being
furnished and shall not be deemed quot;filedquot; for the purposes of Section 18 of the Securities Exchange Act of 1934, as amended, or
otherwise subject to the liabilities of that Section. The information in this Current Report shall not be incorporated by reference into
any registration statement or other document pursuant to the Securities Act of 1933, as amended.

Item 9.01    FINANCIAL STATEMENTS AND EXHIBITS.

        (d) Exhibits

        99.1 Press Release of Clear Channel Communications, Inc. issued February 14, 2008.

                                                               Signature(s)

      Pursuant to the Requirements of the Securities Exchange Act of 1934, the Registrant has duly caused this Report to be signed on
its behalf by the Undersigned hereunto duly authorized.

                                                                     CLEAR CHANNEL COMMUNICATIONS, INC.

Date:    February 14, 2008                                           By: /S/ HERBERT W. HILL, JR.
                                                                         Herbert W. Hill, Jr.
                                                                         Sr. Vice President/Chief Accounting Officer
INDEX TO EXHIBITS

99.1 Press Release of Clear Channel Communications, Inc. issued February 14, 2008.
Exhibit 99.1


                              Clear Channel Announces Fourth Quarter and Full Year 2007 Results

                                          Reports Record Diluted Earnings per Share of $1.89 for 2007
                                                        Reports Increase of 36% in 2007 Net Income
SAN ANTONIO--(BUSINESS WIRE)--Clear Channel Communications, Inc. (NYSE: CCU) today reported results for its fourth quarter and year ended December 31,
2007.

Fourth Quarter 2007 Results

The Company reported revenues of $1.84 billion in the fourth quarter of 2007, a 4% increase over the $1.77 billion reported for the fourth quarter of 2006. Included in the
Company’s revenue is a $46.9 million increase due to movements in foreign exchange; strictly excluding the effects of these movements in foreign exchange, revenue
growth would have been 1%. See reconciliation of revenue excluding effects of foreign exchange to revenue at the end of this press release.

Clear Channel’s expenses increased 7% to $1.2 billion during the fourth quarter of 2007 compared to 2006. Included in the Company’s 2007 expenses is a $36.0 million
increase due to movements in foreign exchange. During the fourth quarter of 2006, the Company recorded a reduction to expenses of $9.8 million as a result of a
favorable settlement of a legal proceeding. Strictly excluding the effects of movements in foreign exchange in the 2007 expenses and the $9.8 million reduction to
expenses in 2006, expense growth would have been 3%. See reconciliation of expense excluding effects of foreign exchange to expense and fourth quarter 2006 reduction
to operating expense due to legal settlement at the end of this press release. Also included in the Company’s 2007 expenses is approximately $11.5 million of non-cash
compensation expense.

Clear Channel’s income before discontinued operations increased 22% to $223.6 million, as compared to $183.9 million for the same period in 2006. The Company’s
diluted earnings before discontinued operations per share increased 22% to $0.45, compared to $0.37 for the same period in 2006.

The Company’s OIBDAN (defined as Operating Income before Depreciation & amortization, Non-cash compensation expense and Gain (loss) on disposition of assets –
net) was $615.7 million in the fourth quarter of 2007, a 2% increase from the fourth quarter of 2006. See reconciliation of OIBDAN to net income at the end of this press
release.

Full Year 2007 Results

For the full year, the Company reported revenues of $6.82 billion, an increase of 6% when compared to revenues of $6.46 billion for the same period in 2006. Included in
the Company’s revenue is a $139.6 million increase due to movements in foreign exchange. The Company’s expenses increased 6% to $4.4 billion during the year
compared to 2006. Included in the Company’s expenses is approximately $44.1 million of non-cash compensation expense and a $116.3 million increase due to
movements in foreign exchange.

The Company’s net income was $938.5 million or $1.89 per diluted share for 2007, the highest earnings per share in the Company’s history. This compares to $691.5
million or $1.38 per diluted share in 2006 or an increase of 37% on a diluted share basis. Income before discontinued operations was $772.1 million or $1.56 per diluted
share for 2007. This compares to income before discontinued operations of $620.0 million or $1.24 per diluted share in 2006 or an increase of 26% on a diluted share
basis. The Company’s full year 2006 net income included approximately $35.7 million of pre-tax gains, $0.04 per diluted share after-tax, primarily on the divestitures of
radio assets and the swap of certain outdoor assets. Excluding these gains, Clear Channel’s 2006 income before discontinued operations would have been $599.0 million
or $1.20 per diluted share. See reconciliation of net income and diluted earnings per share at the end of this press release.

The Company’s OIBDAN was $2.2 billion for 2007, a 6% increase from 2006. See reconciliation of OIBDAN to net income at the end of this press release.

Mark P. Mays, Chief Executive Officer of Clear Channel Communications, commented, “We delivered excellent results with record earnings per share in 2007. Full year
and fourth quarter growth in revenue and OIBDAN reflected continued strength throughout our Outdoor operations, which posted double-digit gains in revenue and
OIBDAN. Our Radio team continued its successful track record of out-performing our competitors in the radio industry. As we enter 2008, we remain optimistic across
all our businesses. We have seen improving trends in the current year in our radio division and would expect that to continue through the end of the year. In Outdoor, we
exceeded our forecast for the roll-out of digital boards last year and are on course to accelerate the roll-out this year. Results like these don’t occur without a great team at
the helm. We are proud of their performance in 2007 and are confident in their leadership as we capitalize on the many opportunities presented in 2008.”

Merger Transaction

The Company’s shareholders approved the adoption of the merger agreement, as amended, in which Clear Channel would be acquired by CC Media Holdings, Inc., a
corporation formed by private equity funds co-sponsored by Thomas H. Lee Partners, L.P. and Bain Capital Partners, LLC (“the Sponsors”) on September 25, 2007.

Under the terms of the merger agreement, as amended, the Company’s shareholders will receive $39.20 in cash for each share they own plus additional per share
consideration, if any, as the closing of the merger will occur after December 31, 2007. For a description of the computation of any additional per share consideration and
the circumstances under which it is payable, please refer to the joint proxy statement/prospectus dated August 21, 2007, filed with the Securities & Exchange
Commission (the quot;Proxy Statementquot;). As an alternative to receiving the $39.20 per share cash consideration, the Company's unaffiliated shareholders were offered the
opportunity on a purely voluntary basis to exchange some or all of their shares of Clear Channel common stock on a one-for-one basis for shares of Class A common
stock in CC Media Holdings, Inc. (subject to aggregate and individual caps), plus the additional per share consideration, if any.

Holders of shares of the Company’s common stock (including shares issuable upon conversion of outstanding options) in excess of the aggregate cap provided in the
merger agreement, as amended, elected to receive the stock consideration. As a result, unaffiliated shareholders of the Company will own an aggregate of 30,612,245
shares of CC Media Holdings, Inc. Class A common stock upon consummation of the merger.
In connection with the proposed acquisition, the Company agreed with the United States Department of Justice to enter into a Final Judgment and Hold Separate
Agreement in accordance with and subject to the Tunney Act. The applicable waiting period under the Hart-Scott-Rodino Antitrust Improvements Act of 1976 expired at
11:59 PM EST on Wednesday, February 13, 2008. There are no remaining regulatory approvals needed to close the transaction. The Company anticipates closing on or
before March 31, 2008.

Television and Radio Divestitures

Television

On April 20, 2007, the Company entered into a definitive agreement with an affiliate (“buyer”) of Providence Equity Partners Inc. (“Providence”) to sell its Television
Group. On November 29, 2007, the FCC issued its initial consent order approving the assignment of our television station licenses to the buyer. A representative of
Providence has informed us that the buyer is considering its options under the definitive agreement, including not closing the acquisition on the terms and conditions in
the definitive agreement. The definitive agreement is in full force and effect, has not been terminated and contains customary closing conditions. There have been no
allegations that we have breached any of the terms or conditions of the definitive agreement or that there is a failure of a condition to closing the acquisition.

The sale of the television division is not contingent on the closing of the merger described above. Further, the sale of the division is not a condition to the closing of the
merger described above. The results of the Television Group are reported as assets and liabilities from discontinued operations in the consolidated balance sheet and as
discontinued operations in the consolidated statements of operations.

Radio

On November 16, 2006, the Company announced plans to sell 448 non-core radio stations. The sale of these assets is not contingent on the closing of the merger
described above. The Company sold 160 non-core radio stations and had definitive asset purchase agreements for 73 non-core radio stations at December 31, 2007. These
stations were classified as assets from discontinued operations in the Company’s consolidated balance sheet and as discontinued operations in the consolidated financial
statements as of and for the periods ended December 31, 2007. Through February 13, 2008, the Company had completed the sales of 57 non-core radio stations that were
under definitive agreement at December 31, 2007.

The Company has 187 non-core radio stations that are no longer under a definitive asset purchase agreement. The definitive asset purchase agreement was terminated in
the fourth quarter of 2007. However, the Company continues to actively market these radio stations and they continue to meet the criteria in Statement of Financial
Accounting Standards No. 144, Accounting for the Impairment or Disposal of Long-lived Assets, for classification as discontinued operations. Therefore, the assets,
results of operations and cash flows from these stations remain classified as discontinued operations in the Company’s consolidated financial statements as of and for the
periods ended December 31, 2007.

Through February 13, 2008, the Company had definitive asset purchase agreements for the sale of 12 additional non-core radio stations, all of which were part of the 187
stations mentioned above. The closing of these sales is subject to antitrust clearances, FCC approval and other customary closing conditions. Further, the closing of these
sales is not a condition to the closing of the merger described above.


Total non-core radio stations on November 16, 2006                                                                                                                          448
Non-core radio stations sold through December 31, 2007                                                                                                                     (160)
Non-core radio stations under definitive asset purchase agreements at December 31, 2007                                                                                     (73)
Non-core radio stations not under definitive asset purchase agreements but recorded as discontinued operations at December 31, 2007                                        (187)
Non-core radio stations included in continuing operations at December 31, 2007                                                                                               28


The Company plans to utilize its capital loss carry forward to offset the related capital gain on the transactions. A portion of the gain will be considered ordinary gain, not
capital gain, due to depreciation and amortization recapture, and will be taxed as ordinary income.

There can be no assurance that any of the divestitures contemplated in this release will actually be consummated. Furthermore, there can be no assurance that the
Company will be able to utilize tax loss carry forwards to offset capital gains as contemplated in this release.

Revenue, Direct Operating and SG&A Expenses, and OIBDAN by Division


(In thousands)                                          Three Months Ended                          %                             Year Ended                              %
                                                           December 31,                           Change                         December 31,                           Change
                                                     2007                 2006                                           2007                     2006
Revenue
 Radio Broadcasting                                    $ 874,580                 $ 899,735          (3%)                 $ 3,439,247              $ 3,438,141            0%
 Outdoor Advertising                                     936,726                   830,695          13%                    3,281,836                2,897,721           13%
 Other                                                    57,437                    72,529         (21%)                     222,698                  242,846           (8%)
 Eliminations                                            (31,849)                  (32,136)                                 (126,872)                (121,273)
Consolidated revenue                                 $ 1,836,894               $ 1,770,823            4%                 $ 6,816,909              $ 6,457,435            6%


The Company’s 2007 revenue increased from foreign exchange movements of approximately $46.9 million for the fourth quarter and $139.6 million for the full year as
compared to the same period of 2006.


Direct Operating and SG&A Expenses by Division
 Radio Broadcasting                                                             $ 550,492             $ 545,189                   $ 2,091,860            $ 2,093,718
 Less: Non-cash compensation expense                                               (5,475)               (6,309)                      (22,226)               (25,237)
                                                                                  545,017               538,880       1%            2,069,634              2,068,481       0%
Outdoor Advertising                                                             621,701               546,390                     2,272,839             2,001,836
 Less: Non-cash compensation expense                                              (3,014)               (1,457)                       (9,633)               (6,011)
                                                                                 618,687               544,933      14%            2,263,206             1,995,825      13%

 Other                                                                            48,717                51,840                       187,729               193,813
 Less: Non-cash compensation expense                                                  —                   (414)                           —                 (1,656)
                                                                                  48,717                51,426       (5)%            187,729               192,157       (2)%

 Eliminations                                                                     (31,849)              (32,136)                     (126,872)            (121,273)

 Plus: Non-cash compensation expense                                                8,489                 8,180                        31,859               32,904
Consolidated divisional operating expenses                                    $ 1,189,061           $ 1,111,283      7%           $ 4,425,556          $ 4,168,094        6%


The Company’s 2007 direct operating and SG&A expenses increased from foreign exchange movements of approximately $36.0 million for the fourth quarter and $116.3
million for the full year as compared to the same period of 2006.


OIBDAN
 Radio Broadcasting                                              $ 329,563             $ 360,855       (9)%                 $ 1,369,613               $ 1,369,660        0%
 Outdoor Advertising                                               318,039               285,762       11%                    1,018,630                   901,896       13%
 Other                                                               8,720                21,103      (59)%                      34,969                    50,689      (31)%
 Corporate and Merger costs                                        (40,619)              (65,588)                              (176,074)                 (194,826)
Consolidated OIBDAN                                              $ 615,703             $ 602,132         2%                 $ 2,247,138               $ 2,127,419        6%


See reconciliation of OIBDAN to net income at the end of this press release.

Radio Broadcasting

The Company’s radio revenue increased $1.1 million during 2007 as compared to 2006. Increases in network, traffic, syndicated radio and on-line revenues were partially
offset by declines in local and national revenues. Local and national revenues were down partially as a result of overall weakness in advertising as well as declines in
automotive, retail and political advertising categories. During 2007, the Company’s average minute rate declined compared to 2006 for the same period.

The radio broadcasting operating expenses declined slightly in 2007 compared to 2006. The decline was primarily from a $14.8 million decline in programming expenses
partially related to salaries, a $16.5 million decline in non-traditional expenses primarily related to fewer concert events sponsored by the Company in the current year,
and a decline of $9.5 million in bonus and commission expenses. Partially offsetting these declines were increases of $16.2 million in the Company’s marketing and
promotions department. Also the Company had an increase of $5.7 million in traffic expenses and $19.1 million in internet expenses associated with the increased
revenues in these businesses.

Outdoor Advertising

The Company’s outdoor advertising revenue increased 13% to $3.3 billion during the year when compared to revenues of $2.9 billion for the same period in 2006.
Included in the 2007 results is an approximate $139.6 million increase related to foreign exchange when compared to 2006.

Outdoor advertising expenses increased 14% to $2.3 billion during the year when compared to 2006. Included in the Company’s expenses is approximately $9.6 million
of non-cash compensation expense and $116.3 million increase related to foreign exchange compared to 2006.

         Americas Outdoor

The Company’s Americas revenue increased $143.7 million, or 11%, during 2007 as compared to 2006 with Interspace contributing approximately $32.1 million to the
increase. The growth occurred across the Company’s inventory, including bulletins, street furniture, airports and taxi displays. The revenue growth was primarily driven
by bulletin revenue which was driven by increased rates and airport revenue which had both increased rates and occupancy. Leading advertising categories during the
year were telecommunications, retail, automotive, financial services and amusements. Revenue growth occurred across many of the Company’s markets, led by Los
Angeles, New York, Washington/Baltimore, Atlanta, Boston, Seattle, and Minneapolis.

Direct operating and SG&A expenses increased $75.3 million in 2007 as compared to 2006 primarily from an increase in site lease expenses of $46.6 million associated
with new contracts and the increase in airport, street furniture and taxi revenues. Interspace contributed $21.6 million to the increase with the rest of the increase primarily
attributable to bonus and commission expenses associated with the increase in revenues.

         International Outdoor

The Company’s International revenue increased $240.4 million, or 15%, in 2007 as compared to 2006. Included in the increase was approximately $133.3 million related
to movements in foreign exchange. Revenue growth occurred across inventory categories including billboards, street furniture and transit, driven by both increased rates
and occupancy. Growth was led by increased revenues in France, Italy, Australia, Spain, Denmark, Turkey and China.

The Company’s international direct operating and SG&A expenses increased approximately $195.7 million in 2007 compared to 2006. Included in the increase was
approximately $111.4 million related to movements in foreign exchange. The remaining increase was primarily attributable to an increase in site lease and selling
expenses associated with the increase in revenue. During the fourth quarter of 2006, the Company recorded a $9.8 million reduction to expenses as a result of the
favorable settlement of a legal proceeding.
FAS No. 123 (R): Share-Based Payment (“FAS 123(R)”)

The following table details non-cash compensation expense, which represents employee compensation costs related to stock option grants and restricted stock awards, for
the fourth quarter and full year of 2007 and 2006:


(In millions)                                                                                     Three Months Ended                                 Year Ended
                                                                                                     December 31,                                   December 31,
                                                                                           2007                          2006                  2007                 2006
Direct operating expense                                                                              $ 4.6                      $ 4.0             $ 17.0               $ 16.1
SG&A                                                                                                    3.9                        4.2               14.9                 16.8
Corporate                                                                                               3.0                        1.1               12.2                  9.1
Total non-cash compensation                                                                          $ 11.5                      $ 9.3             $ 44.1               $ 42.0


The Company will not be holding a Conference Call or Webcast

As a result of the Clear Channel Communications, Inc. pending merger transaction that was approved by Clear Channel Communications, Inc. shareholders on September
25, 2007, the Company will not be hosting a teleconference or webcast to discuss results.

First Quarter and 2008 Outlook

Due to the proposed merger transaction and the Company not hosting a teleconference to discuss financial and operating results, the Company is providing the following
information regarding its expectations and current information related to 2008 operating results.

Pacing information presented below reflects revenues booked at a specific date versus the comparable date in the prior period and may or may not reflect the actual
revenue growth at the end of the period. The Company’s revenue pacing information includes an adjustment to prior periods to include all acquisitions and exclude all
divestitures in both periods presented for comparative purposes. All pacing metrics exclude the effects of foreign exchange movements. The Company’s operating
expense forecasts are on a reportable basis excluding non-cash compensation expense, i.e. there is not an adjustment for acquisitions, divestitures or the effects of foreign
exchange movements.

As of February 8, 2008, revenues for the consolidated Company are pacing up 0.2% for the first quarter of 2008 as compared to the first quarter of 2007, and are pacing
up 1.4% for the full year of 2008 as compared to the full year of 2007. As of the first week of February, the Company has historically experienced revenues booked of
approximately 85% of the actual revenues recorded for the first quarter and approximately 40% of the actual revenues recorded for the full year.

As of February 8, 2008, revenues for the Radio division are pacing down 4.0% for the first quarter of 2008 as compared to the first quarter of 2007, and are pacing down
0.9% for the full year of 2008 as compared to the full year of 2007. As of the first week of February, the Radio division has historically experienced revenues booked of
approximately 85% of the actual revenues recorded for the first quarter and approximately 40% of the actual revenues recorded for the full year. The Company’s Radio
division currently forecasts total operating expense growth to be in a range of down low single-digits to up low single-digits for the full year 2008 as compared to the full
year 2007.

Also as of February 8, 2008, revenues in the Outdoor division are pacing up 4.5% with both the Americas and International pacing relatively in-line with the 4.5% pacing
for the first quarter 2008 as compared to the first quarter of 2007. For the full year 2008 versus the full year 2007, the Outdoor division revenues are pacing up 3.7% with
the Americas slightly below and International slightly above the full-year pacing of 3.7%. As of the first week of February, the Outdoor division has historically
experienced revenues booked of approximately 85% of the actual revenues recorded for the first quarter and approximately 45% of the actual revenues recorded for the
full year. Excluding the effects of movements in foreign exchange, the Company’s Outdoor division currently forecasts total operating expense growth to be in a range of
low single-digit to mid-single digit growth for the full year 2008 as compared to the full year 2007.

For the consolidated company, current management forecasts show corporate expenses of $180 to $190 million for the full year 2008. This projection does not include
any ongoing management fees that may be paid to the Sponsors. Non-cash compensation expense (i.e. FAS No. 123 (R): share-based payments) are currently projected to
be in the range of $40 million to $50 million for the full year of 2008. These projections do not consider any expense associated with the pending merger transaction.

The Company currently forecasts overall capital expenditures for 2008 of $375 to $400 million, excluding any capital expenditures associated with any new contract wins
the Company may have during 2008. Increases over the 2007 level would be primarily due to new contract wins in France and China during 2007 and the acceleration of
the roll-out of digital boards.

Income tax expense as a percent of ‘Income before income taxes and minority interest’ is currently projected to be approximately 38%. Current income tax expense as a
percent of ‘Income before income taxes and minority interest’ is currently expected to be 23% to 26%. This percentage does not include any tax expense or benefit
related to the pending merger transaction, the announced divestitures of the Company’s television stations and certain of its radio stations or other capital gain
transactions, or the effects of any resolution of governmental examinations.

TABLE 1 - Financial Highlights of Clear Channel Communications, Inc. and Subsidiaries - Unaudited


(In thousands, except                                                                        Three Months Ended                          Twelve Months Ended
per share data)                                                                                 December 31,                %                December 31,               %
                                                                                             2007          2006           Change          2007         2006           Change

Revenue                                                                                   $ 1,836,894     $ 1,770,823       4%       $ 6,816,909      $ 6,457,435       6%
Direct operating expenses                                                                     732,620         678,204                  2,707,254        2,506,717
Selling, general and administrative expenses                                                  456,441         433,079                  1,718,302        1,661,377
Corporate expenses                                                                             43,271          59,087                    181,504          196,319
Merger costs                                                                                 390           7,633                       6,762           7,633
Depreciation and amortization                                                            145,978         158,181                     564,920         593,770
Gain (loss) on disposition of assets – net                                                 3,917          13,337                      14,389          71,718
Operating Income                                                                         462,111         447,976       3%          1,652,556       1,563,337        6%

Interest expense                                                                         104,345         118,113                     451,870         484,063
Gain (loss) on marketable securities                                                       6,081             234                       6,742           2,306
Equity in earnings of nonconsolidated affiliates                                          11,345          12,540                      35,176          37,845
Other income (expense) – net                                                               6,401          (2,735)                      5,326          (8,593)
Income before income taxes, minority interest and discontinued operations                381,593         339,902                   1,247,930       1,110,832
Income tax benefit (expense):
 Current                                                                                  (83,545)      (107,078)                   (245,155)       (270,111)
 Deferred                                                                                 (54,674)       (33,611)                   (183,598)       (188,789)
Income tax benefit (expense)                                                             (138,219)      (140,689)                   (428,753)       (458,900)
Minority interest income (expense), net of tax                                            (19,824)       (15,296)                    (47,031)        (31,927)
Income before discontinued operations                                                     223,550        183,917                     772,146         620,005
Income from discontinued operations                                                        97,009         27,427                     166,361          71,512

Net income                                                                              $ 320,559      $ 211,344                   $ 938,507       $ 691,517

Diluted earnings per share:

Diluted earnings before discontinued operations per share                                    $ .45          $ .37      22%            $ 1.56          $ 1.24       26%

Diluted earnings per share                                                                   $ .65          $ .43      51%            $ 1.89          $ 1.38       37%

Weighted average shares outstanding – Diluted                                            496,389         492,479                    495,784          501,639


TABLE 2 - Selected Balance Sheet Information - Unaudited

Selected balance sheet information for 2007 and 2006 was:


(In millions)                                                                                               December 31, 2007                   December 31, 2006

Cash                                                                                                                            $ 145.1                            $ 116.0
Total Current Assets                                                                                                          $ 2,294.6                          $ 2,205.7
Net Property, Plant and Equipment                                                                                             $ 3,003.2                          $ 2,960.5
Total Assets                                                                                                                 $ 18,805.5                         $ 18,886.9
Current Liabilities (excluding current portion of long-term debt)                                                             $ 1,453.1                          $ 1,327.5
Long-Term Debt (including current portion of long-term debt)                                                                  $ 6,575.2                          $ 7,663.0
Shareholders’ Equity                                                                                                          $ 8,797.5                          $ 8,042.3


TABLE 3 - Capital Expenditures - Unaudited

Capital expenditures for the full year of 2007 and 2006 were:


(In millions)                                                                      December 31, 2007                                  December 31, 2006

Non-revenue producing                                                                                        $ 167.7                                              $ 178.5
Revenue producing                                                                                              194.3                                                153.9
  Total capital expenditures                                                                                 $ 362.0                                              $ 332.4


The Company defines non-revenue producing capital expenditures as those expenditures that are required on a recurring basis. Revenue producing capital expenditures
are discretionary capital investments for new revenue streams, similar to an acquisition.

TABLE 4 - Total Debt - Unaudited

At December 31, 2007, Clear Channel had total debt of:


(In millions)                                                                                                          December 31, 2007

Bank Credit Facilities                                                                                                                                             $ 174.6
Public Notes                                                                                                                                                       6,294.5
Other Debt                                                                                                                                                           106.1
  Total                                                                                                                                                          $ 6,575.2
Liquidity and Financial Position

For the year ended December 31, 2007, cash flow from operating activities was $1.55 billion, cash flow used by investing activities was $481.4 million, cash flow used
by financing activities was $1.43 billion, and net cash provided by discontinued operations was $392.3 million for a net increase in cash of $29.1 million.


Leverage, defined as debt*, net of cash, divided by the trailing 12-month pro forma EBITDA**, was 3.0x at December 31, 2007. The Company reduced long-term debt
(including current portion of long-term debt) by approximately $1.1 billion in 2007.

As of December 31, 2007, 80% of the Company’s debt bears interest at fixed rates while 20% of the Company’s debt bears interest at floating rates based upon LIBOR.
The Company’s weighted average cost of debt at December 31, 2007 was 6.0%.

As of February 14, 2008, the Company had approximately $997.8 million available on its bank credit facility. The Company may utilize existing capacity under its bank
facility and other available funds for general working capital purposes including funding capital expenditures, acquisitions, stock repurchases and the refinancing of
certain public debt securities. Capacity under the facility can also be used to support commercial paper programs. Redemptions or repurchases of securities will occur
through open market purchases, privately negotiated transactions, or other means.

* As  defined by Clear Channel’s credit facility, debt is long-term debt of $6.58 billion plus letters of credit of $180.7 million; guarantees of third party debt of $0; net
original issue discount/premium of $15.1 million; deferred purchase consideration of $48.1 million included in other long-term liabilities; plus the fair value of interest
rate swaps of $11.4 million; and less purchase accounting premiums of $3.2 million.

** As defined by Clear Channel’s credit facility, pro forma EBITDA is the trailing twelve-month EBITDA adjusted to include EBITDA of any assets acquired in the
trailing twelve-month period.

                                                 Supplemental Disclosure Regarding Non-GAAP Financial Information

Operating Income before Depreciation and Amortization (D&A), Non-cash Compensation Expense and Gain (Loss) on Disposition of Assets – Net (OIBDAN)

The following tables set forth Clear Channel's OIBDAN for the three months and years ended December 31, 2007 and 2006. The Company defines OIBDAN as net
income adjusted to exclude non-cash compensation expense and the following line items presented in its Statement of Operations: Discontinued operations; Minority
interest, net of tax; Income tax benefit (expense); Other income (expense) - net; Equity in earnings of nonconsolidated affiliates; Gain (loss) on marketable securities;
Interest expense; Gain (loss) on disposition of assets - net; and, D&A.

The Company uses OIBDAN, among other things, to evaluate the Company's operating performance. This measure is among the primary measures used by management
for planning and forecasting of future periods, as well as for measuring performance for compensation of executives and other members of management. This measure is
an important indicator of the Company's operational strength and performance of its business because it provides a link between profitability and cash flows from
operating activities. It is also a primary measure used by management in evaluating companies as potential acquisition targets.

The Company believes the presentation of this measure is relevant and useful for investors because it allows investors to view performance in a manner similar to the
method used by the Company's management. It helps improve investors’ ability to understand the Company's operating performance and makes it easier to compare the
Company's results with other companies that have different capital structures, stock option structures or tax rates. In addition, this measure is also among the primary
measures used externally by the Company's investors, analysts and peers in its industry for purposes of valuation and comparing the operating performance of the
Company to other companies in its industry. Additionally, the Company’s bank credit facilities use this measure for compliance with leverage covenants.

Since OIBDAN is not a measure calculated in accordance with GAAP, it should not be considered in isolation of, or as a substitute for, net income as an indicator of
operating performance and may not be comparable to similarly titled measures employed by other companies. OIBDAN is not necessarily a measure of the Company's
ability to fund its cash needs. As it excludes certain financial information compared with operating income and net income (loss), the most directly comparable GAAP
financial measures, users of this financial information should consider the types of events and transactions, which are excluded.

In addition, because a significant portion of the Company’s advertising operations are conducted in foreign markets, principally France and the United Kingdom,
management reviews the operating results from its foreign operations on a constant dollar basis. A constant dollar basis (i.e. a foreign currency adjustment is made to the
2007 actual foreign revenues and expenses at average 2006 foreign exchange rates) allows for comparison of operations independent of foreign exchange movements.

As required by the SEC, the Company provides reconciliations below to the most directly comparable amounts reported under GAAP, including (i) OIBDAN for each
segment to consolidated operating income; (ii) Revenue excluding foreign exchange effects to revenue; (iii) Expense excluding foreign exchange effects and fourth
quarter 2006 reduction to operating expense due to legal settlement to expenses; (iv) OIBDAN to net income; and (v) Net income and diluted earnings per share
excluding certain items discussed earlier.

(In thousands)                                                                                           Depreciation
                                               Operating income          Non-cash compensation               and           Gain (loss)on disposition of assets -
                                                    (loss)                      expense                  amortization                      net                      OIBDAN

Three Months Ended December 31,
2007
Radio Broadcasting                                      $ 299,688                             $ 5,475           $ 24,400                                 $—         $ 329,563
Outdoor                                                   209,158                               3,014            105,867                                   —          318,039
Other                                                      (2,932)                                 —              11,652                                   —            8,720
Gain (loss) on disposition of assets – net                  3,917                                  —                  —                                (3,917)             —
Corporate and Merger costs                                (47,720)                              3,042              4,059                                              (40,619)
 Consolidated                                           $ 462,111                            $ 11,531          $ 145,978                             $ (3,917)      $ 615,703
Three Months Ended December 31,
2006
Radio Broadcasting                                   $ 324,232                              $ 6,309        $ 30,314                                 $—        $ 360,855
Outdoor                                                175,845                                1,457         108,460                                   —         285,762
Other                                                    5,959                                  414          14,730                                   —          21,103
Gain (loss) on disposition of assets – net              13,337                                   —               —                               (13,337)            —
Corporate and Merger costs                             (71,397)                               1,132           4,677                                   —         (65,588)
 Consolidated                                        $ 447,976                              $ 9,312       $ 158,181                            $ (13,337)     $ 602,132

Year Ended December 31, 2007
Radio Broadcasting                                 $ 1,242,015                             $ 22,226       $ 105,372                                 $—       $ 1,369,613
Outdoor                                                609,514                                9,633         399,483                                   —        1,018,630
Other                                                   (8,854)                                  —           43,823                                   —           34,969
Gain (loss) on disposition of assets – net              14,389                                   —               —                               (14,389)             —
Corporate and Merger costs                            (204,508)                              12,192          16,242                                   —         (176,074)
 Consolidated                                      $ 1,652,556                             $ 44,051       $ 564,920                            $ (14,389)    $ 2,247,138

Year Ended December 31, 2006
Radio Broadcasting                                 $ 1,225,706                             $ 25,237       $ 118,717                                 $—       $ 1,369,660
Outdoor                                                488,155                                6,011         407,730                                   —          901,896
Other                                                      871                                1,656          48,162                                   —           50,689
Gain (loss) on disposition of assets – net              71,718                                   —               —                               (71,718)             —
Corporate and Merger costs                            (223,113)                               9,126          19,161                                   —         (194,826)
 Consolidated                                      $ 1,563,337                             $ 42,030       $ 593,770                            $ (71,718)    $ 2,127,419


Reconciliation of Revenue excluding Foreign Exchange Effects to Revenue


(In thousands)                                                                             Three Months Ended           %                 Year Ended               %
                                                                                              December 31,            Change             December 31,            Change
                                                                                           2007          2006                         2007           2006

Revenue                                                                               $ 1,836,894      $ 1,770,823      4%          $6,816,909     $ 6,457,435     6%
Less: Foreign exchange increase                                                           (46,921)              —                      (139,595)            —
Revenue excluding effects of foreign exchange                                         $ 1,789,973      $ 1,770,823      1%          $ 6,677,314    $ 6,457,435     3%

Outdoor revenue                                                                        $ 936,726         $ 830,695     13%          $ 3,281,836    $ 2,897,721    13%
Less: Foreign exchange increase                                                          (46,921)               —                      (139,595)            —
International revenue excluding effects of foreign exchange                            $ 889,805         $ 830,695      7%          $ 3,142,241    $ 2,897,721     8%

International Outdoor revenue                                                          $ 531,887         $ 455,072     17%          $ 1,796,778    $ 1,556,365    15%
Less: Foreign exchange increase                                                          (43,186)               —                      (133,260)            —
International Outdoor revenue excluding effects of foreign exchange                    $ 488,701         $ 455,072      7%          $ 1,663,518    $ 1,556,365     7%


Direct Operating and SG&A Expenses

Reconciliation of Expense excluding Foreign Exchange Effects to Expense and Fourth Quarter 2006 Reduction to Operating Expense Due to Legal Settlement


(In thousands)                                                                                    Three Months Ended           %             Year Ended            %
                                                                                                     December 31,            Change         December 31,         Change
                                                                                                   2007         2006                      2007        2006

Consolidated expense                                                                            $ 1,189,061 $ 1,111,283        7%      $ 4,425,556 $ 4,168,094      6%
Less: Foreign exchange increase                                                                     (35,964)         —                    (116,250)         —
Plus: Legal Settlement Expense Reduction                                                                 —        9,803                         —        9,803
Consolidated expense excluding effects of foreign exchange and legal settlement                 $ 1,153,097 $ 1,121,086        3%      $ 4,309,306 $ 4,177,897      3%

Outdoor expense                                                                                   $ 621,701     $ 546,390     14%      $ 2,272,839 $ 2,001,836     14%
Less: Foreign exchange increase                                                                     (35,964)           —                  (116,250)         —
Plus: Legal Settlement Expense Reduction                                                                 —          9,803                       —        9,803
Outdoor expense excluding effects of foreign exchange and legal settlement                        $ 585,737     $ 556,193      5%      $ 2,156,589 $2,011,639       7%

International Outdoor expense                                                                     $ 398,832     $ 337,946     18%      $ 1,455,828 $ 1,260,145     16%
Less: Foreign exchange increase                                                                     (33,223)           —                  (111,339)         —
Plus: Legal Settlement Expense Reduction                                                                 —          9,803                       —        9,803
International Outdoor expense excluding effects of foreign exchange and legal settlement          $ 365,609     $ 347,749      5%      $ 1,344,489 $ 1,269,948      6%
Outdoor OIBDAN excluding Foreign Exchange Effects to OIBDAN


(In thousands)                                                                       Three Months Ended               %                  Year Ended                 %
                                                                                        December 31,                Change              December 31,              Change
                                                                                     2007          2006                              2007            2006

Outdoor OIBDAN                                                                      $ 318,039           $ 285,762      11%          $ 1,018,630     $ 901,896      13%
Less: Foreign exchange increase                                                       (10,957)                 —                        (23,345)           —
Outdoor OIBDAN excluding effects of foreign exchange                                $ 307,082           $ 285,762       7%            $ 995,285     $ 901,896      10%


Reconciliation of OIBDAN to Net income


(In thousands)                                                                               Three Months Ended            %               Year Ended               %
                                                                                                December 31,             Change           December 31,            Change
                                                                                              2007        2006                         2007          2006

OIBDAN                                                                                      $ 615,703      $ 602,132      2%        $ 2,247,138    $ 2,127,419     6%
Non-cash compensation expense                                                                  11,531          9,312                     44,051         42,030
Depreciation & amortization                                                                   145,978        158,181                    564,920        593,770
Gain on disposition of assets – net                                                             3,917         13,337                     14,389         71,718
Operating Income                                                                              462,111        447,976      3%          1,652,556      1,563,337     6%

Interest expense                                                                             104,345         118,113                    451,870        484,063
Gain (loss) on marketable securities                                                           6,081             234                      6,742          2,306
Equity in earnings of nonconsolidated affiliates                                              11,345          12,540                     35,176         37,845
Other income (expense) – net                                                                   6,401          (2,735)                     5,326         (8,593)
Income before income taxes, minority interest and discontinued operations                    381,593         339,902                  1,247,930      1,110,832
Income tax (expense) benefit:
    Current                                                                                  (83,545)       (107,078)                  (245,155)      (270,111)
    Deferred                                                                                 (54,674)        (33,611)                  (183,598)      (188,789)
Income tax (expense) benefit                                                                (138,219)       (140,689)                  (428,753)      (458,900)
Minority interest expense, net of tax                                                        (19,824)        (15,296)                   (47,031)       (31,927)
Income before discontinued operations                                                        223,550         183,917                    772,146        620,005
Income from discontinued operations                                                           97,009          27,427                    166,361         71,512

Net income                                                                                  $ 320,559      $ 211,344                  $ 938,507      $ 691,517


Reconciliation of Net Income and Diluted Earnings per Share (“EPS”)


(In millions, except per share data)                                             Year Ended December 31,                               Year Ended December 31,
                                                                                           2007                                                  2006
                                                                            Net Income                EPS                         Net Income                EPS
Reported Amounts                                                                   $ 938.5               $ 1.89                          $ 691.5               $ 1.38
Discontinued Operations                                                             (166.4)               (0.33)                           (71.5)               (0.14)
Less: Gain on disposition of asset                                                                                                         (35.7)               (0.07)
Current and deferred tax effects                                                                                                            14.7                 0.03
Amounts excluding certain items                                                   $ 772.1                     $ 1.56                     $ 599.0               $ 1.20


2007 Quarterly Information

The following table provides full year 2007 revenues and expenses by business segment.


Fiscal Year 2007
(in $000s)

Net Revenue
                                       1Q 2007                    2Q 2007                        3Q 2007                       4Q 2007                  FY 2007
Radio                                        $770,782                   $914,355                       $879,530                      $874,580               $3,439,247
Outdoor                                       690,856                    836,713                        817,541                       936,726                3,281,836
Other                                          50,634                     56,170                         58,457                        57,437                  222,698
Eliminations                                  (30,654)                   (32,998)                       (31,371)                      (31,849)                (126,872)
Consolidated                               $1,481,618                 $1,774,240                     $1,724,157                    $1,836,894               $6,816,909

Expenses (Excludes Non-Cash Compensation)
                                 1Q 2007                          2Q 2007                        3Q 2007                       4Q 2007                  FY 2007
Radio                                  $486,416                        $521,503                       $516,698                      $545,017                $2,069,634
Outdoor                                       520,371                     560,705                    563,443                     618,687                   2,263,206
Other                                          45,292                      47,226                     46,494                      48,717                     187,729
Eliminations                                  (30,654)                    (32,998)                   (31,371)                    (31,849)                   (126,872)
Consolidated                               $1,021,425                  $1,096,436                 $1,095,264                  $1,180,572                  $4,393,697


About Clear Channel Communications

Clear Channel Communications, Inc. (NYSE:CCU), headquartered in San Antonio, Texas, is a global leader in the out-of-home advertising industry with radio and
television stations and outdoor displays in various countries around the world.

For further information contact:

Investors – Randy Palmer, Senior Vice President of Investor Relations, 210-832-3315 or Media – Lisa Dollinger, Chief Communications Officer, 210-832-3474 or visit
our web-site at http://www.clearchannel.com.

Certain statements in this document constitute “forward-looking statements” within the meaning of the Private Securities Litigation Reform Act of 1995. Such
forward-looking statements involve known and unknown risks, uncertainties and other factors which may cause the actual results, performance or achievements of
Clear Channel Communications to be materially different from any future results, performance or achievements expressed or implied by such forward-looking
statements. The words or phrases “guidance,” “believe,” “expect,” “anticipate,” “estimates” and “forecast” and similar words or expressions are intended to identify
such forward-looking statements. In addition, any statements that refer to expectations or other characterizations of future events or circumstances are forward-
looking statements. The Company cannot provide any assurance that the proposed merger transaction announced on November 16, 2006, and amended April 18,
2007 and May 17, 2007 will be completed, or the terms on which the transaction will be consummated.

Various risks that could cause future results to differ from those expressed by the forward-looking statements included in this document include, but are not limited
to: changes in business, political and economic conditions in the U.S. and in other countries in which Clear Channel Communications currently does business (both
general and relative to the advertising industry); fluctuations in interest rates; changes in operating performance; shifts in population and other demographics;
changes in the level of competition for advertising dollars; fluctuations in operating costs; technological changes and innovations; changes in labor conditions;
changes in governmental regulations and policies and actions of regulatory bodies; fluctuations in exchange rates and currency values; changes in tax rates; and
changes in capital expenditure requirements; access to capital markets and changes in credit ratings. Other unknown or unpredictable factors also could have
material adverse effects on Clear Channel Communications’ future results, performance or achievements. In light of these risks, uncertainties, assumptions and
factors, the forward-looking events discussed in this document may not occur. You are cautioned not to place undue reliance on these forward-looking statements,
which speak only as of the date stated, or if no date is stated, as of the date of this document. Other key risks are described in Clear Channel Communications’
reports filed with the U.S. Securities and Exchange Commission, including in the section entitled “Item 1A. Risk Factors” of the Company’s Annual Report on Form
10-K for the year ended December 31, 2007. Except as otherwise stated in this document, Clear Channel Communications does not undertake any obligation to
publicly update or revise any forward-looking statements because of new information, future events or otherwise.

Important Additional Information Regarding the Merger and Where to Find It:

In connection with the pending merger, CC Media Holdings, Inc. and Clear Channel Communications, Inc. (“Clear Channel”) have filed with the Securities and
Exchange Commission (the “SEC”) a registration statement on Form S-4, as amended, that contains a proxy statement/prospectus and other documents regarding the
pending transaction. Before making any investment decisions, security holders of Clear Channel are urged to read the proxy statement/prospectus and all other documents
regarding the merger, carefully in their entirety, because they contain important information about the pending transaction. Shareholders of Clear Channel may obtain
free copies of the proxy statement/prospectus and other documents filed with, or furnished to, the SEC at the SEC’s website at http://www.sec.gov.

CONTACT:
Clear Channel Communications, Inc., San Antonio
Investors:
Randy Palmer, 210-832-3315
Senior Vice President of Investor Relations
or
Media:
Lisa Dollinger, 210-832-3474
Chief Communications Officer
http://www.clearchannel.com

More Related Content

292 clearchanne

  • 1. UNITED STATES SECURITIES AND EXCHANGE COMMISSION Washington, D.C. 20549 Form 8-K Current Report Pursuant to Section 13 or 15(d) of the Securities Exchange Act of 1934 Date of Report (Date of Earliest Event Reported): 2/14/2008 CLEAR CHANNEL COMMUNICATIONS INC (Exact Name of Registrant as Specified in its Charter) Commission File Number: 001-09645 TX 74-1787539 (State or Other Jurisdiction of (IRS Employer Incorporation or Organization) Identification No.) 200 E. Basse San Antonio, TX 78209 (Address of Principal Executive Offices, Including Zip Code) 210-822-2828 (Registrant’s Telephone Number, Including Area Code) Check the appropriate box below if the Form 8-K filing is intended to simultaneously satisfy the filing obligation of the registrant under any of the following provisions (see General Instruction A.2. below): ⃞ Written communications pursuant to Rule 425 under the Securities Act (17 CFR 230.425) ⃞ Soliciting material pursuant to Rule 14a-12 under the Exchange Act (17 CFR 240.14a-12) ⃞ Pre-commencement communications pursuant to Rule 14d-2(b) under the Exchange Act (17 CFR 240.14d-2(b)) ⃞ Pre-commencement communications pursuant to Rule 13e-4(c) under the Exchange Act (17 CFR 240.13e-4(c))
  • 2. Items to be Included in this Report Item 2.02 RESULTS OF OPERATIONS AND FINANCIAL CONDITION. On February 14, 2008, Clear Channel Communications, Inc. issued a press release announcing its earnings for the quarter and year ended December 31, 2007. The information contained in Exhibit 99.1 is incorporated herein by reference. The information in this Current Report is being furnished and shall not be deemed quot;filedquot; for the purposes of Section 18 of the Securities Exchange Act of 1934, as amended, or otherwise subject to the liabilities of that Section. The information in this Current Report shall not be incorporated by reference into any registration statement or other document pursuant to the Securities Act of 1933, as amended. Item 9.01 FINANCIAL STATEMENTS AND EXHIBITS. (d) Exhibits 99.1 Press Release of Clear Channel Communications, Inc. issued February 14, 2008. Signature(s) Pursuant to the Requirements of the Securities Exchange Act of 1934, the Registrant has duly caused this Report to be signed on its behalf by the Undersigned hereunto duly authorized. CLEAR CHANNEL COMMUNICATIONS, INC. Date: February 14, 2008 By: /S/ HERBERT W. HILL, JR. Herbert W. Hill, Jr. Sr. Vice President/Chief Accounting Officer
  • 3. INDEX TO EXHIBITS 99.1 Press Release of Clear Channel Communications, Inc. issued February 14, 2008.
  • 4. Exhibit 99.1 Clear Channel Announces Fourth Quarter and Full Year 2007 Results Reports Record Diluted Earnings per Share of $1.89 for 2007 Reports Increase of 36% in 2007 Net Income SAN ANTONIO--(BUSINESS WIRE)--Clear Channel Communications, Inc. (NYSE: CCU) today reported results for its fourth quarter and year ended December 31, 2007. Fourth Quarter 2007 Results The Company reported revenues of $1.84 billion in the fourth quarter of 2007, a 4% increase over the $1.77 billion reported for the fourth quarter of 2006. Included in the Company’s revenue is a $46.9 million increase due to movements in foreign exchange; strictly excluding the effects of these movements in foreign exchange, revenue growth would have been 1%. See reconciliation of revenue excluding effects of foreign exchange to revenue at the end of this press release. Clear Channel’s expenses increased 7% to $1.2 billion during the fourth quarter of 2007 compared to 2006. Included in the Company’s 2007 expenses is a $36.0 million increase due to movements in foreign exchange. During the fourth quarter of 2006, the Company recorded a reduction to expenses of $9.8 million as a result of a favorable settlement of a legal proceeding. Strictly excluding the effects of movements in foreign exchange in the 2007 expenses and the $9.8 million reduction to expenses in 2006, expense growth would have been 3%. See reconciliation of expense excluding effects of foreign exchange to expense and fourth quarter 2006 reduction to operating expense due to legal settlement at the end of this press release. Also included in the Company’s 2007 expenses is approximately $11.5 million of non-cash compensation expense. Clear Channel’s income before discontinued operations increased 22% to $223.6 million, as compared to $183.9 million for the same period in 2006. The Company’s diluted earnings before discontinued operations per share increased 22% to $0.45, compared to $0.37 for the same period in 2006. The Company’s OIBDAN (defined as Operating Income before Depreciation & amortization, Non-cash compensation expense and Gain (loss) on disposition of assets – net) was $615.7 million in the fourth quarter of 2007, a 2% increase from the fourth quarter of 2006. See reconciliation of OIBDAN to net income at the end of this press release. Full Year 2007 Results For the full year, the Company reported revenues of $6.82 billion, an increase of 6% when compared to revenues of $6.46 billion for the same period in 2006. Included in the Company’s revenue is a $139.6 million increase due to movements in foreign exchange. The Company’s expenses increased 6% to $4.4 billion during the year compared to 2006. Included in the Company’s expenses is approximately $44.1 million of non-cash compensation expense and a $116.3 million increase due to movements in foreign exchange. The Company’s net income was $938.5 million or $1.89 per diluted share for 2007, the highest earnings per share in the Company’s history. This compares to $691.5 million or $1.38 per diluted share in 2006 or an increase of 37% on a diluted share basis. Income before discontinued operations was $772.1 million or $1.56 per diluted share for 2007. This compares to income before discontinued operations of $620.0 million or $1.24 per diluted share in 2006 or an increase of 26% on a diluted share basis. The Company’s full year 2006 net income included approximately $35.7 million of pre-tax gains, $0.04 per diluted share after-tax, primarily on the divestitures of radio assets and the swap of certain outdoor assets. Excluding these gains, Clear Channel’s 2006 income before discontinued operations would have been $599.0 million or $1.20 per diluted share. See reconciliation of net income and diluted earnings per share at the end of this press release. The Company’s OIBDAN was $2.2 billion for 2007, a 6% increase from 2006. See reconciliation of OIBDAN to net income at the end of this press release. Mark P. Mays, Chief Executive Officer of Clear Channel Communications, commented, “We delivered excellent results with record earnings per share in 2007. Full year and fourth quarter growth in revenue and OIBDAN reflected continued strength throughout our Outdoor operations, which posted double-digit gains in revenue and OIBDAN. Our Radio team continued its successful track record of out-performing our competitors in the radio industry. As we enter 2008, we remain optimistic across all our businesses. We have seen improving trends in the current year in our radio division and would expect that to continue through the end of the year. In Outdoor, we exceeded our forecast for the roll-out of digital boards last year and are on course to accelerate the roll-out this year. Results like these don’t occur without a great team at the helm. We are proud of their performance in 2007 and are confident in their leadership as we capitalize on the many opportunities presented in 2008.” Merger Transaction The Company’s shareholders approved the adoption of the merger agreement, as amended, in which Clear Channel would be acquired by CC Media Holdings, Inc., a corporation formed by private equity funds co-sponsored by Thomas H. Lee Partners, L.P. and Bain Capital Partners, LLC (“the Sponsors”) on September 25, 2007. Under the terms of the merger agreement, as amended, the Company’s shareholders will receive $39.20 in cash for each share they own plus additional per share consideration, if any, as the closing of the merger will occur after December 31, 2007. For a description of the computation of any additional per share consideration and the circumstances under which it is payable, please refer to the joint proxy statement/prospectus dated August 21, 2007, filed with the Securities & Exchange Commission (the quot;Proxy Statementquot;). As an alternative to receiving the $39.20 per share cash consideration, the Company's unaffiliated shareholders were offered the opportunity on a purely voluntary basis to exchange some or all of their shares of Clear Channel common stock on a one-for-one basis for shares of Class A common stock in CC Media Holdings, Inc. (subject to aggregate and individual caps), plus the additional per share consideration, if any. Holders of shares of the Company’s common stock (including shares issuable upon conversion of outstanding options) in excess of the aggregate cap provided in the merger agreement, as amended, elected to receive the stock consideration. As a result, unaffiliated shareholders of the Company will own an aggregate of 30,612,245 shares of CC Media Holdings, Inc. Class A common stock upon consummation of the merger.
  • 5. In connection with the proposed acquisition, the Company agreed with the United States Department of Justice to enter into a Final Judgment and Hold Separate Agreement in accordance with and subject to the Tunney Act. The applicable waiting period under the Hart-Scott-Rodino Antitrust Improvements Act of 1976 expired at 11:59 PM EST on Wednesday, February 13, 2008. There are no remaining regulatory approvals needed to close the transaction. The Company anticipates closing on or before March 31, 2008. Television and Radio Divestitures Television On April 20, 2007, the Company entered into a definitive agreement with an affiliate (“buyer”) of Providence Equity Partners Inc. (“Providence”) to sell its Television Group. On November 29, 2007, the FCC issued its initial consent order approving the assignment of our television station licenses to the buyer. A representative of Providence has informed us that the buyer is considering its options under the definitive agreement, including not closing the acquisition on the terms and conditions in the definitive agreement. The definitive agreement is in full force and effect, has not been terminated and contains customary closing conditions. There have been no allegations that we have breached any of the terms or conditions of the definitive agreement or that there is a failure of a condition to closing the acquisition. The sale of the television division is not contingent on the closing of the merger described above. Further, the sale of the division is not a condition to the closing of the merger described above. The results of the Television Group are reported as assets and liabilities from discontinued operations in the consolidated balance sheet and as discontinued operations in the consolidated statements of operations. Radio On November 16, 2006, the Company announced plans to sell 448 non-core radio stations. The sale of these assets is not contingent on the closing of the merger described above. The Company sold 160 non-core radio stations and had definitive asset purchase agreements for 73 non-core radio stations at December 31, 2007. These stations were classified as assets from discontinued operations in the Company’s consolidated balance sheet and as discontinued operations in the consolidated financial statements as of and for the periods ended December 31, 2007. Through February 13, 2008, the Company had completed the sales of 57 non-core radio stations that were under definitive agreement at December 31, 2007. The Company has 187 non-core radio stations that are no longer under a definitive asset purchase agreement. The definitive asset purchase agreement was terminated in the fourth quarter of 2007. However, the Company continues to actively market these radio stations and they continue to meet the criteria in Statement of Financial Accounting Standards No. 144, Accounting for the Impairment or Disposal of Long-lived Assets, for classification as discontinued operations. Therefore, the assets, results of operations and cash flows from these stations remain classified as discontinued operations in the Company’s consolidated financial statements as of and for the periods ended December 31, 2007. Through February 13, 2008, the Company had definitive asset purchase agreements for the sale of 12 additional non-core radio stations, all of which were part of the 187 stations mentioned above. The closing of these sales is subject to antitrust clearances, FCC approval and other customary closing conditions. Further, the closing of these sales is not a condition to the closing of the merger described above. Total non-core radio stations on November 16, 2006 448 Non-core radio stations sold through December 31, 2007 (160) Non-core radio stations under definitive asset purchase agreements at December 31, 2007 (73) Non-core radio stations not under definitive asset purchase agreements but recorded as discontinued operations at December 31, 2007 (187) Non-core radio stations included in continuing operations at December 31, 2007 28 The Company plans to utilize its capital loss carry forward to offset the related capital gain on the transactions. A portion of the gain will be considered ordinary gain, not capital gain, due to depreciation and amortization recapture, and will be taxed as ordinary income. There can be no assurance that any of the divestitures contemplated in this release will actually be consummated. Furthermore, there can be no assurance that the Company will be able to utilize tax loss carry forwards to offset capital gains as contemplated in this release. Revenue, Direct Operating and SG&A Expenses, and OIBDAN by Division (In thousands) Three Months Ended % Year Ended % December 31, Change December 31, Change 2007 2006 2007 2006 Revenue Radio Broadcasting $ 874,580 $ 899,735 (3%) $ 3,439,247 $ 3,438,141 0% Outdoor Advertising 936,726 830,695 13% 3,281,836 2,897,721 13% Other 57,437 72,529 (21%) 222,698 242,846 (8%) Eliminations (31,849) (32,136) (126,872) (121,273) Consolidated revenue $ 1,836,894 $ 1,770,823 4% $ 6,816,909 $ 6,457,435 6% The Company’s 2007 revenue increased from foreign exchange movements of approximately $46.9 million for the fourth quarter and $139.6 million for the full year as compared to the same period of 2006. Direct Operating and SG&A Expenses by Division Radio Broadcasting $ 550,492 $ 545,189 $ 2,091,860 $ 2,093,718 Less: Non-cash compensation expense (5,475) (6,309) (22,226) (25,237) 545,017 538,880 1% 2,069,634 2,068,481 0%
  • 6. Outdoor Advertising 621,701 546,390 2,272,839 2,001,836 Less: Non-cash compensation expense (3,014) (1,457) (9,633) (6,011) 618,687 544,933 14% 2,263,206 1,995,825 13% Other 48,717 51,840 187,729 193,813 Less: Non-cash compensation expense — (414) — (1,656) 48,717 51,426 (5)% 187,729 192,157 (2)% Eliminations (31,849) (32,136) (126,872) (121,273) Plus: Non-cash compensation expense 8,489 8,180 31,859 32,904 Consolidated divisional operating expenses $ 1,189,061 $ 1,111,283 7% $ 4,425,556 $ 4,168,094 6% The Company’s 2007 direct operating and SG&A expenses increased from foreign exchange movements of approximately $36.0 million for the fourth quarter and $116.3 million for the full year as compared to the same period of 2006. OIBDAN Radio Broadcasting $ 329,563 $ 360,855 (9)% $ 1,369,613 $ 1,369,660 0% Outdoor Advertising 318,039 285,762 11% 1,018,630 901,896 13% Other 8,720 21,103 (59)% 34,969 50,689 (31)% Corporate and Merger costs (40,619) (65,588) (176,074) (194,826) Consolidated OIBDAN $ 615,703 $ 602,132 2% $ 2,247,138 $ 2,127,419 6% See reconciliation of OIBDAN to net income at the end of this press release. Radio Broadcasting The Company’s radio revenue increased $1.1 million during 2007 as compared to 2006. Increases in network, traffic, syndicated radio and on-line revenues were partially offset by declines in local and national revenues. Local and national revenues were down partially as a result of overall weakness in advertising as well as declines in automotive, retail and political advertising categories. During 2007, the Company’s average minute rate declined compared to 2006 for the same period. The radio broadcasting operating expenses declined slightly in 2007 compared to 2006. The decline was primarily from a $14.8 million decline in programming expenses partially related to salaries, a $16.5 million decline in non-traditional expenses primarily related to fewer concert events sponsored by the Company in the current year, and a decline of $9.5 million in bonus and commission expenses. Partially offsetting these declines were increases of $16.2 million in the Company’s marketing and promotions department. Also the Company had an increase of $5.7 million in traffic expenses and $19.1 million in internet expenses associated with the increased revenues in these businesses. Outdoor Advertising The Company’s outdoor advertising revenue increased 13% to $3.3 billion during the year when compared to revenues of $2.9 billion for the same period in 2006. Included in the 2007 results is an approximate $139.6 million increase related to foreign exchange when compared to 2006. Outdoor advertising expenses increased 14% to $2.3 billion during the year when compared to 2006. Included in the Company’s expenses is approximately $9.6 million of non-cash compensation expense and $116.3 million increase related to foreign exchange compared to 2006. Americas Outdoor The Company’s Americas revenue increased $143.7 million, or 11%, during 2007 as compared to 2006 with Interspace contributing approximately $32.1 million to the increase. The growth occurred across the Company’s inventory, including bulletins, street furniture, airports and taxi displays. The revenue growth was primarily driven by bulletin revenue which was driven by increased rates and airport revenue which had both increased rates and occupancy. Leading advertising categories during the year were telecommunications, retail, automotive, financial services and amusements. Revenue growth occurred across many of the Company’s markets, led by Los Angeles, New York, Washington/Baltimore, Atlanta, Boston, Seattle, and Minneapolis. Direct operating and SG&A expenses increased $75.3 million in 2007 as compared to 2006 primarily from an increase in site lease expenses of $46.6 million associated with new contracts and the increase in airport, street furniture and taxi revenues. Interspace contributed $21.6 million to the increase with the rest of the increase primarily attributable to bonus and commission expenses associated with the increase in revenues. International Outdoor The Company’s International revenue increased $240.4 million, or 15%, in 2007 as compared to 2006. Included in the increase was approximately $133.3 million related to movements in foreign exchange. Revenue growth occurred across inventory categories including billboards, street furniture and transit, driven by both increased rates and occupancy. Growth was led by increased revenues in France, Italy, Australia, Spain, Denmark, Turkey and China. The Company’s international direct operating and SG&A expenses increased approximately $195.7 million in 2007 compared to 2006. Included in the increase was approximately $111.4 million related to movements in foreign exchange. The remaining increase was primarily attributable to an increase in site lease and selling expenses associated with the increase in revenue. During the fourth quarter of 2006, the Company recorded a $9.8 million reduction to expenses as a result of the favorable settlement of a legal proceeding.
  • 7. FAS No. 123 (R): Share-Based Payment (“FAS 123(R)”) The following table details non-cash compensation expense, which represents employee compensation costs related to stock option grants and restricted stock awards, for the fourth quarter and full year of 2007 and 2006: (In millions) Three Months Ended Year Ended December 31, December 31, 2007 2006 2007 2006 Direct operating expense $ 4.6 $ 4.0 $ 17.0 $ 16.1 SG&A 3.9 4.2 14.9 16.8 Corporate 3.0 1.1 12.2 9.1 Total non-cash compensation $ 11.5 $ 9.3 $ 44.1 $ 42.0 The Company will not be holding a Conference Call or Webcast As a result of the Clear Channel Communications, Inc. pending merger transaction that was approved by Clear Channel Communications, Inc. shareholders on September 25, 2007, the Company will not be hosting a teleconference or webcast to discuss results. First Quarter and 2008 Outlook Due to the proposed merger transaction and the Company not hosting a teleconference to discuss financial and operating results, the Company is providing the following information regarding its expectations and current information related to 2008 operating results. Pacing information presented below reflects revenues booked at a specific date versus the comparable date in the prior period and may or may not reflect the actual revenue growth at the end of the period. The Company’s revenue pacing information includes an adjustment to prior periods to include all acquisitions and exclude all divestitures in both periods presented for comparative purposes. All pacing metrics exclude the effects of foreign exchange movements. The Company’s operating expense forecasts are on a reportable basis excluding non-cash compensation expense, i.e. there is not an adjustment for acquisitions, divestitures or the effects of foreign exchange movements. As of February 8, 2008, revenues for the consolidated Company are pacing up 0.2% for the first quarter of 2008 as compared to the first quarter of 2007, and are pacing up 1.4% for the full year of 2008 as compared to the full year of 2007. As of the first week of February, the Company has historically experienced revenues booked of approximately 85% of the actual revenues recorded for the first quarter and approximately 40% of the actual revenues recorded for the full year. As of February 8, 2008, revenues for the Radio division are pacing down 4.0% for the first quarter of 2008 as compared to the first quarter of 2007, and are pacing down 0.9% for the full year of 2008 as compared to the full year of 2007. As of the first week of February, the Radio division has historically experienced revenues booked of approximately 85% of the actual revenues recorded for the first quarter and approximately 40% of the actual revenues recorded for the full year. The Company’s Radio division currently forecasts total operating expense growth to be in a range of down low single-digits to up low single-digits for the full year 2008 as compared to the full year 2007. Also as of February 8, 2008, revenues in the Outdoor division are pacing up 4.5% with both the Americas and International pacing relatively in-line with the 4.5% pacing for the first quarter 2008 as compared to the first quarter of 2007. For the full year 2008 versus the full year 2007, the Outdoor division revenues are pacing up 3.7% with the Americas slightly below and International slightly above the full-year pacing of 3.7%. As of the first week of February, the Outdoor division has historically experienced revenues booked of approximately 85% of the actual revenues recorded for the first quarter and approximately 45% of the actual revenues recorded for the full year. Excluding the effects of movements in foreign exchange, the Company’s Outdoor division currently forecasts total operating expense growth to be in a range of low single-digit to mid-single digit growth for the full year 2008 as compared to the full year 2007. For the consolidated company, current management forecasts show corporate expenses of $180 to $190 million for the full year 2008. This projection does not include any ongoing management fees that may be paid to the Sponsors. Non-cash compensation expense (i.e. FAS No. 123 (R): share-based payments) are currently projected to be in the range of $40 million to $50 million for the full year of 2008. These projections do not consider any expense associated with the pending merger transaction. The Company currently forecasts overall capital expenditures for 2008 of $375 to $400 million, excluding any capital expenditures associated with any new contract wins the Company may have during 2008. Increases over the 2007 level would be primarily due to new contract wins in France and China during 2007 and the acceleration of the roll-out of digital boards. Income tax expense as a percent of ‘Income before income taxes and minority interest’ is currently projected to be approximately 38%. Current income tax expense as a percent of ‘Income before income taxes and minority interest’ is currently expected to be 23% to 26%. This percentage does not include any tax expense or benefit related to the pending merger transaction, the announced divestitures of the Company’s television stations and certain of its radio stations or other capital gain transactions, or the effects of any resolution of governmental examinations. TABLE 1 - Financial Highlights of Clear Channel Communications, Inc. and Subsidiaries - Unaudited (In thousands, except Three Months Ended Twelve Months Ended per share data) December 31, % December 31, % 2007 2006 Change 2007 2006 Change Revenue $ 1,836,894 $ 1,770,823 4% $ 6,816,909 $ 6,457,435 6% Direct operating expenses 732,620 678,204 2,707,254 2,506,717 Selling, general and administrative expenses 456,441 433,079 1,718,302 1,661,377 Corporate expenses 43,271 59,087 181,504 196,319
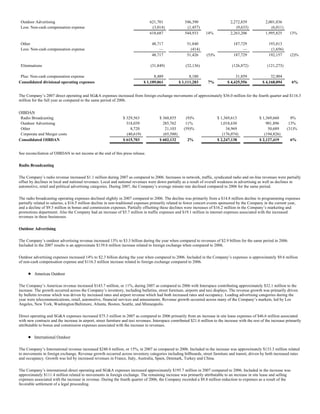
  • 8. Merger costs 390 7,633 6,762 7,633 Depreciation and amortization 145,978 158,181 564,920 593,770 Gain (loss) on disposition of assets – net 3,917 13,337 14,389 71,718 Operating Income 462,111 447,976 3% 1,652,556 1,563,337 6% Interest expense 104,345 118,113 451,870 484,063 Gain (loss) on marketable securities 6,081 234 6,742 2,306 Equity in earnings of nonconsolidated affiliates 11,345 12,540 35,176 37,845 Other income (expense) – net 6,401 (2,735) 5,326 (8,593) Income before income taxes, minority interest and discontinued operations 381,593 339,902 1,247,930 1,110,832 Income tax benefit (expense): Current (83,545) (107,078) (245,155) (270,111) Deferred (54,674) (33,611) (183,598) (188,789) Income tax benefit (expense) (138,219) (140,689) (428,753) (458,900) Minority interest income (expense), net of tax (19,824) (15,296) (47,031) (31,927) Income before discontinued operations 223,550 183,917 772,146 620,005 Income from discontinued operations 97,009 27,427 166,361 71,512 Net income $ 320,559 $ 211,344 $ 938,507 $ 691,517 Diluted earnings per share: Diluted earnings before discontinued operations per share $ .45 $ .37 22% $ 1.56 $ 1.24 26% Diluted earnings per share $ .65 $ .43 51% $ 1.89 $ 1.38 37% Weighted average shares outstanding – Diluted 496,389 492,479 495,784 501,639 TABLE 2 - Selected Balance Sheet Information - Unaudited Selected balance sheet information for 2007 and 2006 was: (In millions) December 31, 2007 December 31, 2006 Cash $ 145.1 $ 116.0 Total Current Assets $ 2,294.6 $ 2,205.7 Net Property, Plant and Equipment $ 3,003.2 $ 2,960.5 Total Assets $ 18,805.5 $ 18,886.9 Current Liabilities (excluding current portion of long-term debt) $ 1,453.1 $ 1,327.5 Long-Term Debt (including current portion of long-term debt) $ 6,575.2 $ 7,663.0 Shareholders’ Equity $ 8,797.5 $ 8,042.3 TABLE 3 - Capital Expenditures - Unaudited Capital expenditures for the full year of 2007 and 2006 were: (In millions) December 31, 2007 December 31, 2006 Non-revenue producing $ 167.7 $ 178.5 Revenue producing 194.3 153.9 Total capital expenditures $ 362.0 $ 332.4 The Company defines non-revenue producing capital expenditures as those expenditures that are required on a recurring basis. Revenue producing capital expenditures are discretionary capital investments for new revenue streams, similar to an acquisition. TABLE 4 - Total Debt - Unaudited At December 31, 2007, Clear Channel had total debt of: (In millions) December 31, 2007 Bank Credit Facilities $ 174.6 Public Notes 6,294.5 Other Debt 106.1 Total $ 6,575.2
  • 9. Liquidity and Financial Position For the year ended December 31, 2007, cash flow from operating activities was $1.55 billion, cash flow used by investing activities was $481.4 million, cash flow used by financing activities was $1.43 billion, and net cash provided by discontinued operations was $392.3 million for a net increase in cash of $29.1 million. Leverage, defined as debt*, net of cash, divided by the trailing 12-month pro forma EBITDA**, was 3.0x at December 31, 2007. The Company reduced long-term debt (including current portion of long-term debt) by approximately $1.1 billion in 2007. As of December 31, 2007, 80% of the Company’s debt bears interest at fixed rates while 20% of the Company’s debt bears interest at floating rates based upon LIBOR. The Company’s weighted average cost of debt at December 31, 2007 was 6.0%. As of February 14, 2008, the Company had approximately $997.8 million available on its bank credit facility. The Company may utilize existing capacity under its bank facility and other available funds for general working capital purposes including funding capital expenditures, acquisitions, stock repurchases and the refinancing of certain public debt securities. Capacity under the facility can also be used to support commercial paper programs. Redemptions or repurchases of securities will occur through open market purchases, privately negotiated transactions, or other means. * As defined by Clear Channel’s credit facility, debt is long-term debt of $6.58 billion plus letters of credit of $180.7 million; guarantees of third party debt of $0; net original issue discount/premium of $15.1 million; deferred purchase consideration of $48.1 million included in other long-term liabilities; plus the fair value of interest rate swaps of $11.4 million; and less purchase accounting premiums of $3.2 million. ** As defined by Clear Channel’s credit facility, pro forma EBITDA is the trailing twelve-month EBITDA adjusted to include EBITDA of any assets acquired in the trailing twelve-month period. Supplemental Disclosure Regarding Non-GAAP Financial Information Operating Income before Depreciation and Amortization (D&A), Non-cash Compensation Expense and Gain (Loss) on Disposition of Assets – Net (OIBDAN) The following tables set forth Clear Channel's OIBDAN for the three months and years ended December 31, 2007 and 2006. The Company defines OIBDAN as net income adjusted to exclude non-cash compensation expense and the following line items presented in its Statement of Operations: Discontinued operations; Minority interest, net of tax; Income tax benefit (expense); Other income (expense) - net; Equity in earnings of nonconsolidated affiliates; Gain (loss) on marketable securities; Interest expense; Gain (loss) on disposition of assets - net; and, D&A. The Company uses OIBDAN, among other things, to evaluate the Company's operating performance. This measure is among the primary measures used by management for planning and forecasting of future periods, as well as for measuring performance for compensation of executives and other members of management. This measure is an important indicator of the Company's operational strength and performance of its business because it provides a link between profitability and cash flows from operating activities. It is also a primary measure used by management in evaluating companies as potential acquisition targets. The Company believes the presentation of this measure is relevant and useful for investors because it allows investors to view performance in a manner similar to the method used by the Company's management. It helps improve investors’ ability to understand the Company's operating performance and makes it easier to compare the Company's results with other companies that have different capital structures, stock option structures or tax rates. In addition, this measure is also among the primary measures used externally by the Company's investors, analysts and peers in its industry for purposes of valuation and comparing the operating performance of the Company to other companies in its industry. Additionally, the Company’s bank credit facilities use this measure for compliance with leverage covenants. Since OIBDAN is not a measure calculated in accordance with GAAP, it should not be considered in isolation of, or as a substitute for, net income as an indicator of operating performance and may not be comparable to similarly titled measures employed by other companies. OIBDAN is not necessarily a measure of the Company's ability to fund its cash needs. As it excludes certain financial information compared with operating income and net income (loss), the most directly comparable GAAP financial measures, users of this financial information should consider the types of events and transactions, which are excluded. In addition, because a significant portion of the Company’s advertising operations are conducted in foreign markets, principally France and the United Kingdom, management reviews the operating results from its foreign operations on a constant dollar basis. A constant dollar basis (i.e. a foreign currency adjustment is made to the 2007 actual foreign revenues and expenses at average 2006 foreign exchange rates) allows for comparison of operations independent of foreign exchange movements. As required by the SEC, the Company provides reconciliations below to the most directly comparable amounts reported under GAAP, including (i) OIBDAN for each segment to consolidated operating income; (ii) Revenue excluding foreign exchange effects to revenue; (iii) Expense excluding foreign exchange effects and fourth quarter 2006 reduction to operating expense due to legal settlement to expenses; (iv) OIBDAN to net income; and (v) Net income and diluted earnings per share excluding certain items discussed earlier. (In thousands) Depreciation Operating income Non-cash compensation and Gain (loss)on disposition of assets - (loss) expense amortization net OIBDAN Three Months Ended December 31, 2007 Radio Broadcasting $ 299,688 $ 5,475 $ 24,400 $— $ 329,563 Outdoor 209,158 3,014 105,867 — 318,039 Other (2,932) — 11,652 — 8,720 Gain (loss) on disposition of assets – net 3,917 — — (3,917) — Corporate and Merger costs (47,720) 3,042 4,059 (40,619) Consolidated $ 462,111 $ 11,531 $ 145,978 $ (3,917) $ 615,703
  • 10. Three Months Ended December 31, 2006 Radio Broadcasting $ 324,232 $ 6,309 $ 30,314 $— $ 360,855 Outdoor 175,845 1,457 108,460 — 285,762 Other 5,959 414 14,730 — 21,103 Gain (loss) on disposition of assets – net 13,337 — — (13,337) — Corporate and Merger costs (71,397) 1,132 4,677 — (65,588) Consolidated $ 447,976 $ 9,312 $ 158,181 $ (13,337) $ 602,132 Year Ended December 31, 2007 Radio Broadcasting $ 1,242,015 $ 22,226 $ 105,372 $— $ 1,369,613 Outdoor 609,514 9,633 399,483 — 1,018,630 Other (8,854) — 43,823 — 34,969 Gain (loss) on disposition of assets – net 14,389 — — (14,389) — Corporate and Merger costs (204,508) 12,192 16,242 — (176,074) Consolidated $ 1,652,556 $ 44,051 $ 564,920 $ (14,389) $ 2,247,138 Year Ended December 31, 2006 Radio Broadcasting $ 1,225,706 $ 25,237 $ 118,717 $— $ 1,369,660 Outdoor 488,155 6,011 407,730 — 901,896 Other 871 1,656 48,162 — 50,689 Gain (loss) on disposition of assets – net 71,718 — — (71,718) — Corporate and Merger costs (223,113) 9,126 19,161 — (194,826) Consolidated $ 1,563,337 $ 42,030 $ 593,770 $ (71,718) $ 2,127,419 Reconciliation of Revenue excluding Foreign Exchange Effects to Revenue (In thousands) Three Months Ended % Year Ended % December 31, Change December 31, Change 2007 2006 2007 2006 Revenue $ 1,836,894 $ 1,770,823 4% $6,816,909 $ 6,457,435 6% Less: Foreign exchange increase (46,921) — (139,595) — Revenue excluding effects of foreign exchange $ 1,789,973 $ 1,770,823 1% $ 6,677,314 $ 6,457,435 3% Outdoor revenue $ 936,726 $ 830,695 13% $ 3,281,836 $ 2,897,721 13% Less: Foreign exchange increase (46,921) — (139,595) — International revenue excluding effects of foreign exchange $ 889,805 $ 830,695 7% $ 3,142,241 $ 2,897,721 8% International Outdoor revenue $ 531,887 $ 455,072 17% $ 1,796,778 $ 1,556,365 15% Less: Foreign exchange increase (43,186) — (133,260) — International Outdoor revenue excluding effects of foreign exchange $ 488,701 $ 455,072 7% $ 1,663,518 $ 1,556,365 7% Direct Operating and SG&A Expenses Reconciliation of Expense excluding Foreign Exchange Effects to Expense and Fourth Quarter 2006 Reduction to Operating Expense Due to Legal Settlement (In thousands) Three Months Ended % Year Ended % December 31, Change December 31, Change 2007 2006 2007 2006 Consolidated expense $ 1,189,061 $ 1,111,283 7% $ 4,425,556 $ 4,168,094 6% Less: Foreign exchange increase (35,964) — (116,250) — Plus: Legal Settlement Expense Reduction — 9,803 — 9,803 Consolidated expense excluding effects of foreign exchange and legal settlement $ 1,153,097 $ 1,121,086 3% $ 4,309,306 $ 4,177,897 3% Outdoor expense $ 621,701 $ 546,390 14% $ 2,272,839 $ 2,001,836 14% Less: Foreign exchange increase (35,964) — (116,250) — Plus: Legal Settlement Expense Reduction — 9,803 — 9,803 Outdoor expense excluding effects of foreign exchange and legal settlement $ 585,737 $ 556,193 5% $ 2,156,589 $2,011,639 7% International Outdoor expense $ 398,832 $ 337,946 18% $ 1,455,828 $ 1,260,145 16% Less: Foreign exchange increase (33,223) — (111,339) — Plus: Legal Settlement Expense Reduction — 9,803 — 9,803 International Outdoor expense excluding effects of foreign exchange and legal settlement $ 365,609 $ 347,749 5% $ 1,344,489 $ 1,269,948 6%
  • 11. Outdoor OIBDAN excluding Foreign Exchange Effects to OIBDAN (In thousands) Three Months Ended % Year Ended % December 31, Change December 31, Change 2007 2006 2007 2006 Outdoor OIBDAN $ 318,039 $ 285,762 11% $ 1,018,630 $ 901,896 13% Less: Foreign exchange increase (10,957) — (23,345) — Outdoor OIBDAN excluding effects of foreign exchange $ 307,082 $ 285,762 7% $ 995,285 $ 901,896 10% Reconciliation of OIBDAN to Net income (In thousands) Three Months Ended % Year Ended % December 31, Change December 31, Change 2007 2006 2007 2006 OIBDAN $ 615,703 $ 602,132 2% $ 2,247,138 $ 2,127,419 6% Non-cash compensation expense 11,531 9,312 44,051 42,030 Depreciation & amortization 145,978 158,181 564,920 593,770 Gain on disposition of assets – net 3,917 13,337 14,389 71,718 Operating Income 462,111 447,976 3% 1,652,556 1,563,337 6% Interest expense 104,345 118,113 451,870 484,063 Gain (loss) on marketable securities 6,081 234 6,742 2,306 Equity in earnings of nonconsolidated affiliates 11,345 12,540 35,176 37,845 Other income (expense) – net 6,401 (2,735) 5,326 (8,593) Income before income taxes, minority interest and discontinued operations 381,593 339,902 1,247,930 1,110,832 Income tax (expense) benefit: Current (83,545) (107,078) (245,155) (270,111) Deferred (54,674) (33,611) (183,598) (188,789) Income tax (expense) benefit (138,219) (140,689) (428,753) (458,900) Minority interest expense, net of tax (19,824) (15,296) (47,031) (31,927) Income before discontinued operations 223,550 183,917 772,146 620,005 Income from discontinued operations 97,009 27,427 166,361 71,512 Net income $ 320,559 $ 211,344 $ 938,507 $ 691,517 Reconciliation of Net Income and Diluted Earnings per Share (“EPS”) (In millions, except per share data) Year Ended December 31, Year Ended December 31, 2007 2006 Net Income EPS Net Income EPS Reported Amounts $ 938.5 $ 1.89 $ 691.5 $ 1.38 Discontinued Operations (166.4) (0.33) (71.5) (0.14) Less: Gain on disposition of asset (35.7) (0.07) Current and deferred tax effects 14.7 0.03 Amounts excluding certain items $ 772.1 $ 1.56 $ 599.0 $ 1.20 2007 Quarterly Information The following table provides full year 2007 revenues and expenses by business segment. Fiscal Year 2007 (in $000s) Net Revenue 1Q 2007 2Q 2007 3Q 2007 4Q 2007 FY 2007 Radio $770,782 $914,355 $879,530 $874,580 $3,439,247 Outdoor 690,856 836,713 817,541 936,726 3,281,836 Other 50,634 56,170 58,457 57,437 222,698 Eliminations (30,654) (32,998) (31,371) (31,849) (126,872) Consolidated $1,481,618 $1,774,240 $1,724,157 $1,836,894 $6,816,909 Expenses (Excludes Non-Cash Compensation) 1Q 2007 2Q 2007 3Q 2007 4Q 2007 FY 2007 Radio $486,416 $521,503 $516,698 $545,017 $2,069,634
  • 12. Outdoor 520,371 560,705 563,443 618,687 2,263,206 Other 45,292 47,226 46,494 48,717 187,729 Eliminations (30,654) (32,998) (31,371) (31,849) (126,872) Consolidated $1,021,425 $1,096,436 $1,095,264 $1,180,572 $4,393,697 About Clear Channel Communications Clear Channel Communications, Inc. (NYSE:CCU), headquartered in San Antonio, Texas, is a global leader in the out-of-home advertising industry with radio and television stations and outdoor displays in various countries around the world. For further information contact: Investors – Randy Palmer, Senior Vice President of Investor Relations, 210-832-3315 or Media – Lisa Dollinger, Chief Communications Officer, 210-832-3474 or visit our web-site at http://www.clearchannel.com. Certain statements in this document constitute “forward-looking statements” within the meaning of the Private Securities Litigation Reform Act of 1995. Such forward-looking statements involve known and unknown risks, uncertainties and other factors which may cause the actual results, performance or achievements of Clear Channel Communications to be materially different from any future results, performance or achievements expressed or implied by such forward-looking statements. The words or phrases “guidance,” “believe,” “expect,” “anticipate,” “estimates” and “forecast” and similar words or expressions are intended to identify such forward-looking statements. In addition, any statements that refer to expectations or other characterizations of future events or circumstances are forward- looking statements. The Company cannot provide any assurance that the proposed merger transaction announced on November 16, 2006, and amended April 18, 2007 and May 17, 2007 will be completed, or the terms on which the transaction will be consummated. Various risks that could cause future results to differ from those expressed by the forward-looking statements included in this document include, but are not limited to: changes in business, political and economic conditions in the U.S. and in other countries in which Clear Channel Communications currently does business (both general and relative to the advertising industry); fluctuations in interest rates; changes in operating performance; shifts in population and other demographics; changes in the level of competition for advertising dollars; fluctuations in operating costs; technological changes and innovations; changes in labor conditions; changes in governmental regulations and policies and actions of regulatory bodies; fluctuations in exchange rates and currency values; changes in tax rates; and changes in capital expenditure requirements; access to capital markets and changes in credit ratings. Other unknown or unpredictable factors also could have material adverse effects on Clear Channel Communications’ future results, performance or achievements. In light of these risks, uncertainties, assumptions and factors, the forward-looking events discussed in this document may not occur. You are cautioned not to place undue reliance on these forward-looking statements, which speak only as of the date stated, or if no date is stated, as of the date of this document. Other key risks are described in Clear Channel Communications’ reports filed with the U.S. Securities and Exchange Commission, including in the section entitled “Item 1A. Risk Factors” of the Company’s Annual Report on Form 10-K for the year ended December 31, 2007. Except as otherwise stated in this document, Clear Channel Communications does not undertake any obligation to publicly update or revise any forward-looking statements because of new information, future events or otherwise. Important Additional Information Regarding the Merger and Where to Find It: In connection with the pending merger, CC Media Holdings, Inc. and Clear Channel Communications, Inc. (“Clear Channel”) have filed with the Securities and Exchange Commission (the “SEC”) a registration statement on Form S-4, as amended, that contains a proxy statement/prospectus and other documents regarding the pending transaction. Before making any investment decisions, security holders of Clear Channel are urged to read the proxy statement/prospectus and all other documents regarding the merger, carefully in their entirety, because they contain important information about the pending transaction. Shareholders of Clear Channel may obtain free copies of the proxy statement/prospectus and other documents filed with, or furnished to, the SEC at the SEC’s website at http://www.sec.gov. CONTACT: Clear Channel Communications, Inc., San Antonio Investors: Randy Palmer, 210-832-3315 Senior Vice President of Investor Relations or Media: Lisa Dollinger, 210-832-3474 Chief Communications Officer http://www.clearchannel.com