Jarden_AR
- 1. 2003 Annual Report 2003 Annual Report
- 2. Table of Contents . 2 . CHAIRMAN’S LETTER 4 . BRANDED CONSUMABLES 6 . CONSUMER SOLUTIONS 8 . PLASTIC CONSUMABLES 9 . OTHER 10 . S E L E C T E D F I N A N C I A L D ATA 13 . MANAGEMENT’S DISCUSSION A N A LY S I S AND 31 . F I N A N C I A L S TAT E M E N T S Winner of Jarden’s 2003 Annual Report Cover Design Contest: Kim Huffman, Branded Consumables
- 3. Corporate Profile Jarden Corporation is a leading provider of niche consumer products used in and around the home, under well-known brand names including Ball® Bernardin® Crawford® Diamond® , , , , FoodSaver® Forster® Kerr® Lehigh® Leslie-Locke® Loew-Cornell® and VillaWare®. In North , , , , , America, Jarden is the market leader in several targeted consumer categories, including home canning, home vacuum packaging, kitchen matches, plastic cutlery, rope, cord and twine and toothpicks. Many of our products are affordable, consumable and fundamental household staples. Corporate Strategy Our objective is to increase shareholder value by building a world class consumer products company that enjoys leading market shares of niche markets for branded consumer products used in and around the home. We will seek to achieve this objective by leveraging and expanding our domestic and international distribution channels, introducing new products and pursuing strategic acquisitions. page 1
- 4. CHAIRMAN’S LETTER D Dear Fellow Shareholders: In 2003, we completed two significant acquisitions, as well as In my letter to shareholders last year, I stated that we entered two tuck-in transactions, adding over $250 million in annualized 2003 with a solid platform of businesses and considerable incremental revenue to the group. In the branded consumables momentum for growth. I am delighted to report that your segment, Diamond Brands provided Jarden with market leading company succeeded in meeting or beating its major objectives positions in wooden matches, toothpicks, clothespins and boxed for the year, both operationally and financially. retail plastic cutlery. The Lehigh acquisition expanded our We reported record financial performance in 2003 with retail distribution to the do-it-yourself market, while establishing revenues surpassing the $500 million mark and cash flow us as the largest provider of rope, cord and twine used by con- from operations exceeding $70 million. At the same time, sumers in the United States. Equally important as the valuations shareholder value continued to expand as evidenced by a on which we were able to buy these businesses, the acquisitions 72% increase in our share price, which was achieved on the have been successfully integrated into the group and we are heels of strong our performance in 2002. actively pursuing opportunities to maximize their growth within the Jarden family. Our strategy over the last two years has been to focus on building a portfolio of market-leading, niche branded As part of our ongoing commitment to manage our balance consumer products that produce EBITDA margins in excess sheet in what we consider to be a conservative manner during of 15%. While the nature of our products might appear to be this period of rapid expansion, we completed a primary equity diverse, as illustrated by the front cover of this annual report, offering that netted the company $112 million of new capital they are remarkably similar and cohesive from an operating for acquisitions and general corporate purposes. In addition, perspective. Typically our products are “basic” in nature with we continued to tap the debt markets on an opportunistic basis a consumable element, are used in and around the home during 2003 to build our long-term credit base. This included and can be shipped in a coordinated manner through our the issuance of an additional $32 million of ten year notes and well-established, complementary distribution channels. Our $280 million of senior secured loans. The strong credit markets goal is to build on our existing portfolio of brands and in general, and receptiveness to Jarden in particular, allowed us products by introducing line extensions or new products that to close these financings at favorable rates. Furthermore, the 3 can best serve the needs of our customers. for 2 stock split completed in November increased liquidity in the market for Jarden’s common stock at a time of heightened As a result of our efforts in the last two and a half years, Jarden investor interest. has become a highly regarded leader in the consumer products market. We continue to work on expanding the depth and On the operating front, I am pleased to report that we continued breadth of our product offerings to increase organic growth to strengthen our management ranks during 2003, following in revenue and earnings. our mantra that, “Our best assets go home every night.” “We believe our portfolio of well-recognized consumer brands has enormous development potential. The morale within your company is high; we have a clear strategy, a successful operating business and a motivated and enthusiastic management team.” page 2
- 5. We created the position of President and Chief Operating Officer to complement my work, as well as that of Ian Ashken, our Chief Financial Officer and my colleague of fifteen years. Jim Lillie has filled this new position admirably and we expect he will continue to make a significant contribution to our efforts to maximize the synergistic opportunities within our business units. Our success in 2003 did not go unnoticed. Forbes Magazine ranked Jarden 47th on its list of top 200 growth companies, out of a list of 3,500 eligible companies. The San Francisco Business Times named Tilia, our consumer solutions business, one of the “50 best places to work” in the greater Bay area. Additionally, Alltrista Consumer Products, part of our branded consumables segment, was awarded Wal-Mart’s Supplier Award of Excellence for home canning for the third quarter of 2003. It is my view that the best is yet to come for Jarden Corporation. We believe our portfolio of well-recognized consumer brands has enormous development potential. The morale within your company is high; we have a clear strategy, a successful operating business and a motivated and enthusiastic management team. As we enter the new year, our main focus is executing our business strategy. Your management team intends to build on our success in this area over the last two and a half years to deliver another record year in 2004. I am sure that you will join me in expressing gratitude to all employee members of the Jarden family, without whose essential contribution to the company the achievements over the last year would not have been possible. Yours sincerely, Martin E. Franklin Chairman and Chief Executive Officer page 3
- 6. BRANDED CONSUMABLES Key Statistics . 2003 Revenue of $257.9 million, 14.2% Operating Margin . 1,260 employees . Principal operations in Muncie, Indiana; Cloquet, Minnesota; Macungie, Pennsylvania; Merida, Mexico . Web Address: www.alltrista.com Products We manufacture, market and distribute a broad array of well known, highly regarded branded products used in and around the home, including home canning jars, jar closures, kitchen matches, ergonomically designed lighters, plastic cutlery, a variety of rope, cord and twine, garage and workshop storage hooks and racks, security doors, ornamental fencing, wooden craft products and a complete line of toothpicks, all marketed under a portfolio of highly recognized brand names including Ball® Bernardin® Diamond® Forster® Kerr® Lehigh® and Leslie-Locke®. , , , , , Distribution Our leading market positions, both direct and through distribution, provide us access to major retail outlets including grocery stores, mass merchants, warehouse home centers, department stores, value retailers, hardware stores and craft stores. Our customers include leading retailers such as Albertson’s, Home Depot, Lowes, Kroger, Michael’s Stores, Target and Wal- Mart, among many others. page 4
- 7. 2003 Highlights . We expanded our portfolio of products with the addition of the Diamond® Forster® Lady Dianne® Lehigh® and Leslie , , , Locke® to our branded consumables group during the course of 2003. The addition of these businesses has created cross-selling opportunities and expanded already strong relationships with existing customers. . The acquisition of the Lehigh business expanded our already diverse branded consumables product line into the growing Do-It-Yourself market by adding rope, cord and twine, garage storage organizers and other home improvement products. . Diamond® brand kitchen matches and Ball® brand jars have been in continuous use for over 100 years. . We have been named a category manager for Lowes, Home Depot and Wal-Mart, underscoring our focus on serving the needs of our customers and the end consumer. . We introduced a variety of new products, including our gourmet layered cookie mixes packaged in a Ball® jar under the White River Farms label. Debuting last fall on QVC, over one million dollars worth of product was sold in one day. . We accelerated the introduction of new and innovative products, primarily under the Ball® and Diamond® brands, including five fresh-n-fun kits, improved toothpick dispensers, a family of multi-purpose lighters and a Skil® branded multi-purpose work bench. page 5
- 8. CONSUMER SOLUTIONS Key Statistics . 2003 Revenue of $215.8 million, 19.7% Operating Margin . 170 employees . Principal operations in San Francisco, California . Web Address: www.tilia.com Products Our business is dedicated to providing consumers innovative solutions to specific needs within the home, with a particular emphasis on solving problems in and around the kitchen. Our market-leading product line consists of FoodSaver® brand home vacuum packaging machines, bags and accessories, as well as the recently acquired VillaWare® brand of high-end kitchen products. Distribution We sell through a wide array of retailers in North America and a number of distributors in select international markets. Our commitment to sell direct to consumers, superior marketing and retail merchandising and consistent product innovation has resulted in solid relationships with our mass merchant, warehouse club and specialty retail customer base. Key customers include Bed Bath and Beyond, Costco, Kohl’s, QVC, Sam’s, Target, Wal-Mart and Williams-Sonoma. page 6
- 9. 2003 Highlights . We continued our impressive sales growth. FoodSaver® sales increased 12% from 2002 and we launched over 20 new products, more than ever before. . The acquisition of the VillaWare® business added a high-end brand with distribution into the gourmet and specialty food retail markets. . We created the home vacuum packaging category at most of our retailers and continue to lead the category by providing innovation and marketing tools to promote FoodSaver® products to consumers. . We expect that our expansion into channels such as grocery, drug and gourmet specialty stores will continue to drive brand awareness and organic growth. We have a significant number of innovative, patentable new products in development. . Our sales of FoodSaver® accessories, including a variety of canisters, jar sealers, marinating products, universal lids and bottle stoppers have grown significantly as the installed base of FoodSaver® users increases and consumers continue to actively use the products. Our bags and bag rolls sold for use with FoodSaver® machines represent a recurring revenue source and accounted for an increased percentage of our overall FoodSaver® related sales in 2003 versus 2002 and prior years. . We expanded the presence of FoodSaver® in Europe and Australia as a part of our strategy to build on the success we have enjoyed in North America. International sales grew in excess of 100%, but still accounted for less than 3% of overall consumer solutions sales. page 7
- 10. PLASTIC CONSUMABLES Key Statistics . 2003 Revenue of $109.1 million, 8.8% Operating Margin (Revenue and operating margin calculations include intercompany sales.) . 760 employees . Principal operations in Fort Smith, Arkansas; East Wilton, Maine; Springfield, Missouri; Tupper Lake, New York; Reedsville, Pennsylvania; Greenville, South Carolina; and Christchurch, UK . Web Address: www.alltristaplastics.com Products/Distribution We manufacture, market and distribute a wide variety of state-of-the-art injection molded and thermoformed products as well as a variety of plastic consumer products and consumer product components, including closures, contact lens packaging, plastic cutlery, refrigerator door liners, shotgun shell casings, surgical devices and syringes. Our third-party healthcare and consumer products customers include CIBA Vision, Johnson & Johnson, Monsanto, Ethicon, Scotts Company, Whirlpool and Winchester, among others. Our customers also include Jarden’s branded consumables and consumer solutions segments. 2003 Highlights . We successfully integrated the acquired plastic cutlery businesses while maintaining the highest levels of customer service and minimizing overhead costs. . In 2003, we expanded our presence in Europe by adding a UK plant to our holdings, allowing us to better service our global customers. . Initiated in January, our Innovative Solutions engineering and product development group offers our customers superior product development, engineering and design capabilities in addition to a vertically integrated ISO certified manufacturing approach from design to production. . We were recognized in the industry for our manufacturing excellence as the winner of the distinguished “Processor of the Year” award from the Plastics News, a Crains Communications publication. page 8
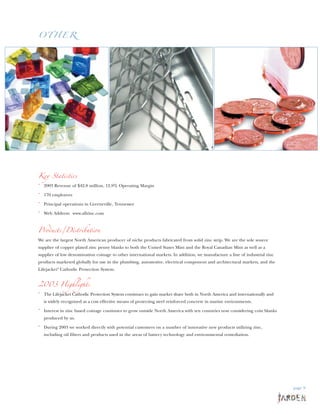
- 11. OTHER Key Statistics . 2003 Revenue of $42.8 million, 12.9% Operating Margin . 170 employees . Principal operations in Greeneville, Tennessee . Web Address: www.allzinc.com Products/Distribution We are the largest North American producer of niche products fabricated from solid zinc strip. We are the sole source supplier of copper plated zinc penny blanks to both the United States Mint and the Royal Canadian Mint as well as a supplier of low denomination coinage to other international markets. In addition, we manufacture a line of industrial zinc products marketed globally for use in the plumbing, automotive, electrical component and architectural markets, and the Lifejacket® Cathodic Protection System. 2003 Highlights . The Lifejacket Cathodic Protection System continues to gain market share both in North America and internationally and is widely recognized as a cost effective means of protecting steel reinforced concrete in marine environments. . Interest in zinc based coinage continues to grow outside North America with ten countries now considering coin blanks produced by us. . During 2003 we worked directly with potential customers on a number of innovative new products utilizing zinc, including oil filters and products used in the areas of battery technology and environmental remediation. page 9
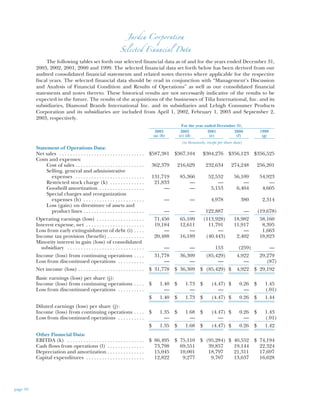
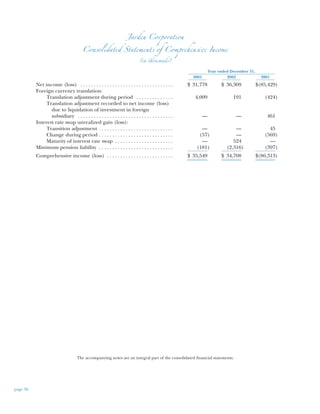
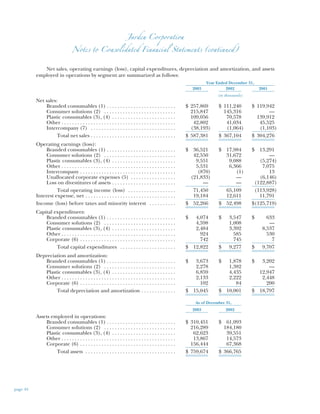
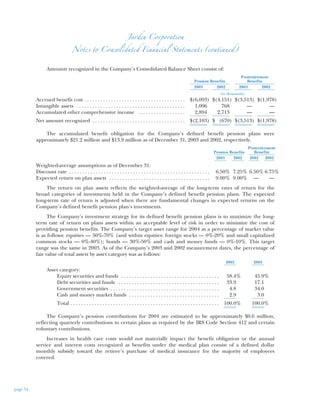
- 12. Jarden Corporation Selected Financial Data The following tables set forth our selected financial data as of and for the years ended December 31, 2003, 2002, 2001, 2000 and 1999. The selected financial data set forth below has been derived from our audited consolidated financial statements and related notes thereto where applicable for the respective fiscal years. The selected financial data should be read in conjunction with “Management’s Discussion and Analysis of Financial Condition and Results of Operations” as well as our consolidated financial statements and notes thereto. These historical results are not necessarily indicative of the results to be expected in the future. The results of the acquisitions of the businesses of Tilia International, Inc. and its subsidiaries, Diamond Brands International Inc. and its subsidiaries and Lehigh Consumer Products Corporation and its subsidiaries are included from April 1, 2002, February 1, 2003 and September 2, 2003, respectively. For the year ended December 31, 2003 2002 2001 2000 1999 (a) (b) (c) (d) (e) (f) (g) (in thousands, except per share data) Statement of Operations Data: Net sales . . . . . . . . . . . . . . . . . . . . . . . . . . . . . . . . $587,381 $367,104 $304,276 $356,123 $356,525 Costs and expenses: Cost of sales . . . . . . . . . . . . . . . . . . . . . . . . . . 362,379 216,629 232,634 274,248 256,201 Selling, general and administrative expenses . . . . . . . . . . . . . . . . . . . . . . . . . . 131,719 85,366 52,552 56,109 54,923 Restricted stock charge (k) . . . . . . . . . . . . . 21,833 — — — — Goodwill amortization . . . . . . . . . . . . . . . . . — — 5,153 6,404 4,605 Special charges and reorganization expenses (h) . . . . . . . . . . . . . . . . . . . . . . . — — 4,978 380 2,314 Loss (gain) on divestiture of assets and product lines . . . . . . . . . . . . . . . . . . . . . . . — — 122,887 — (19,678) Operating earnings (loss) . . . . . . . . . . . . . . . . . . 71,450 65,109 (113,928) 18,982 58,160 Interest expense, net . . . . . . . . . . . . . . . . . . . . . . 19,184 12,611 11,791 11,917 8,395 Loss from early extinguishment of debt (i) . . . . — — — — 1,663 Income tax provision (benefit) . . . . . . . . . . . . . . 20,488 16,189 (40,443) 2,402 18,823 Minority interest in gain (loss) of consolidated subsidiary . . . . . . . . . . . . . . . . . . . . . . . . . . . . . — — 153 (259) — Income (loss) from continuing operations . . . . 31,778 36,309 (85,429) 4,922 29,279 Loss from discontinued operations . . . . . . . . . . — — — — (87) Net income (loss) . . . . . . . . . . . . . . . . . . . . . . . . . $ 31,778 $ 36,309 $ (85,429) $ 4,922 $ 29,192 Basic earnings (loss) per share (j): Income (loss) from continuing operations . . . . $ 1.40 $ 1.73 $ (4.47) $ 0.26 $ 1.45 Loss from discontinued operations . . . . . . . . . . — — — — (.01) $ 1.40 $ 1.73 $ (4.47) $ 0.26 $ 1.44 Diluted earnings (loss) per share (j): Income (loss) from continuing operations . . . . $ 1.35 $ 1.68 $ (4.47) $ 0.26 $ 1.43 Loss from discontinued operations . . . . . . . . . . — — — — (.01) $ 1.35 $ 1.68 $ (4.47) $ 0.26 $ 1.42 Other Financial Data: EBITDA (k) . . . . . . . . . . . . . . . . . . . . . . . . . . . . . $ 86,495 $ 75,110 $ (95,284) $ 40,552 $ 74,194 Cash flows from operations (l) . . . . . . . . . . . . . . 73,798 69,551 39,857 19,144 22,324 Depreciation and amortization . . . . . . . . . . . . . . 15,045 10,001 18,797 21,311 17,697 Capital expenditures . . . . . . . . . . . . . . . . . . . . . . 12,822 9,277 9,707 13,637 16,628 page 10
- 13. Jarden Corporation Selected Financial Data (continued) As of December 31, 2003 2002 2001 2000 1999 (a) (b) (c) (d) (e) (f) (g) (dollars in thousands) Balance Sheet Data: Cash and cash equivalents . . . . . . . . . . . . . . . . . . . $125,400 $ 56,779 $ 6,376 $ 3,303 $ 17,394 Working capital . . . . . . . . . . . . . . . . . . . . . . . . . . . 242,039 101,557 8,035 22,975 54,611 Total assets . . . . . . . . . . . . . . . . . . . . . . . . . . . . . . . 759,674 366,765 162,234 310,429 340,364 Total debt . . . . . . . . . . . . . . . . . . . . . . . . . . . . . . . . 387,382 216,955 84,875 137,060 140,761 Total stockholders’ equity . . . . . . . . . . . . . . . . . . . 249,905 76,764 35,129 118,221 123,025 (a) 2003 includes a non-cash restricted stock charge of $21.8 million. Adjusting for the non-cash restricted stock charge, the Company’s diluted earnings per share for 2003 would have been $1.91. Diluted earnings per share, excluding the non-cash restricted stock charge is a non-GAAP financial measure and it is presented in this Form 10-K because it is a basis upon which our management has assessed its financial performance in 2003. Additionally, the Company’s credit agreement has provided for the non-cash restricted stock charge to be excluded in calculations used for determining whether the Company is in compliance with certain credit agreement covenants. This calculation is a measure of the Company’s performance that is not required by, or presented in accordance with, GAAP. As such it should not be considered as an alternative to diluted earnings per share in accordance with GAAP. A reconciliation of the calculation of diluted earnings per share, excluding the non-cash restricted stock charge, is presented below. (b) The results of Diamond Brands and Lehigh are included from February 1, 2003 and September 2, 2003, respectively. (c) The results of Tilia are included from April 1, 2002. (d) 2002 includes a net release of a $4.4 million tax valuation allowance. Adjusting for the net release of the valuation allowance, the Company’s diluted earnings per share for 2002 would have been $1.48. Diluted earnings per share, excluding the net release of the valuation allowance is a non-GAAP financial measure and it is presented in this Form 10-K because it is a basis upon which our management has assessed its financial performance in 2002. This calculation is a measure of the Company’s performance that is not required by, or presented in accordance with, GAAP. As such it should not be considered as an alternative to diluted earnings per share in accordance with GAAP. A reconciliation of the calculation of diluted earnings per share, excluding the net release of the valuation allowance, is presented below. (e) 2001 includes a $121.1 million pretax loss on the sale of thermoforming assets, a $2.3 million pretax charge associated with corporate restructuring, a $1.4 million pretax loss on the sale of the Company’s interest in Microlin, LLC, $2.6 million of pretax separation costs related to the management reorganization, $1.4 million of pretax costs to evaluate strategic options, $1.4 million of pretax costs to exit facilities, a $2.4 million pretax charge for stock option compensation, $4.1 million of pretax income associated with the discharge of deferred compensation obligations and a $1.0 million pretax gain related to an insurance recovery. (f) 2000 includes $1.6 million of pretax income associated with the reduction in long-term performance-based compensation, $1.4 million in pretax litigation charges, net of recoveries and $0.6 million of pretax costs to evaluate strategic options. (g) 1999 includes a $19.7 million pretax gain on the sale of the plastic packaging product line and a $2.3 million pretax charge to exit a plastic thermoforming facility. (h) Special charges and reorganization expenses, net were comprised of costs to evaluate strategic options, discharge of deferred compensation obligations, separation costs for former officers, stock option compensation, corporate restructuring costs, costs to exit facilities, reduction of long-term performance based compensation, litigation charges and items related to our divested thermoforming operations. (i) Pursuant to our adoption of SFAS No. 145, results for the year ended December 31, 1999 have been restated to give effect to the reclassification of $1.6 million ($1.0 million, net of taxes) arising from the early extinguishment of debt previously presented as an extraordinary item. (j) All earnings per share amounts have been adjusted to give effect to a 3-for-2 split of our outstanding shares of common stock that was effected during the fourth quarter of 2003. (k) For the year ended December 31, 2003, EBITDA includes a non-cash restricted stock charge of $21.8 million. For the year ended December 31, 2001, EBITDA includes a $122.9 million loss on divestiture of assets and product lines. EBITDA, a non- GAAP financial measure, is presented in this Form 10-K because the Company’s credit facility and senior subordinated notes contain financial and other covenants which are based on or refer to the Company’s EBITDA. Additionally, EBITDA is a basis upon which our management assesses financial performance and we believe it is frequently used by securities analysts, investors and other interested parties in measuring the operating performance and creditworthiness of companies with comparable market capitalization to the Company, many of which present EBITDA when reporting their results. Furthermore, EBITDA is one of the factors used to determine the total amount of bonuses available to be awarded to executive officers and other employees. EBITDA is widely used by the Company to evaluate potential acquisition candidates. While EBITDA is frequently used as a measure of operations and the ability to meet debt service requirements, it is not necessarily comparable to other similarly titled captions of other companies due to potential inconsistencies in the method of calculation. Because of these limitations, EBITDA should not be considered a primary measure of the Company’s performance and should be reviewed in conjunction with, and not as substitute for, financial measurements prepared in accordance with GAAP that are presented in this Form 10-K. A reconciliation of the calculation of EBITDA, is presented below. (l) For the year ended December 31, 2002, cash flows from operations included $38.6 million of income tax refunds resulting primarily from the 2001 loss on divestiture of assets. page 11
- 14. Jarden Corporation Selected Financial Data (continued) Reconciliations of non-GAAP Measures For the year ended December 31, 2003 2002 2001 2000 1999 (dollars in thousands, except per share data) Net income (loss) . . . . . . . . . . . . . . . . . . . . . . . . . . . . . . $31,778 $36,309 $(85,429) $ 4,922 $29,192 Add back: non-cash restricted stock charge, net of related tax benefit of $8,559 . . . . . . . . . . . . . . . . . . . 13,274 — — — — Less: net release of tax valuation allowance . . . . . . . . . — (4,395) — — — Net income (loss), excluding non-cash restricted stock charge and related tax benefit and net release of tax valuation allowance . . . . . . . . . . . . . . . $45,052 $31,914 $(85,429) $ 4,922 $29,192 Diluted earnings per share, excluding non-cash restricted stock charge and related tax benefit and net release of tax valuation allowance . . . . . . . . . . . $ 1.91 $ 1.48 $ (4.47) $ 0.26 $ 1.42 Income (loss) from continuing operations . . . . . . . . . $31,778 $36,309 $(85,429) $ 4,922 $29,279 Interest expense, net . . . . . . . . . . . . . . . . . . . . . . . . . . . 19,184 12,611 11,791 11,917 8,395 Income tax provision (benefit) . . . . . . . . . . . . . . . . . . . 20,488 16,189 (40,443) 2,402 18,823 Depreciation and amortization . . . . . . . . . . . . . . . . . . . 15,045 10,001 18,797 21,311 17,697 EBITDA . . . . . . . . . . . . . . . . . . . . . . . . . . . . . . . . . . . . . . $86,495 $75,110 $(95,284) $40,552 $74,194 Quarterly Stock Prices The table below sets forth the high and low sales prices of the Company’s common stock as reported on the New York Stock Exchange for the periods indicated. All prices have been adjusted to reflect the 3-for-2 stock split that occurred during the fourth quarter of 2003: First Second Third Fourth Quarter Quarter Quarter Quarter 2003 High ....................................... $18.83 $21.79 $26.84 $28.79 Low ....................................... $14.57 $16.97 $17.67 $23.38 2002 High ....................................... $10.00 $13.31 $18.31 $18.47 Low ....................................... $ 5.05 $ 8.83 $12.23 $13.33 page 12
- 15. Jarden Corporation Management’s Discussion and Analysis The following “Overview” section is a brief summary of the significant issues addressed in Management’s Discussion and Analysis of Financial Condition and Results of Operations (“MD&A”). Investors should read the relevant sections of this MD&A for a complete discussion of the issues summarized below. The entire MD&A should be read in conjunction with the Selected Financial Data and Financial Statements and Supplementary Data appearing elsewhere in this Annual Report. Overview We are a leading provider of niche consumer products used in and around the home, under well- known brand names including Ball®, Bernardin®, Crawford®, Diamond®, FoodSaver®, Forster®, Kerr®, Lehigh® and Leslie-Locke®. In North America, we are the market leader in several consumer categories, including plastic cutlery, home canning, home vacuum packaging, kitchen matches, rope, cord and twine and toothpicks. We also manufacture zinc strip and a wide array of plastic products for third party consumer product and medical companies as well as our own businesses. Results of Operations • Our net sales increased by $220.3 million or 60.0% over 2002; • Our operating income increased by $6.3 million or 9.7% over 2002. Such increase was despite a $21.8 million non-cash restricted stock charge in 2003. Excluding this non-cash restricted stock charge our operating earnings increased by $28.2 million or 43.3% over 2002 (see “Non-GAAP Measures” below); • Our net income decreased by $4.5 million or 12.5% compared to 2002 and our diluted earning per share was $0.33 or 19.6% lower than 2002. Our 2002 results were benefited by a net release of a $4.4 million tax valuation allowance. Absent the 2003 non-cash restricted stock charge of $21.8 million and related tax benefit and the 2002 tax valuation allowance, net income in 2003 would have been $45.1 million or 41.2% higher than net income of $31.9 million in 2002 and diluted earning per share would have been $1.91 in 2003 compared to $1.48 in 2002 (see “Non- GAAP Measures” below); and • The increases to our net sales and our operating income discussed above, are principally the result of acquisitions we completed in 2003 and 2002, which are described in “Acquisitions and Disposition” Activities below. In addition, on an overall basis we had organic growth in 2003, most notably at our consumer solutions segment where we grew net revenues over 10% on a comparable basis to 2002. Liquidity and Capital Resources • We ended 2003 with a stronger balance sheet, as measured by net debt-to-total capitalization, and improved liquidity, as measured by cash and cash equivalents on hand and availability under our debt facility; • Primarily through a $112.3 million equity offering, as well as our net income for the year we increased total stockholders equity from $76.8 million at December 31, 2002 to $249.9 million at December 31, 2003; • Cash flow generated from operations was approximately $73.8 million in 2003 compared to $69.6 million in December 31, 2002. The 2002 amount included tax refunds of $38.6 million. Excluding the effect of the 2002 tax refunds, our cash flow from operations in 2003 was $42.8 million higher than 2002; and page 13
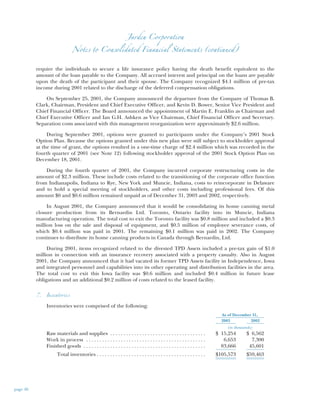
- 16. Jarden Corporation Management’s Discusson and Analysis (continued) • As of December 31, 2003, we had $125.4 million of cash and cash equivalents on hand and $64.9 million of availability under our debt facility. We are actively seeking acquisition opportunities in 2004 and would use such amounts plus cash generated from our operations and, if necessary, additional capital raised through financing activities, to finance any such acquisitions. We intend the discussion of our financial condition and results of operations, including our acquisition and disposition activities, that follows to provide information that will assist in understanding our financial statements, the changes in certain key items in those financial statements from year to year, and the primary factors that accounted for those changes, as well as how certain accounting principles, policies and estimates affect our financial statements. Acquisitions and Disposition Activities We have grown through strategic acquisitions of complementary businesses and expanding sales of our existing brands. Our strategy to achieve future growth is to acquire new businesses or brands that complement our existing product portfolio, sustain profitable internal growth and expand our international business. On September 2, 2003, we acquired all of the issued and outstanding stock of Lehigh Consumer Products Corporation and its subsidiary (“Lehigh” and the “Lehigh Acquisition”). Lehigh is the largest supplier of rope, cord, and twine in the U.S. consumer marketplace and a leader in innovative storage and organization products and workshop accessories for the home and garage as well as in the security screen door and ornamental metal fencing market. The purchase price of the transaction was approximately $157.6 million, including transaction expenses. In addition, the Lehigh Acquisition includes an earn-out provision with a potential payment in cash or our common stock, at our sole discretion, of up to $25 million payable in 2006, provided that certain earnings performance targets are met. Lehigh is included in the branded consumables segment from September 2, 2003. On February 7, 2003, we completed our acquisition of the business of Diamond Brands International, Inc. and its subsidiaries (“Diamond Brands” and the “Diamond Acquisition”), a manufacturer and distributor of niche household products, including plastic cutlery, clothespins, kitchen matches and toothpicks under the Diamond® and Forster® trademarks. The purchase price of this transaction was approximately $91.5 million, including transaction expenses. The acquired plastic manufacturing operation is included in the plastic consumables segment in 2003 and the acquired wood manufacturing operation and branded product distribution business is included in the branded consumables segment in 2003. On April 24, 2002, we completed our acquisition of the business of Tilia International, Inc. and its subsidiaries (“Tilia” and the “Tilia Acquisition”). We acquired the business of Tilia for approximately $145 million in cash and $15 million in seller debt financing. In addition, the Tilia Acquisition includes an earn-out provision with a potential payment in cash or our common stock, at our sole discretion, of up to $25 million payable in 2005, provided that certain earnings performance targets are met. Pro forma financial information relating to the Tilia Acquisition, the Diamond Acquisition and the Lehigh Acquisition has been included in the Consolidated Financial Statements herein. We also completed two tuck-in acquisitions in 2003. In the fourth quarter of 2003, we completed our acquisition of the VillaWare Manufacturing Company (“VillaWare”). VillaWare’s results are included in the consumer solutions segment from October 3, 2003. In the second quarter of 2003, we completed our acquisition of O.W.D., Incorporated and Tupper Lake Plastics, Incorporated (collectively “OWD”). The branded product distribution operation acquired in the OWD acquisition is included in the page 14
- 17. Jarden Corporation Management’s Discusson and Analysis (continued) branded consumables segment from April 1, 2003. The plastic manufacturing operation acquired in the OWD acquisition is included in the plastic consumables segment from April 1, 2003. The results of VillaWare and OWD did not have a material effect on our results for the year ended December 31, 2003 and are not included in the pro forma financial information presented in Item 8. Financial Statements and Supplementary Data. Effective November 26, 2001, we sold the assets of our Triangle, TriEnda and Synergy World plastic thermoforming operations (“TPD Assets”) to Wilbert, Inc. for $21.0 million in cash, a non-interest bearing one-year note (“Wilbert Note”) as well as the assumption of certain identified liabilities. The Wilbert Note of $1.6 million was repaid on November 25, 2002. In connection with this sale, we recorded a pre-tax loss of approximately $121.1 million in 2001. The proceeds from the sale were used to pay down our term debt under a previous credit agreement. Effective November 1, 2001, we sold our majority interest in Microlin, LLC (“Microlin”), a developer of proprietary battery and fluid delivery technology, for $1,000 in cash plus contingent consideration based upon future performance through December 31, 2012 and the cancellation of future funding requirements. We recorded a pretax loss of $1.4 million in 2001 related to the sale. Non-GAAP Measures Net income and diluted earnings per share, excluding a non-cash restricted stock charge and a net release of our tax valuation allowance, are non-GAAP financial measures and they are presented in the “Results of Operations” sections below because these measures form the basis upon which our management has assessed the Company’s financial performance in the years presented. Additionally, under our credit agreement the non-cash restricted stock charge is excluded in certain calculations used for determining whether we are in compliance with certain credit agreement covenants. These calculations are measures of our performance that are not required by, or presented in accordance with generally accepted accounting principles in the United States (“GAAP”). As such, these measures should not be considered as alternatives to net income or diluted earnings per share in accordance with GAAP. Reconciliations of the non-GAAP financial measures to the most directly comparable GAAP financial measures have been presented within the “Results of Operations” sections below. Results of Operations —Comparing 2003 to 2002 We reported net sales of $587.4 million in 2003, a 60.0% increase from net sales of 367.1 million in 2002. In 2003, our branded consumables segment reported net sales of $257.9 million compared to $111.2 million in 2002. This increase of 131.8% was principally the result of the Diamond Acquisition, effective February 1, 2003, and the Lehigh Acquisition, effective September 2, 2003. In addition, the acquisition of OWD in the second quarter of 2003, contributed to this increase. Excluding the effect of acquisitions, net sales for our branded consumables segment in 2003 were comparable to 2002. Our consumer solutions segment reported net sales of $215.8 million compared to $145.3 million in net sales in 2002. This increase of 48.5% was principally the result of this segment being acquired in April 2002 and, therefore, net sales for 2003 reflect sales for the full year but net sales for 2002 reflect sales for only nine months of the year. Additionally, the acquisition of VillaWare in the fourth quarter of 2003 contributed to this increase. Furthermore, the year-on-year increase is a result of organic U.S. retail and international sales growth of over 10% for this segment in the last three quarters of 2003 compared to the same period in 2002. page 15
- 18. Jarden Corporation Management’s Discusson and Analysis (continued) In 2003, our plastic consumables segment reported net sales of $109.1 million compared to $70.6 million in 2002. The principal reason for this increase of 54.5% was intercompany sales generated by the addition of the plastic manufacturing business acquired in the Diamond Acquisition. In addition, the intercompany sales resulting from the OWD acquisition in the second quarter of 2003 also contributed to this increase. Excluding intercompany sales, net sales for the plastic consumables segment increased slightly in 2003 due to higher sales volumes with a number of customers, partially offset by the loss of sales to one large customer and a contractual sales price reduction with another large customer. In 2003, our other segment reported net sales of $42.8 million compared to $41.0 million in 2002. The principal reason for this increase of 4.3% was an increase in sales to a major customer as a result of a contractual change whereby this segment took on the responsibility of purchasing the raw material inventory for the customer. We reported operating earnings of $71.5 million in 2003 compared to operating earnings of $65.1 million in 2002. This increase of $6.4 million, or 9.7%, occurred despite the 2003 operating earnings being negatively impacted, as a result of a non-cash restricted stock charge of approximately $21.8 million. Excluding this non-cash restricted stock charge, operating earnings would have been $93.3 million in 2003 or $28.2 million higher than 2002. The principal reason for this increase of 43.3%, was that the branded consumables segment’s operating earnings increased by $18.5 million from 2002 to 2003, due to the addition of the acquired Diamond Brands and Lehigh product lines, as well as an increase in organic operating earnings due to a favorable home canning sales mix resulting from increased sales of premium products. Also, the operating earnings of the consumer solutions segment increased by $10.9 million, principally due to (i) the acquisition of this business in April 2002; (ii) the acquisition of VillaWare in the fourth quarter of 2003 and (iii) increased organic net sales of over 10% in the final three quarters of 2003 relative to the comparable prior year periods, partially offset by increased litigation costs arising from an action that we are taking against certain competitors who we believe have infringed on our intellectual property. Operating earnings in 2003 for our plastic consumables segment were approximately $0.5 million higher than the same period in the prior year due to the earnings effect from the intercompany sales, partially offset by lower gross margins resulting from the changes in net sales discussed above. Operating earnings in 2003 for our other segment were $0.8 million lower compared to the same period in the prior year due to a greater amount of net sales having lower gross margins principally due to the contractual change with one major customer as discussed above. Gross margin percentages on a consolidated basis decreased to 38.3% in 2003 from 41.0% in 2002. The primary reason for these lower gross margins is the addition of the relatively lower gross margin Diamond Brands and Lehigh product lines. This effect is partially offset by the benefit of including the higher gross margins of the acquired consumer solutions business for the full year in 2003 but only nine months of the year in 2002. Selling, general and administrative expenses increased to $131.7 million in 2003 from $85.4 million in 2002, or, as a percentage of net sales, decreased to 22.4% in 2003 from 23.3% in 2002. The increase in dollar terms was principally the result of the acquisitions completed during 2003 and 2002. Also, the selling, general and administrative expenses increased, in part, due to higher marketing expenditures and legal costs. The decrease in percentage terms was principally due to the addition of the Diamond Brands and Lehigh product lines, which have relatively lower selling, general and administrative expenses as a percentage of net sales compared to those of our consumer solutions segment. During the fourth quarter of 2003, we recorded a non-cash restricted stock charge of approximately $21.8 million relating to the lapsing of restrictions over restricted stock issuances to certain officers. We received a tax deduction for this non-cash restricted stock charge. page 16
- 19. Jarden Corporation Management’s Discusson and Analysis (continued) Net interest expense increased to $19.2 million in 2003 compared to $12.6 million in 2002. This increase resulted from higher levels of outstanding debt in 2003 compared to the same period in 2002, principally due to (i) the principal on the $150 million of our 9 3⁄4% senior subordinated notes (“Notes”) issued in connection with the Tilia Acquisition being outstanding for the entire twelve months of 2003 as compared to only nine months of 2002, (ii) the additional respective financings in 2003 in connection with the Diamond Acquisition and the Lehigh Acquisition, and (iii) the issuance of an additional $30 million principal amount of Notes in 2003. Our weighted average interest rate in 2003 of 6.2% was lower than our weighted average interest rate of 7.0% in 2002. Our effective tax rate in 2003 was 39.2% compared to an effective tax rate of 30.8% in 2002. At December 31, 2001, we had federal net operating losses that were recorded as a deferred tax asset with a valuation allowance of $5.4 million. Due to the impact of the Job Creation Act and the tax refunds that we received as a result, a net $4.4 million of this valuation allowance was released in 2002 resulting in an income tax provision of $16.2 million. Excluding the release of this valuation allowance our effective tax rate would also have been approximately 39.2% in 2002. Net income in 2003 increased 41% to $45.1 million, or $1.91 per diluted share, excluding the non- cash restricted stock charge and related tax benefit discussed above, compared to net income in 2002 of $31.9 million, or $1.48 per diluted share, which excludes the tax benefit resulting from the net release of the $4.4 million valuation allowance that is also discussed above. The reconciliation of these non-GAAP financial measures to the most directly comparable GAAP financial measures is as follows: Year ended December 31, 2003 2002 (in thousands, except per share amounts) Net income . . . . . . . . . . . . . . . . . . . . . . . . . . . . . . . . . . . . . . . . . . . . . . . . . . . $31,778 $36,309 Add back: non-cash restricted stock charge, net of related tax benefit of $8,559 . . . . . . . . . . . . . . . . . . . . . . . . . . . . . . . . . . . . . . . . . . . . . . . . . . . . . 13,274 — Less: net release of tax valuation allowance . . . . . . . . . . . . . . . . . . . . . . . . . — (4,395) Net income, excluding non-cash restricted stock charge and related tax benefit and net release of tax valuation allowance . . . . . . . . . . . . . . . . . $45,052 $31,914 Diluted earnings per share, excluding non-cash restricted stock charge and related tax benefit and net release of tax valuation allowance . . . . $ 1.91 $ 1.48 Results of Operations – Comparing 2002 to 2001 We reported net sales of $367.1 million in 2002, an increase of 20.6% from net sales of $304.3 million in 2001. From April 1, 2002 until December 31, 2002, our consumer solutions segment, which consisted of the newly acquired Tilia business, generated net sales of $145.3 million. Our branded consumables segment reported net sales of $111.2 million in 2002 compared to $119.9 million in 2001. Net sales were $8.7 million or 7.3% lower than 2001, principally due to severe drought weather conditions during summer 2002 in the South, Southeast and West Central regions of the United States. Our plastic consumables segment reported net sales of $70.6 million in 2002 compared to $139.9 million in 2001. The principal cause of the $69.3 million decrease was the divestiture of the TPD Assets and Microlin, which accounted for $63.3 million of such change (after adjusting for $1.2 million of intercompany sales to these businesses). The remaining $6.0 million is principally due to lower tooling page 17
- 20. Jarden Corporation Management’s Discusson and Analysis (continued) sales and a contractual sales price reduction to a significant customer. In our other segment, net sales decreased to $41.0 million in 2002 from $45.5 million in 2001, primarily due to a reduction in sales to the United States Mint in connection with its inventory reduction program for all coinage. We reported operating income of $65.1 million for 2002. These results compare to an operating loss of $113.9 million for 2001, which included special charges and reorganization expenses of $5.0 million and a loss on divestitures of assets and product lines of $122.9 million. All of our segments generated increases in operating income in 2002 from 2001, with the exception of the other segment, which had a small decrease but still maintained a constant operating income percentage of net sales in 2002. From April 1, 2002 until December 31, 2002, our consumer solutions segment, which consists of the acquired Tilia business, generated operating income of $31.7 million. Operating income for our branded consumables and plastic consumables segments increased by $4.7 million and $14.4 million, respectively, in 2002 compared to 2001. The other factors that contributed to these favorable operating income results are discussed in the following two paragraphs. Gross margin percentages on a consolidated basis increased to 41.0% in 2002 from 23.5% in 2001, reflecting the higher gross margins of the acquired home vacuum packaging business in 2002, the lower gross margins of the disposed TPD Assets and Microlin businesses which were disposed in 2001, a $1.5 million charge for slow moving inventory in the branded consumables segment in 2001 and cost efficiency increases in our plastic consumables segment. These increases were partially offset by lower gross margins in the branded consumables segment caused by the lower sales volume. Selling, general and administrative expenses increased to $85.4 million in 2002 from $52.6 million in 2001, or, as a percentage of net sales increased to 23.3% in 2002 from 17.3% in 2001. This increase was principally due to the acquisition of the home vacuum packaging business, which accounted for an additional $46.3 million of selling, general and administrative expenses, and because of company-wide increased performance-based compensation expenses related to our strong financial performance in 2002. Partially offsetting this were decreases in selling, general and administrative expenses in our branded consumables, plastic consumables and other segments. Expenses within the branded consumables segment decreased due to lower selling expenses associated with the decrease in net sales discussed above. Expenses within our plastic consumables segment decreased primarily due to the divestiture of TPD Assets and Microlin, which accounted for $11.7 million of this decline, and lower expenses in the remaining business of the segment. We incurred net special charges and reorganization expenses of $5.0 million in 2001, consisting of $0.8 million in costs to exit facilities, $2.4 million in stock option compensation, $2.3 million in corporate restructuring costs, $2.6 million in separation costs for former executive officers and $1.4 million of costs to evaluate strategic options, partially offset by $4.1 million in pre-tax income related to the discharge of certain deferred compensation obligations and $0.4 million of income for items related to the divested TPD Assets. As a result of the adoption of SFAS No. 142, we did not record goodwill amortization in 2002. Goodwill amortization of approximately $5.2 million had been recorded in 2001. Net interest expense in 2002 was $12.6 million compared to $11.8 million for 2001, primarily due to the additional indebtedness assumed pursuant to the Tilia Acquisition, partially offset by the write-off in 2001 of $1.5 million of previously deferred debt issuance costs in November 2001 in conjunction with the amendment to our credit facility effected in connection with the TPD Assets sale. During 2002, we had a lower weighted average interest rate than the prior year, which was more than offset by higher average borrowings outstanding. page 18
- 21. Jarden Corporation Management’s Discusson and Analysis (continued) Our effective tax rate was 30.8% in 2002 compared to 32.2% in 2001. At December 31, 2001, we had federal net operating losses that were recorded as a deferred tax asset with a valuation allowance of $5.4 million. Due to the impact of the Job Creation Act and the tax refunds that we received as a result, a net $4.4 million of this valuation allowance was released in 2002 resulting in an income tax provision of $16.2 million. Our net income for 2002 would have been $31.9 million or $1.47 diluted earnings per share if this valuation allowance release was excluded as per the reconciliation shown in “Results of Operations – 2003 to 2002” above. Excluding the release of this valuation allowance, our effective tax rate was approximately 39.2% in 2002. The effective tax rate in 2001 was lower than the statutory federal rate due to the valuation allowance described above. Financial Condition, Liquidity and Capital Resources 2003 Activity During 2003, the following changes were made to our capital resources: • we completed a public offering of approximately 4.8 million shares of our common stock at $24.67 per share (stock-split adjusted), the proceeds from which, net of underwriting fees and related expenses, totaled approximately $112.3 million; • we amended and restated our existing senior credit facility (“Amended Credit Agreement”), which currently provides for a senior credit facility of up to $280 million of senior secured loans, consisting of a $70 million five-year revolving credit facility, a $60 million five-year term loan facility, and a new $150 million five-year term loan facility; • we issued an additional $30 million of Notes at a price of 106.5% of face value and received gross proceeds of approximately $32.0 million; • in conjunction with the timing of the issuance of the 9¾% senior subordinated notes, we entered into a $30 million interest rate swap to receive a fixed rate of interest and pay a variable rate of interest based upon London Interbank Offered Rate (“LIBOR”); • we issued an aggregate of 569,700 restricted shares of common stock under our 2003 Stock Incentive Plan; • approximately $5.2 million in loans to certain officers and accrued interest thereon were repaid in full by those officers with shares of our common stock; • we entered into a $37 million interest rate swap to receive a floating rate of interest and pay a fixed rate of interest; • we received $3.2 million of cash proceeds, including $1 million of accrued interest, for unwinding our $75 million interest rate swap and contemporaneously replacing it with a new $75 million interest rate swap; and • we repaid $10 million of seller debt financing. Specifically, on September 30, 2003, we completed a public offering (“Offering”) of approximately 4.8 million shares of our common stock at $24.67 per share. Proceeds from the Offering, net of underwriting fees and related expenses, totaled approximately $112.3 million. We currently intend to use the net proceeds for general corporate purposes, including, but not limited to, potential future acquisitions and debt repayment. Our Amended Credit Agreement does not require us to prepay debt with any of the net proceeds received from the Offering. page 19
- 22. Jarden Corporation Management’s Discusson and Analysis (continued) Our Amended Credit Agreement provides for up to $280 million of senior secured loans, consisting of a $70 million revolving credit facility, a $60 million term loan facility, and a newly issued $150 million term loan facility. The new term loan facility bears interest at a rate equal to (i) the Eurodollar Rate (as determined by the Administrative Agent) pursuant to an agreed formula or (ii) a Base Rate equal to the higher of (a) the Bank of America prime rate and (b) the federal funds rate plus 50%, plus, in each case, an applicable margin of 2.75% per annum for Eurodollar loans and 1.75% per annum for Base Rate loans. The pricing and principal of the revolving credit facility and the previously existing term loan did not change. The revolving credit facility continues to have a $15 million letters of credit sublimit and a $10 million swing line loans sublimit. On September 2, 2003, we drew down the full amount of the new $150 million term loan facility, which funds were used principally to pay the majority of the cash consideration for the Lehigh Acquisition. Our Amended Credit Agreement matures on April 24, 2008. The Amended Credit Agreement contains certain restrictions on the conduct of our business, including, among other things restrictions, generally, on: • incurring debt; • disposing of certain assets; • making investments; • exceeding certain agreed upon capital expenditures; • creating or suffering liens; • completing certain mergers; • consolidations and sales of assets and, with permitted exceptions, acquisitions; • declaring dividends; • redeeming or prepaying other debt; and • certain transactions with affiliates. The Amended Credit Agreement also includes financial covenants that require us to maintain certain leverage and fixed charge ratios and a minimum net worth. As of December 31, 2003, we had $199.6 million outstanding under the term loan facilities and no outstanding amounts under the revolving credit facility of the Amended Credit Agreement. As of December 31, 2003, our weighted average interest rate on this outstanding amount was 4.0%. As of December 31, 2003, net availability under the revolving credit facility was approximately $64.9 million, after deducting $5.1 million of issued letters of credit. We are required to pay commitment fees on the unused balance of the revolving credit facility. On May 8, 2003, we issued an additional $30 million of Notes (bringing to a total $180 million of Notes issued and outstanding, including the 2002 issuance discussed below). The net proceeds of the offering were used to reduce the outstanding revolver balances under our senior credit facility. The Notes were issued at a price of 106.5% of face value and we received approximately $32.0 million in gross proceeds from the issuance. As a result of an exchange offer completed on December 2, 2003, all of the Notes are governed by an indenture, dated as of April 24, 2002, as supplemented (“April 2002 Indenture”). Significant terms of the Notes and the April 2002 Indenture are discussed under “2002 and 2001 Activity”. page 20
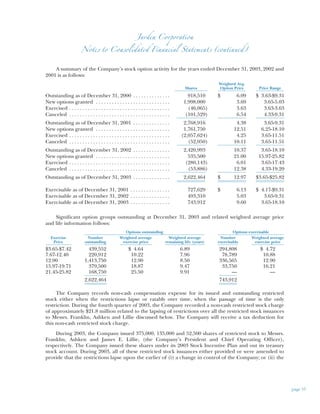
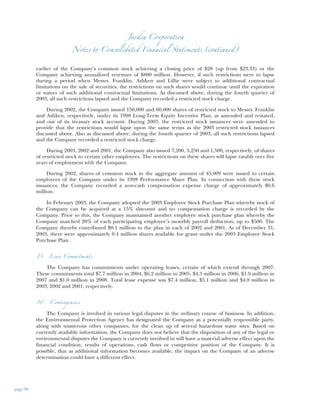
- 23. Jarden Corporation Management’s Discusson and Analysis (continued) On May 6, 2003, we entered into a $30 million interest rate swap (“New Swap”) to receive a fixed rate of interest and pay a variable rate of interest based upon LIBOR. The New Swap is a swap against our Notes. We record non-cash compensation expense for our issued and outstanding restricted stock either when the restrictions lapse or ratably over time, when the passage of time is the only restriction. During the fourth quarter of 2003, we recorded a non-cash restricted stock charge of approximately $21.8 million related to the lapsing of restrictions over all the restricted stock issuances to Messrs. Martin E. Franklin (our Chairman and Chief Executive Officer), Ian G.H. Ashken (our Vice-Chairman and Chief Financial Officer) and James E. Lillie (our President and Chief Operating Officer), discussed immediately below and in “2002 and 2001 Activity” also below. We will receive a tax deduction for this non-cash restricted stock charge. During 2003, we issued 375,000, 135,000 and 52,500 shares of restricted stock to Messrs. Franklin, Ashken and Lillie, respectively. We issued these shares under our 2003 Stock Incentive Plan and out of our treasury stock account. During 2003, all of these restricted stock issuances either provided or were amended to provide that the restrictions lapse upon the earlier of (i) a change in control; or (ii) the earlier of our common stock achieving a closing price of $28 (up from $23.33) or us achieving annualized revenues of $800 million. However, if such restrictions were to lapse during a period when Messrs. Franklin, Ashken and Lillie were subject to additional contractual limitations on the sale of securities, the restrictions on such shares would continue until the expiration or waiver of such additional contractual limitations. As discussed above, during the fourth quarter of 2003, all such restrictions lapsed which resulted in a restricted stock charge. During 2003, we also issued 7,200 shares of restricted stock to certain other employees. The restrictions on these shares will lapse ratably over five years of employment with us. In January 2002, Messrs. Franklin and Ashken exercised 900,000 and 450,000 non-qualified stock options, respectively, which had been granted under our 2001 Stock Option Plan. These shares were issued out of our treasury stock account. The exercises were accomplished via loans from us under our Executive Loan Program. The principal amounts of the loans were $3.3 million and $1.6 million, respectively, and bore interest at 4.125% per annum. The loans were due on January 23, 2007 and were classified within the stockholders’ equity section. The loans could be repaid in cash, shares of our common stock, or a combination thereof. In February 2003, Mr. Ashken surrendered to us shares of our common stock to repay $0.3 million of his loan. On April 29, 2003, Messrs. Franklin and Ashken each surrendered to us shares of our common stock to repay in full all remaining principal amounts and accrued interest owed under their respective loans. We will not make any additional loans under the Executive Loan Program. Effective April 2, 2003, we entered into an interest rate swap that converted $37 million of floating rate interest payments under our term loan facility for a fixed obligation that carries an interest rate, including applicable margin, of 4.25% per annum. The swap has interest payment dates that are the same as the term loan facility and it matures on September 30, 2004. The swap is considered to be a cash flow hedge and is also considered to be an effective hedge against changes in the fair value of our floating-rate debt obligation for both tax and accounting purposes. Gains and losses related to the effective portion of the interest rate swap are reported as a component of other comprehensive income and will be reclassified into earnings in the same period that the hedged transaction affects earnings. In March 2003, we unwound a $75 million interest rate swap to receive a fixed rate of interest and pay a variable rate of interest based upon LIBOR and contemporaneously entered into a new $75 page 21
- 24. Jarden Corporation Management’s Discusson and Analysis (continued) million interest rate swap (“Second Replacement Swap”). Like the swap that it replaced, the Second Replacement Swap is a swap against our Notes. The Second Replacement Swap has a maturity date that is the same as the Notes. Interest is payable semi-annually in arrears on May 1 and November 1. We have accrued interest on the swap at an effective rate of 6.38%. In return for unwinding the swap, we received $3.2 million of cash proceeds. Of this amount, approximately $1 million of such proceeds related to accrued interest that was owed to us at such time. The remaining $2.2 million of proceeds is being amortized over the remaining life of the Notes as a credit to interest expense and the unamortized balances are included in our Consolidated Balance Sheet as an increase to the value of the long-term debt. We are exposed to credit loss in the event of non- performance by the other party to the Second Replacement Swap, a large financial institution, however, we do not anticipate non-performance by the other party. The fair market value of our interest rate swaps as of December 31, 2003 was against us in an amount of approximately $2.6 million and is included as a non-current liability in our Consolidated Balance Sheet, with a corresponding offset to long-term debt. During 2003, we repaid seller debt financing, incurred in connection with the Tilia Acquisition, in the principal amount of $10 million. The remaining seller debt financing consists of a non-interest bearing note in the principal amount of $5 million, bearing interest at 5%, which is due on April 24, 2004. In January 2003, we filed a shelf registration statement, which was declared effective by the Securities and Exchange Commission on January 31, 2003. This shelf registration statement was intended to facilitate our access to growth capital for future acquisitions and allowed us to sell over time up to $150 million of common stock, preferred stock, warrants, debt securities, or any combination of these securities in one or more separate offerings in amounts, at prices and on terms to be determined at the time of the sale. The equity offering completed in September 2003 and the $30 million of Notes issued in May 2003, were covered by our shelf registration statement and, in the aggregate, constituted the issuance of approximately $150 million in registered securities. Accordingly, no further issuances will be made under this registration statement. During 2003, we incurred costs in connection with the issuance of the Notes and the Amended Credit Agreement of approximately $5.9 million. 2002 and 2001 Activity In April 2002, in connection with the Tilia Acquisition we made an offering of $150 million of Notes to qualified institutional buyers in a private placement pursuant to Rule 144A under the Securities Act of 1933. The Notes were issued at a discount such that we received approximately $147.7 million in net proceeds. The Notes are scheduled to mature on May 1, 2012, however, on or after May 1, 2007, we can redeem all or part of the Notes at any time at a redemption price ranging from 100% to 104.875% of the principal amount, plus accrued and unpaid interest and liquidated damages, if any. Prior to May 1, 2005, we may redeem up to 35% of the aggregate principal amount of the Notes with the net cash proceeds from certain public equity offerings at a redemption price of 109.75% of the principal amount, plus accrued and unpaid interest and liquidated damages, if any. Interest on the Notes accrues at the rate of 9.75% per annum and was payable semi-annually in arrears on May 1 and November 1, with the first payment having occurred on November 1, 2002. The April 2002 Indenture governing the Notes also contains certain restrictions on the conduct of our business. Prior to the new Amended Credit Agreement, we entered into a credit agreement in connection with the Tilia Acquisition (“Old Credit Agreement”). The Old Credit Agreement was scheduled to page 22
- 25. Jarden Corporation Management’s Discusson and Analysis (continued) mature on April 24, 2007. The revolving credit facility and the term loan facility bore interest at a rate equal to (i) the Eurodollar Rate pursuant to an agreed formula or (ii) a Base Rate equal to the higher of (a) the Bank of America prime rate and (b) the federal funds rate plus .50%, plus, in each case, an applicable margin ranging from 2.00% to 2.75% for Eurodollar Rate loans and from .75% to 1.5% for Base Rate loans. The Old Credit Agreement contained restrictions on the conduct of our business similar to the Amended Credit Agreement. The Old Credit Agreement was replaced by the Amended Credit Agreement. Until it was replaced by the Old Credit Agreement on April 24, 2002, our senior credit facility, as amended provided for a revolving credit facility of $40 million and a term loan which amortized periodically as required by the terms of the agreement. Interest on borrowings under the term loan and the revolving credit facilities were based upon fixed increments over adjusted LIBOR or the agent bank’s alternate borrowing rate as defined in the agreement. The agreement also required the payment of commitment fees on the unused balance. During the first quarter of 2002, approximately $38 million of tax refunds we received were used to repay a portion of the outstanding amounts under this credit agreement. In conjunction with the Notes, on April 24, 2002, we entered into a $75 million interest rate swap (“Initial Swap”) to receive a fixed rate of interest and pay a variable rate of interest based upon LIBOR. The Initial Swap had a maturity date that was the same as the Notes. Interest was payable semi-annually in arrears on May 1 and November 1, commencing on November 1, 2002. The initial effective rate of interest that we established on this swap was 6.05%. Effective September 12, 2002, we entered into an agreement, whereby we unwound the Initial Swap and contemporaneously entered into a new $75 million interest rate swap (“First Replacement Swap”). The First Replacement Swap had the same terms as the Initial Swap, except that we were required to pay a variable rate of interest based upon 6 month LIBOR in arrears. The spread on this contract was 470 basis points. Based upon this contract, we paid an effective interest rate of 6.32% on November 1, 2002. In return for unwinding the Initial Swap, we received $5.4 million in cash proceeds, of which $1 million related to accrued interest that was owed to us. The remaining $4.4 million of proceeds is being amortized over the remaining life of the Notes as a credit to interest expense and is included in our consolidated balance sheet as an increase to the value of the long-term debt. Such amortization amount offsets the increased effective rate of interest that we pay on the Second Replacement Swap. The First Replacement Swap was superceded by the Second Replacement Swap, as discussed above. All of our swaps have been and, where applicable, are considered to be effective hedges against changes in the fair value of our fixed-rate debt obligation for both tax and accounting purposes. During 2002, we issued 150,000 and 60,000 shares of restricted stock to Messrs. Franklin and Ashken, respectively, under our 1998 Long-Term Equity Incentive Plan, as amended and restated, and out of our treasury stock account. During 2003, the restricted stock issuances were amended to provide that the restrictions would lapse upon the same terms as the 2003 restricted stock issuances discussed in “2003 Activity” above. Also, as discussed in “2003 Activity” above, during the fourth quarter of 2003 all such restrictions lapsed and we recorded a restricted stock charge. During 2002 and 2001, we also issued 5,250 and 1,500, respectively, of shares of restricted stock to certain other employees. The restrictions on these shares will lapse ratably over five years of employment with us. During 2002, we incurred costs in connection with the issuance of the Notes and the Old Credit Agreement of approximately $7.4 million. page 23
- 26. Jarden Corporation Management’s Discusson and Analysis (continued) Working Capital Working capital (defined as current assets less current liabilities) increased to approximately $242.0 million at December 31, 2003, from approximately $101.6 million at December 31, 2002, due primarily to: • the working capital of our acquired businesses; and • increased cash on hand amounts caused by the equity offering, our favorable operating results and the new financing relationships discussed above, being only partially offset by amounts used to fund our 2003 acquisitions. Cash Flows from Operations Cash flow generated from operations was approximately $73.8 million for the year ended December 31, 2003 compared to $69.6 million for the year ended December 31, 2002. The 2002 amount included tax refunds of $38.6 million. Excluding the effect of the 2002 tax refunds, our cash flow from operations in 2003 was $42.8 million higher than 2002. This increase was principally due to an increase in net income, excluding the non-cash restricted stock charge, of $17.4 million in 2003 compared to 2002 and lower working capital movements in 2003. Our statement of cash flows is prepared using the indirect method. Under this method, net income is reconciled to cash flows from operating activities by adjusting net income for those items that impact net income but do not result in actual cash receipts or payments during the period. These reconciling items include depreciation and amortization, changes in deferred tax items, non-cash compensation, non-cash interest expense, charges in reserves against accounts receivable and inventory and changes in the balance sheet for working capital from the beginning to the end of the period. Capital Expenditures Capital expenditures were $12.8 million in 2003 compared to $9.3 million for 2002 and are largely related to installing a new information system for our consumer solutions segment, maintaining facilities, tooling projects, improving manufacturing efficiencies, other new information systems and a portion of the costs of the installation of new packaging lines for the branded consumables segment. As of December 31, 2003, we had capital expenditure commitments in the aggregate for all our segments of approximately $2.2 million, of which $0.8 million related to the completion of the new packaging lines for the branded consumables segment. Cash and Financing Availability We believe that our cash and cash equivalents on hand, cash generated from our operations and our availability under our senior credit facility is adequate to satisfy our working capital and capital expenditure requirements for the foreseeable future. However, we may raise additional capital from time to time to take advantage of favorable conditions in the capital markets or in connection with our corporate development activities. page 24
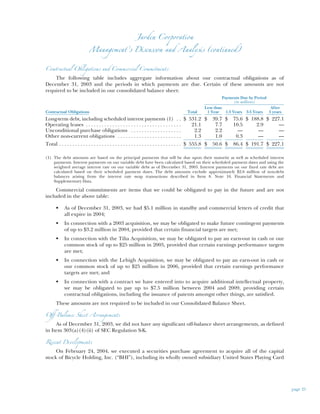
- 27. Jarden Corporation Management’s Discusson and Analysis (continued) Contractual Obligations and Commercial Commitments The following table includes aggregate information about our contractual obligations as of December 31, 2003 and the periods in which payments are due. Certain of these amounts are not required to be included in our consolidated balance sheet: Payments Due by Period (in millions) Less than After Contractual Obligations Total 1 Year 1-3 Years 3-5 Years 5 years Long-term debt, including scheduled interest payments (1) . . $ 531.2 $ 39.7 $ 75.6 $ 188.8 $ 227.1 Operating leases . . . . . . . . . . . . . . . . . . . . . . . . . . . . . . . . . . . . 21.1 7.7 10.5 2.9 — Unconditional purchase obligations . . . . . . . . . . . . . . . . . . . 2.2 2.2 — — — Other non-current obligations . . . . . . . . . . . . . . . . . . . . . . . . 1.3 1.0 0.3 — — Total . . . . . . . . . . . . . . . . . . . . . . . . . . . . . . . . . . . . . . . . . . . . . . $ 555.8 $ 50.6 $ 86.4 $ 191.7 $ 227.1 (1) The debt amounts are based on the principal payments that will be due upon their maturity as well as scheduled interest payments. Interest payments on our variable debt have been calculated based on their scheduled payment dates and using the weighted average interest rate on our variable debt as of December 31, 2003. Interest payments on our fixed rate debt are calculated based on their scheduled payment dates. The debt amounts exclude approximately $2.6 million of non-debt balances arising from the interest rate swap transactions described in Item 8. Note 16. Financial Statements and Supplementary Data. Commercial commitments are items that we could be obligated to pay in the future and are not included in the above table: • As of December 31, 2003, we had $5.1 million in standby and commercial letters of credit that all expire in 2004; • In connection with a 2003 acquisition, we may be obligated to make future contingent payments of up to $3.2 million in 2004, provided that certain financial targets are met; • In connection with the Tilia Acquisition, we may be obligated to pay an earn-out in cash or our common stock of up to $25 million in 2005, provided that certain earnings performance targets are met; • In connection with the Lehigh Acquisition, we may be obligated to pay an earn-out in cash or our common stock of up to $25 million in 2006, provided that certain earnings performance targets are met; and • In connection with a contract we have entered into to acquire additional intellectual property, we may be obligated to pay up to $7.5 million between 2004 and 2009, providing certain contractual obligations, including the issuance of patents amongst other things, are satisfied. These amounts are not required to be included in our Consolidated Balance Sheet. Off-Balance Sheet Arrangements As of December 31, 2003, we did not have any significant off-balance sheet arrangements, as defined in Item 303(a)(4)(ii) of SEC Regulation S-K. Recent Developments On February 24, 2004, we executed a securities purchase agreement to acquire all of the capital stock of Bicycle Holding, Inc. (“BHI”), including its wholly owned subsidiary United States Playing Card page 25
- 28. Jarden Corporation Management’s Discusson and Analysis (continued) Company (“USPC”), a privately held leading producer and distributor of premium playing cards, including the Bee®, Bicycle®, Aviator® and Hoyle® brands, for approximately $232 million. The transaction is expected to close by the third quarter of 2004, subject to Hart-Scott-Rodino approval, gaming industry related regulatory approvals, BHI shareholder execution and approval and other conditions. USPC is the largest manufacturer and distributor of playing cards, children’s card games, collectible tins, puzzles and card accessories for the North American retail market and through its subsidiaries, including USPC, BHI is the largest supplier of premium playing cards to casinos worldwide. It is anticipated that we will purchase not less than 75% of the capital stock of BHI at closing and that the remainder of the capital stock will be purchased according to the terms of a put/call agreement within one year of closing. In addition to the purchase price, the agreement includes an earn-out provision with a total potential payment in cash or our common stock of up to $10 million based on achieving future growth targets. If paid, we expect to capitalize the cost of the earn-out. No assurances can be given that the acquisition of BHI will be consummated or, if such acquisition is consummated, as to the final terms of such acquisition. The foregoing summary description of the purchase agreement, the put/call agreement and the transactions contemplated thereby are not intended to be complete and are qualified in their entirety by the complete texts of the purchase agreement and the put/call agreement. Critical Accounting Policies Our financial statements are prepared in accordance with accounting principles generally accepted in the United States, which require us to make judgments, estimates and assumptions that affect the amounts reported in the financial statements and accompanying notes. The following list of critical accounting policies is not intended to be a comprehensive list of all our accounting policies. Our significant accounting policies are more fully described in Note 1 to the Consolidated Financial Statements. The following represents a summary of our critical accounting policies, defined as those policies that we believe are the most important to the portrayal of our financial condition and results of operations, and/or require management’s significant judgments and estimates: Revenue recognition and allowances for product returns We recognize revenue when title transfers. In most cases, title transfers at the time product is shipped to customers. We allow customers to return defective or damaged products as well as certain other products for credit, replacement, or exchange. Our revenue is recognized as the net amount to be received after deducting estimated amounts for product returns, discounts, and allowances. We estimate future product returns based upon historical return rates and our judgment. If these estimates do not properly reflect future returns, they could be revised. Allowance for accounts receivable We maintain an allowance for doubtful accounts for estimated losses that may result from the inability of our customers to make required payments. That estimate is based on historical collection experience, current economic and market conditions, and a review of the current status of each customer’s trade accounts receivable. If the financial condition of our customers were to deteriorate or our judgment regarding their financial condition was to change negatively, additional allowances may be required resulting in a charge to income in the period such determination was made. Conversely, if the financial condition of our customers were to improve or our judgment regarding their financial condition was to change positively, a reduction in the allowances may be required resulting in an increase in income in the period such determination was made. page 26
- 29. Jarden Corporation Management’s Discusson and Analysis (continued) Allowance for inventory obsolescence We write down our inventory for estimated obsolescence or unmarketable inventory equal to the difference between the cost of the inventory and the estimated market value based upon assumptions about future demand and market conditions. If actual market conditions are less favorable than those projected by us, additional inventory write-downs may be required resulting in a charge to income in the period such determination was made. Conversely, if actual market conditions are more favorable than those projected by us, a reduction in the write down may be required resulting in an increase in income in the period such determination was made. Deferred tax assets We record a valuation allowance to reduce our deferred tax assets to the amount that we believe is more likely than not to be realized. While we have considered future taxable income and ongoing prudent and feasible tax planning strategies in assessing the need for the valuation allowance, in the event we were to determine that we would not be able to realize all or part of our net deferred tax assets in the future, an adjustment to the deferred tax assets would be charged to income in the period such determination was made. Likewise, should we determine that we would be able to realize our deferred tax assets in the future in excess of our net recorded amount, an adjustment to the deferred tax assets would increase income in the period such determination was made. Intangible assets We have significant intangible assets on our balance sheet that include goodwill, trademarks and other intangibles fair valued in conjunction with acquisitions. The valuation and classification of these assets and the assignment of amortizable lives involves significant judgments and the use of estimates. The testing of these intangibles under established guidelines for impairment also requires significant use of judgment and assumptions (such as cash flows, terminal values and discount rates). Our assets are tested and reviewed for impairment on an ongoing basis under the established accounting guidelines. Changes in business conditions could potentially require adjustments to these asset valuations. Contingencies We are involved in various legal disputes in the ordinary course of business. In addition, the Environmental Protection Agency has designated our Company as a potentially responsible party, along with numerous other companies, for the clean up of several hazardous waste sites. Based on currently available information, we do not believe that the disposition of any of the legal or environmental disputes our Company is currently involved in will require material capital or operating expenditures or will otherwise have a material adverse effect upon the financial condition, results of operations, cash flows or competitive position of our Company. It is possible, that as additional information becomes available, the impact on our Company of an adverse determination could have a different effect. New Accounting Pronouncements In April 2002, the Financial Accounting Standards Board (“FASB”) issued Statements of Financial Accounting Standards (“SFAS”) No. 145, Recision of SFAS Nos. 4, 44 and 64, Amendment of SFAS No. 13, and Technical Corrections as of April 2000. SFAS No. 145 revises the criteria for classifying the extinguishment of debt as extraordinary and the accounting treatment of certain lease modifications. SFAS No. 145 was effective in fiscal 2003 and did not have a material impact on our consolidated page 27


