Location via proxy:   [ UP ]  
[Report a bug]   [Manage cookies]                
SlideShare a Scribd company logo
Third Quarter
    Earnings Release

      October 19, 2006


                         3Q 2006 Earnings Release
1
                                 October 19, 2006
Forward Looking Statements
    This report contains “forward-looking statements” within the meaning of Section
    21E of the Securities Exchange Act of 1934. All statements, other than
    statements of fact, that address activities, events or developments that we or
    our management intend, expect, project, believe or anticipate will or may occur
    in the future are forward-looking statements. Forward-looking statements are
    based on management’s assumptions and assessments in light of past
    experience and trends, current conditions, expected future developments and
    other relevant factors. They are not guarantees of future performance, and
    actual results, developments and business decisions may differ from those
    envisaged by our forward-looking statements. Our forward-looking statements
    are also subject to risks and uncertainties, which can affect our performance in
    both the near- and long-term. We identify the principal risks and uncertainties
    that affect our performance in our Form 10-K and other filings with the
    Securities and Exchange Commission.


                                                                             3Q 2006 Earnings Release
2
                                                                                     October 19, 2006
3Q Overview
    • Financial Performance
           –    15% Sales Growth, 9% Organic Growth
           –    Segment Profit up 19%
           –    22% EPS Growth, 36% Adjusted (1) EPS Growth
           –    $634M Free Cash Flow, $1.5B YTD
    • Business Highlights
           –    AERO – Sales Strong, New Wins (Business Jets, Orion)
           –    ACS – 11% Organic Growth, Continued Execution
           –    TS – Turbo Favorable, CPG Consumer Impact
           –    SM – 9% Organic Growth, UOP Strength

    • Cash Deployment
           – Repurchased 5M Shares; Average Fully Diluted Share Count 821M

    • 2006 EPS Guidance $2.51 – 2.53, High End of Range

                                 Continued Growth And Execution
    (1) Reflects 3Q05 Income from Discontinued Operations ($0.04) and 3Q06 FAS 123R stock option expense ($0.02)   3Q 2006 Earnings Release
3
                                                                                                                           October 19, 2006
3Q Financials

                                                                3Q05                        3Q06
     (M)


     Sales                                                       $6,900                     $7,952            • 15% Growth
                                                                                                                   6% Acq./Div.
                                                                                                                   9% Organic
                                                                                                                      1% F/X Impact

     Segment Profit                                               $867                      $1,029            • 19% Growth
      - Margin %                                                  12.6%                      12.9%            • +30 bps

     EPS, Reported                                                $0.54                      $0.66            • 22% Growth

        EPS, Adjusted (1)                                                                                     • 36% Growth
                                                                   $0.50                      $0.68


     Free Cash Flow                                               $543                       $634             • 117% Conversion

    (1) Reflects 3Q05 Income from Discontinued Operations ($0.04) and 3Q06 FAS 123R stock option expense ($0.02)


                                  Strong Financial Performance
                                                                                                                             3Q 2006 Earnings Release
4
                                                                                                                                     October 19, 2006
Aerospace
    (M)
                      3Q05            3Q06                Financial Highlights

                                              • Sales up 9%
    Sales            $2,620         $2,854
                                                  No F/X Impact
                                              • Air Transport & Regional up 10%
    Segment           $429            $501
                                                  OE up 13%
     Profit
                                                  AM up 8%
    Margin            16.4%           17.6%   • Business & General Aviation up 13%
                                                  OE up 22%
                                                  AM up 5%
                Business Highlights
                                              • Defense & Space up 6%
    + New Wins – Business Jets, Orion
                                              • Segment Profit up 17%
    + Commercial OE up 17%
                                                  120 bps margin expansion
    + Commercial AM up 7%
                                                   + Volume growth / price
    + Defense up 9%, Space recovery
                                                   + Benefit from 3Q05 reorganization
    + Engineering spend / funding on track
                                                   – Inflation
    – Commercial mix, stronger OE                  – Mix, stronger OE


                                      Great Quarter
                                                                                  3Q 2006 Earnings Release
5
                                                                                          October 19, 2006
Automation And Control Solutions
    (M)
                     3Q05            3Q06                    Financial Highlights

                                                • Sales up 16%
    Sales            $2,445          $2,844
                                                    Organic 11%; Acq./Div. 5%
    Segment           $300           $330               F/X Impact 2%
     Profit                                     • Products up 16%
                                                • Solutions up 16%
    Margin           12.3%           11.6%


              Business Highlights               • Segment Profit up 10%
                                                    70 bps margin contraction
    + Products 10% organic growth
                                                     + Volume growth
    + Solutions 14% organic growth
                                                     + Productivity actions
    + Solutions orders up +20%                       – Inflation
                                                     – Mix
    + First Technology / Gardiner performance
                                                     – Acquisitions/ERP


     Strong Organic Growth And Continued Execution
                                                                                    3Q 2006 Earnings Release
6
                                                                                            October 19, 2006
Transportation Systems
     (M)
                        3Q05           3Q06                      Financial Highlights

                                                       • Sales up 5%
    Sales               $1,061         $1,111
                                                            F/X Impact 3%
    Segment              $121            $129          • Turbo up 10%
     Profit                                            • CPG down 1%
                                                            Consumer spending impact
    Margin               11.4%         11.6%
                                                            Friction NA OE exit
                   Business Highlights
    + HTT platform wins (Diesel, Gasoline)             • Segment Profit up 7%
                                                           20 bps margin expansion
    + HTT Europe demand as expected
                                                            + Productivity actions
           Diesel penetration up, LV production down
                                                            + Turbo volume growth
    + Class 8, ahead of YE emissions change
                                                            – Inflation
    + Asia growth, new product introductions
                                                            – CPG volume
    – CPG market conditions


        Winning New Business And Driving Productivity
                                                                                        3Q 2006 Earnings Release
7
                                                                                                October 19, 2006
Specialty Materials
    (M)
                     3Q05            3Q06                     Financial Highlights

                                                  • Sales up 48%
    Sales             $773           $1,143
                                                      Organic 9%; Acq./Div. 39%
    Segment              $58            $110              No F/X Impact
     Profit                                       • Fluorine Products up 14%
                                                  • Specialty Products up 11%
    Margin            7.5%              9.6%
                                                  • Resins and Chemicals down 17%
                                                      Up 3% Excl. Sale of Carpet Fiber assets
               Business Highlights
                                                  • Segment Profit up 90%
    + UOP project wins
                                                      210 bps margin expansion
          3Q UOP timing impact as expected
                                                       + UOP acquisition
    + Specialty Products volume                        + Base business volume growth
                                                       – Partial plant outage
    + Price/Raws spread net favorable
    – Resins and Chemicals partial plant outage


              Organic Growth And UOP Performance
                                                                                       3Q 2006 Earnings Release
8
                                                                                               October 19, 2006
2006 Financial Summary
                                      2005      2006E         V’05
     (B)


                                      $27.6     ~$31.1         13%
     Sales
      Ex. Acquisitions/Divestitures                            6%


                                      $3.4       ~$4.1         20%
     Segment Profit
      - Margin %                      12.2%     ~13.2%       100 bps


                                      $1.92   $2.51 - 2.53   31 - 32%
     EPS, Reported


                                      $1.8       ~$2.2         25%
     Free Cash Flow
           Conversion                  107%      +100%


                            4Q06 Sales ~$8.0B
                             EPS $0.70 – 0.72
                                                                 3Q 2006 Earnings Release
9
                                                                         October 19, 2006
2007 Economic/Industry Outlook
     • Overall Outlook Favorable
       – Modest Softening in Global Economic Growth

       – Industry Specific Weakness (US Residential Construction, US Automotive)

       – Macro Trends (Safety, Security, Energy Efficiency, Air Travel) Favorable

       – Continued Demand for Differentiated Technologies, Products, Services

     • Industry Highlights
       – AERO – OE Production Up; Global Flying Hours +4-5%; Defense Budget Up

       – ACS – Global Growth; Increased Non-Res. Construction, Infrastructure

       – TS – LV Production Flat; Diesel Penetration Flat; NA Class 8 OE Down

       – SM – Global Growth; Increased Energy Demand; Capacity Expansion


       Overall Environment / Trends Favorable For HON
                                                                                3Q 2006 Earnings Release
10
                                                                                        October 19, 2006
Preliminary 2007 Financial Outlook
     Continued Focus on Long Term Value Creation

     • Economic/Industry View Drives More Conservative Top Line Growth

     • Segment Profit Drives Earnings Growth
       – Continued Margin Expansion

     • Below the Line Expenses In Line With 2006
       – Minimal Pension Tailwind (Rate Sensitive)

     • Double Digit Earnings Growth

     • Continued FCF Growth

     • Balanced Cash Deployment
       – Continued Focus on Business Investment and Return to Shareholders


                 2007 Outlook Call – December 13th
                                                                             3Q 2006 Earnings Release
11
                                                                                     October 19, 2006
Appendix
     Reconciliation of non-GAAP Measures
              to GAAP Measures


                                       3Q 2006 Earnings Release
12
                                               October 19, 2006
Reconciliation of Segment Profit to Operating Income and
     Calculation of Segment Profit and Operating Income Margin
                                                                                                                        3Q05      3Q06
             ($M )

                Sales                                                                                                   $6,900    $7,952
                Cost of Products and Services Sold                                                                      (5,302)   (6,111)
                Selling, General and Administrative Expenses                                                             (982)    (1,037)
                Operating Income                                                                                         $616      $804

                FAS 123R, Stock Option Expense (1)                                                                       $0        $20
                Repositioning and Other Charges (1)                                                                      110       105
                Pension and OPEB Expense (1)                                                                             141       100
                Segment Profit                                                                                           $867     $1,029

           Operating Income                                                                                              $616      $804
         ÷ Sales                                                                                                        $6,900    $7,952
           Operating Income Margin %                                                                                     8.9%      10.1%

           Segment Profit                                                                                                $867     $1,029
         ÷ Sales                                                                                                        $6,900    $7,952
           Segment Profit Margin %                                                                                       12.6%     12.9%

       (1)           Included in costs of products and services sold and selling, general and administrative expenses


                                                                                                                                           3Q 2006 Earnings Release
13
                                                                                                                                                   October 19, 2006
Reconciliation of Free Cash Flow to Cash Provided by Operating
     Activities and Calculation of Cash Flow Conversion

                                                            3Q05    3Q06
        ($M )

           Cash Provided by Operating Activities            $705    $796
           Expenditures for Property, Plant and Equipment   (162)   (162)
           Free Cash Flow                                   543     634


           Cash Provided by Operating Activities            $705    $796
       ÷ Net Income                                         464     541
           Operating Cash Flow Conversion %                 152%    147%

         Free Cash Flow                                     $543    $634
       ÷ Net Income                                          464    541
         Free Cash Flow Conversion %                        117%    117%


                                                                            3Q 2006 Earnings Release
14
                                                                                    October 19, 2006
Reconciliation of Segment Profit to Operating Income and
     Calculation of Segment Profit and Operating Income Margin
                                                                                                                  2005     2006E
            ($B)
             Sales                                                                                                $27.6     $31.1
             Cost of Products and Services Sold                                                                   (21.5)    (24.0)
             Selling, General and Administrative Expenses                                                          (3.7)    (4.0)
             Operating Income                                                                                      $2.4     $3.1
                                                                                  (1)
             FAS 123R, Stock Option Expense                                                                        0.0       0.1
                                             (1)
             Repositioning and Other Charges                                                                       0.4       0.4
                                                                        (1)
             Pension and OPEB Expense                                                                              0.6       0.5
             Segment Profit                                                                                        $3.4     $4.1

          Operating Income                                                                                         $2.4     $3.1
        ÷ Sales                                                                                                   $27.6     $31.1
          Operating Income Margin %                                                                                8.7%     10.0%

             Segment Profit                                                                                        $3.4     $4.1
        ÷ Sales                                                                                                   $27.6     $31.1
             Segment Profit Margin %                                                                              12.2%     13.2%

      (1)      Included in costs of products and services sold and selling, general and administrative expenses

                                                                                                                                     3Q 2006 Earnings Release
15
                                                                                                                                             October 19, 2006
Reconciliation of Free Cash Flow to Cash Provided by Operating
     Activities and Calculation of Cash Flow Conversion


                                                          2005       2006E
       ($M)
         Cash Provided by Operating Activities            $2,442      $3,000
         Expenditures for Property, Plant and Equipment    (684)       (800)
         Free Cash Flow                                   $1,758      $2,200


         Cash Provided by Operating Activities            $2,442      $3,000
       ÷ Net Income                                       $1,638   $2,075 - 2,100
         Operating Cash Flow Conversion %                  149%        +135%

         Free Cash Flow                                   $1,758      $2,200
       ÷ Net Income                                       $1,638   $2,075 - 2,100
         Free Cash Flow Conversion %                       107%        +100%


                                                                               3Q 2006 Earnings Release
16
                                                                                       October 19, 2006
3Q 2006 Earnings Release
17
             October 19, 2006

More Related Content

Honeywell Q3 2006 Earnings Conference Call Presentation

  • 1. Third Quarter Earnings Release October 19, 2006 3Q 2006 Earnings Release 1 October 19, 2006
  • 2. Forward Looking Statements This report contains “forward-looking statements” within the meaning of Section 21E of the Securities Exchange Act of 1934. All statements, other than statements of fact, that address activities, events or developments that we or our management intend, expect, project, believe or anticipate will or may occur in the future are forward-looking statements. Forward-looking statements are based on management’s assumptions and assessments in light of past experience and trends, current conditions, expected future developments and other relevant factors. They are not guarantees of future performance, and actual results, developments and business decisions may differ from those envisaged by our forward-looking statements. Our forward-looking statements are also subject to risks and uncertainties, which can affect our performance in both the near- and long-term. We identify the principal risks and uncertainties that affect our performance in our Form 10-K and other filings with the Securities and Exchange Commission. 3Q 2006 Earnings Release 2 October 19, 2006
  • 3. 3Q Overview • Financial Performance – 15% Sales Growth, 9% Organic Growth – Segment Profit up 19% – 22% EPS Growth, 36% Adjusted (1) EPS Growth – $634M Free Cash Flow, $1.5B YTD • Business Highlights – AERO – Sales Strong, New Wins (Business Jets, Orion) – ACS – 11% Organic Growth, Continued Execution – TS – Turbo Favorable, CPG Consumer Impact – SM – 9% Organic Growth, UOP Strength • Cash Deployment – Repurchased 5M Shares; Average Fully Diluted Share Count 821M • 2006 EPS Guidance $2.51 – 2.53, High End of Range Continued Growth And Execution (1) Reflects 3Q05 Income from Discontinued Operations ($0.04) and 3Q06 FAS 123R stock option expense ($0.02) 3Q 2006 Earnings Release 3 October 19, 2006
  • 4. 3Q Financials 3Q05 3Q06 (M) Sales $6,900 $7,952 • 15% Growth 6% Acq./Div. 9% Organic 1% F/X Impact Segment Profit $867 $1,029 • 19% Growth - Margin % 12.6% 12.9% • +30 bps EPS, Reported $0.54 $0.66 • 22% Growth EPS, Adjusted (1) • 36% Growth $0.50 $0.68 Free Cash Flow $543 $634 • 117% Conversion (1) Reflects 3Q05 Income from Discontinued Operations ($0.04) and 3Q06 FAS 123R stock option expense ($0.02) Strong Financial Performance 3Q 2006 Earnings Release 4 October 19, 2006
  • 5. Aerospace (M) 3Q05 3Q06 Financial Highlights • Sales up 9% Sales $2,620 $2,854 No F/X Impact • Air Transport & Regional up 10% Segment $429 $501 OE up 13% Profit AM up 8% Margin 16.4% 17.6% • Business & General Aviation up 13% OE up 22% AM up 5% Business Highlights • Defense & Space up 6% + New Wins – Business Jets, Orion • Segment Profit up 17% + Commercial OE up 17% 120 bps margin expansion + Commercial AM up 7% + Volume growth / price + Defense up 9%, Space recovery + Benefit from 3Q05 reorganization + Engineering spend / funding on track – Inflation – Commercial mix, stronger OE – Mix, stronger OE Great Quarter 3Q 2006 Earnings Release 5 October 19, 2006
  • 6. Automation And Control Solutions (M) 3Q05 3Q06 Financial Highlights • Sales up 16% Sales $2,445 $2,844 Organic 11%; Acq./Div. 5% Segment $300 $330 F/X Impact 2% Profit • Products up 16% • Solutions up 16% Margin 12.3% 11.6% Business Highlights • Segment Profit up 10% 70 bps margin contraction + Products 10% organic growth + Volume growth + Solutions 14% organic growth + Productivity actions + Solutions orders up +20% – Inflation – Mix + First Technology / Gardiner performance – Acquisitions/ERP Strong Organic Growth And Continued Execution 3Q 2006 Earnings Release 6 October 19, 2006
  • 7. Transportation Systems (M) 3Q05 3Q06 Financial Highlights • Sales up 5% Sales $1,061 $1,111 F/X Impact 3% Segment $121 $129 • Turbo up 10% Profit • CPG down 1% Consumer spending impact Margin 11.4% 11.6% Friction NA OE exit Business Highlights + HTT platform wins (Diesel, Gasoline) • Segment Profit up 7% 20 bps margin expansion + HTT Europe demand as expected + Productivity actions Diesel penetration up, LV production down + Turbo volume growth + Class 8, ahead of YE emissions change – Inflation + Asia growth, new product introductions – CPG volume – CPG market conditions Winning New Business And Driving Productivity 3Q 2006 Earnings Release 7 October 19, 2006
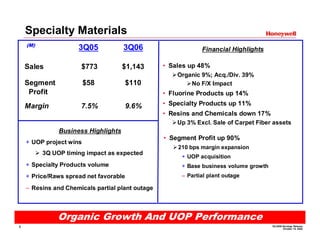
  • 8. Specialty Materials (M) 3Q05 3Q06 Financial Highlights • Sales up 48% Sales $773 $1,143 Organic 9%; Acq./Div. 39% Segment $58 $110 No F/X Impact Profit • Fluorine Products up 14% • Specialty Products up 11% Margin 7.5% 9.6% • Resins and Chemicals down 17% Up 3% Excl. Sale of Carpet Fiber assets Business Highlights • Segment Profit up 90% + UOP project wins 210 bps margin expansion 3Q UOP timing impact as expected + UOP acquisition + Specialty Products volume + Base business volume growth – Partial plant outage + Price/Raws spread net favorable – Resins and Chemicals partial plant outage Organic Growth And UOP Performance 3Q 2006 Earnings Release 8 October 19, 2006
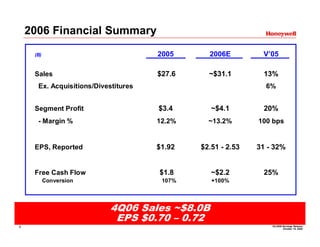
  • 9. 2006 Financial Summary 2005 2006E V’05 (B) $27.6 ~$31.1 13% Sales Ex. Acquisitions/Divestitures 6% $3.4 ~$4.1 20% Segment Profit - Margin % 12.2% ~13.2% 100 bps $1.92 $2.51 - 2.53 31 - 32% EPS, Reported $1.8 ~$2.2 25% Free Cash Flow Conversion 107% +100% 4Q06 Sales ~$8.0B EPS $0.70 – 0.72 3Q 2006 Earnings Release 9 October 19, 2006
  • 10. 2007 Economic/Industry Outlook • Overall Outlook Favorable – Modest Softening in Global Economic Growth – Industry Specific Weakness (US Residential Construction, US Automotive) – Macro Trends (Safety, Security, Energy Efficiency, Air Travel) Favorable – Continued Demand for Differentiated Technologies, Products, Services • Industry Highlights – AERO – OE Production Up; Global Flying Hours +4-5%; Defense Budget Up – ACS – Global Growth; Increased Non-Res. Construction, Infrastructure – TS – LV Production Flat; Diesel Penetration Flat; NA Class 8 OE Down – SM – Global Growth; Increased Energy Demand; Capacity Expansion Overall Environment / Trends Favorable For HON 3Q 2006 Earnings Release 10 October 19, 2006
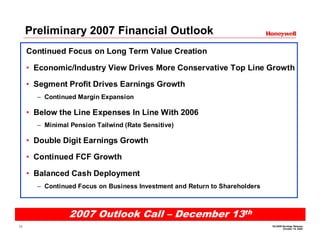
  • 11. Preliminary 2007 Financial Outlook Continued Focus on Long Term Value Creation • Economic/Industry View Drives More Conservative Top Line Growth • Segment Profit Drives Earnings Growth – Continued Margin Expansion • Below the Line Expenses In Line With 2006 – Minimal Pension Tailwind (Rate Sensitive) • Double Digit Earnings Growth • Continued FCF Growth • Balanced Cash Deployment – Continued Focus on Business Investment and Return to Shareholders 2007 Outlook Call – December 13th 3Q 2006 Earnings Release 11 October 19, 2006
  • 12. Appendix Reconciliation of non-GAAP Measures to GAAP Measures 3Q 2006 Earnings Release 12 October 19, 2006
  • 13. Reconciliation of Segment Profit to Operating Income and Calculation of Segment Profit and Operating Income Margin 3Q05 3Q06 ($M ) Sales $6,900 $7,952 Cost of Products and Services Sold (5,302) (6,111) Selling, General and Administrative Expenses (982) (1,037) Operating Income $616 $804 FAS 123R, Stock Option Expense (1) $0 $20 Repositioning and Other Charges (1) 110 105 Pension and OPEB Expense (1) 141 100 Segment Profit $867 $1,029 Operating Income $616 $804 ÷ Sales $6,900 $7,952 Operating Income Margin % 8.9% 10.1% Segment Profit $867 $1,029 ÷ Sales $6,900 $7,952 Segment Profit Margin % 12.6% 12.9% (1) Included in costs of products and services sold and selling, general and administrative expenses 3Q 2006 Earnings Release 13 October 19, 2006
  • 14. Reconciliation of Free Cash Flow to Cash Provided by Operating Activities and Calculation of Cash Flow Conversion 3Q05 3Q06 ($M ) Cash Provided by Operating Activities $705 $796 Expenditures for Property, Plant and Equipment (162) (162) Free Cash Flow 543 634 Cash Provided by Operating Activities $705 $796 ÷ Net Income 464 541 Operating Cash Flow Conversion % 152% 147% Free Cash Flow $543 $634 ÷ Net Income 464 541 Free Cash Flow Conversion % 117% 117% 3Q 2006 Earnings Release 14 October 19, 2006
  • 15. Reconciliation of Segment Profit to Operating Income and Calculation of Segment Profit and Operating Income Margin 2005 2006E ($B) Sales $27.6 $31.1 Cost of Products and Services Sold (21.5) (24.0) Selling, General and Administrative Expenses (3.7) (4.0) Operating Income $2.4 $3.1 (1) FAS 123R, Stock Option Expense 0.0 0.1 (1) Repositioning and Other Charges 0.4 0.4 (1) Pension and OPEB Expense 0.6 0.5 Segment Profit $3.4 $4.1 Operating Income $2.4 $3.1 ÷ Sales $27.6 $31.1 Operating Income Margin % 8.7% 10.0% Segment Profit $3.4 $4.1 ÷ Sales $27.6 $31.1 Segment Profit Margin % 12.2% 13.2% (1) Included in costs of products and services sold and selling, general and administrative expenses 3Q 2006 Earnings Release 15 October 19, 2006
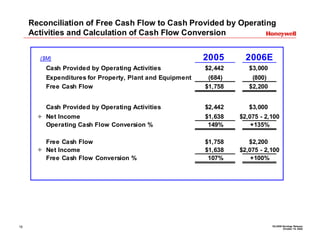
  • 16. Reconciliation of Free Cash Flow to Cash Provided by Operating Activities and Calculation of Cash Flow Conversion 2005 2006E ($M) Cash Provided by Operating Activities $2,442 $3,000 Expenditures for Property, Plant and Equipment (684) (800) Free Cash Flow $1,758 $2,200 Cash Provided by Operating Activities $2,442 $3,000 ÷ Net Income $1,638 $2,075 - 2,100 Operating Cash Flow Conversion % 149% +135% Free Cash Flow $1,758 $2,200 ÷ Net Income $1,638 $2,075 - 2,100 Free Cash Flow Conversion % 107% +100% 3Q 2006 Earnings Release 16 October 19, 2006
  • 17. 3Q 2006 Earnings Release 17 October 19, 2006