Location via proxy:   [ UP ]  
[Report a bug]   [Manage cookies]                
SlideShare a Scribd company logo

1

3rd Quarter Results
 October 29, 2008


                      1

2

Safe Harbor
Caution Concerning Forward-Looking Statements
This presentation contains forward-looking statements within the meaning of the Private Securities Litigation
Reform Act of 1995. In some cases, you can identify those so-called “forward-looking statements” by words
such as “may,” “will,” “should,” “expects,” “plans,” “anticipates,” “believes,” “estimates,” “predicts,”
“potential,” or “continue,” or the negative of those words and other comparable words. We wish to take
advantage of the “safe harbor” provided for by the Private Securities Litigation Reform Act of 1995 and we
caution you that actual events or results may differ materially from the expectations we express in our forward-
looking statements as a result of various risks and uncertainties, many of which are beyond our control.
Factors that could cause our actual results to differ materially from these forward-looking statements include:
(1) changes in the competitive environment, (2) changes in business and economic conditions, (3) changes in
our programming costs, (4) changes in laws and regulations, (5) changes in technology, (6) adverse decisions
in litigation matters, (7) risks associated with acquisitions and other strategic transactions, (8) changes in
assumptions underlying our critical accounting policies, and (9) other risks described from time to time in
reports and other documents we file with the Securities and Exchange Commission. We undertake no
obligation to update any forward-looking statements. The amount and timing of share repurchases and
dividends is subject to business, economic and other relevant factors.

Non-GAAP Financial Measures
Our presentation may also contain non-GAAP financial measures, as defined in Regulation G, adopted by the
SEC. We provide a reconciliation of these non-GAAP financial measures to the most directly comparable GAAP
financial measure in our quarterly earnings releases, which can be found on the Financial Information page of
our web site at www.cmcsa.com or www.cmcsk.com.


                                                                                                                   2

3

2008: Focused on Execution

• Solid results in a challenging environment

• Strong competitive position

• Proactive management of expenses and
  disciplined capital investment

• Significant Free Cash Flow growth

• Solid balance sheet

                                               3

4

3nd Quarter 2008 - Consolidated Results
       3Q08 Consolidated Revenue, OCF(1), Free Cash Flow(2), Adjusted EPS(3) and FCF/Share
       (in millions except per share amounts)


          3Q08 +10%
          YTD +11%
00.0


                   $8,549                                                                              3Q08 +88%
                                                                                                      YTD +124%
       $7,781
00.0
                                                                                        3Q08 +33%
                                                                                        YTD +19%
                                                                                                              $0.32
                                                                                0.3

00.0
                                                                                              $0.24
                                   3Q08 +10%
                                   YTD +12%

                                                                                      $0.18
                                                                                0.2
                                                                                                      $0.17
00.0
                                              $3,237
                                $2,929
                                                                 3Q08 +77%
                                                                YTD +109%       0.1
00.0


                                                                        $928
                                                               $524
        3Q07        3Q08         3Q07           3Q08           3Q07     3Q08          3Q07    3Q08    3Q07    3Q08
 0.0                                                                            0.0


           Revenue                      OCF                    Free Cash Flow          Adjusted EPS     FCF/Share


                                                                                                                4
                             See detailed notes on Slide 13.

5

Consolidated Pro Forma Revenue(4) Increased 7%
                                                                             Highlights
                                                  %∆                  %∆
                                  3Q08                        YTD            + Stable video revenue
                                                                               growth
Video                            $4,681                4%   $14,113    4%
                                                                             + Continued market share
High-Speed Internet              $1,822                9%    $5,364   10%
                                                                               gains in HSI and relatively
                                                                               stable ARPU
Phone                               $690          44%        $1,917   52%
                                                                             + Solid CDV unit and revenue
                                                                               growth
Advertising                         $374        (10%)        $1,117   (3%)
                                                                             – Deteriorating advertising
Other(5)                            $564          10%        $1,636   11%
                                                                               trends
Cable Revenue(4)                 $8,131                7%   $24,147    8%       + Partially offset by
                                                                                  political
Programming                         $347               5%    $1,076   11%
                                                                                – One less advertising
Corporate & Other                     $71         38%         $268    43%         week
                                                                             – Solid Programming growth
Consolidated
                                 $8,549                7%   $25,491    8%
Revenue                                                                         – Impacted by lower
                                                                                  ratings (Olympics)
                                                                                – One less advertising
  Note: Cable Revenue includes revenues from Business Services of
                                                                                  week
  $145MM in 3Q08, up 42% compared to $102MM in 3Q07.
                                                                                                         5
                     See detailed notes on Slide 13.

6

Consolidated Pro Forma Operating Cash
Flow Increased 8%
                                                           %∆                  %∆
                                                3Q08                 YTD
Cable OCF                                       $3,251       7%     $9,755       8%
Cable OCF Margin                                 40.0%   (20 bps)    40.4%   (10 bps)
Programming OCF                                  $105        9%      $307       30%
                                                ($119)     16%      ($300)       9%
Corp & Other OCF
Consolidated OCF                                $3,237       8%     $9,762       9%
Consol. OCF Margin                               37.9%   +20 bps     38.3%   +20 bps


Highlights
 + Controlling expenses
    + CDV and HSI costs decreased 9%
    + Employee expense reductions
 – $39MM expenses related to employee reductions
 – $20MM impact from 2 major hurricanes


                                                                                   6
              See detailed notes on Slide 13.

7

Disciplined Capital Investment
                                                                                        YTD Cable Capex
Capital Expenditures                                 3Q08                   YTD
 CPE                                                   $590              $2,096
 Scalable Infrastructure                                  60                  175                                      2%
 Line Extensions                                          54                  154
 Support Capital                                          65                  176
 Upgrades (Capacity Expansion)                            13                    58
                                                                                                      25%
 Business Services                                        61                  160
Total Growth                                          $843               $2,819
 CPE (Drop Replacements)                                  76                  207
 Scalable Infrastructure                                194                   411
                                                                                                                     73%
 Support Capital                                          54                  155
 Upgrades                                                 81                  199
Total Maintenance                                     $405                 $972
Total Discretionary*                                    $20                  $86
Total Cable Capex                                  $1,268                $3,877
                                                                                                                  Growth
Programming, Corp & Other                                 38                  160                                 Maintenance
Total Consolidated Capex                           $1,306                $4,037                                   Discretionary
% of Total Revenue                                   15.3%                 15.8%

                                                                                                                                  7
                     * Discretionary includes investments that lay the groundwork for future products and services, such as our
                     investments in interactive advertising, cross-platform product development or switched digital video.            7

8

Financial Priorities
Balanced and Disciplined Financial Strategy

• Focus on Free Cash Flow Generation
• Disciplined Capital Allocation
• Returning Capital to Shareholders
                                                                             113% FCF

                                       106% FCF                                  $367MM
                                                                    $2.8Bn       $2.8Bn
                                       $182MM                      $0.94/Share
                         $928MM
                                        $800MM
                         $0.32/Share


                                                      $1.3Bn
                                         $1.0Bn      $0.42/Share
            $524MM
           $0.17/Share


             3Q07                 3Q08                 YTD 07              YTD 08


                                             Free Cash Flow
                                             Share Repurchases                            8
                                             Dividends Paid

9

Prudent Balance Sheet Management
     3 Year Maturity Schedule(a)
.0

                                                                                                                                                     LTM
     ($ in Bn estimated as of 9/30/08)

                                                                                                                                                   3Q08(b)
                                                                                     Total Debt                                                 $33.7 Bn
            $2.0
.0
                                                      $1.8                                                                                       13.6 Yrs
                                                                                     Weighted Average Life
                                                                                                                                               80%/20%
                                                                                     Fixed / Floating
                                $1.2                                                                                                              $2.4 Bn
                                                                                     Interest expense
.0                                                                                   Debt / OCF                                                         2.6 x
                                                                                     Interest Coverage(c)                                               5.3 x
                                                                                     Credit Facility available(d)                                 $5.2 Bn
                                                      2011
            2009                2010                                                 Cash balance                                                 $2.7 Bn
.0
            2009                2010                  2011


                               S&P: BBB+ | Moody’s: Baa2 | Fitch: BBB+

                               a.   Mandatory maturities only, excludes $250MM of 8.5% notes due 2027 with a one-time put right in May 2009.
                               b.   3Q08 Interest Expense, OCF and UFCF are last twelve months (LTM) through 3Q08.
                               c.   Interest Coverage = OCF/Interest Expense.
                                                                                                                                                            9
                               d.   Credit Facility increased from $5.0 Bn to $7.0 Bn in January 2008, and is due in 2013. Availability is reduced by
                                    issued letters of credit ($0.3Bn), commercial paper (none outstanding), and revolver borrowings ($1.5Bn).

10

Multiple Services Drive Increasing Growth
     Revenue by Product and Total
     Average Revenue per Basic Sub
                                                                       Video: Basic subscribers total 24.4M
                                 +9%
                                         $111
                                                                        • Digital
                        $102
10
                 +11%
                                                                              Total subs = 16.8M
00
         $92                                                                  Penetration of Basic = 68.6%
90
                                                                        • Advanced services
80
                                                                              Total subs = 7.3M
70
                                                                              Penetration of Digital: 43.5%
60

                                                                       High-Speed Internet: Subscribers total 14.7M
50
                                                                        • Net Additions of 382K
40
                                                                        • Penetration reached 29.5%
30

                                                                       CDV: Subscribers total 6.1M
20

                                                                        • Net Additions of 483K
10
      3Q06              3Q07            3Q08                            • Penetration reached 13.3%
0


                                                                       Business Services: Revenue up 42%
       Basic Video       HSD          Advertising
       Digital           Phone        Business Services


                                                                                                               10
                         Note: Graph includes ARPU from circuit-switched phone acquired from AT&T Broadband.

11

Product Evolution

• New product offerings to meet changing
  marketplace
  • Revised bundles, economy tiers and retention offers
  • Targeted promotions by geographic area
  • More HD product bundles

• Continued focus on product superiority
  • Expanding VOD offerings
  • Roll-out of DOCSIS 3.0 (“Wideband”)
  • Conversion to digital delivery (“All-Digital”)

                                                          11

12

Expense Management

• Reacted quickly to a changing environment
  • Activity levels decline
  • Productivity increases
  • Unit costs in CDV decline
  • Headcount carefully managed

• Significant capital cost reduction
  • YTD capital spending declined ~$650MM vs. last year
  • Broad reductions in many line items


                                                      12

13

Notes
1    Operating Cash Flow is defined as operating income before depreciation and amortization, excluding impairment charges
     related to fixed and intangible assets and gains or losses on sale of assets, if any.
2    Free Cash Flow, which is a non-GAAP financial measure, is defined as ”Net Cash Provided by Operating Activities” (as
     stated in our Consolidated Statement of Cash Flows) reduced by capital expenditures and cash paid for intangible assets and
     adjusted for any payments related to certain non-operating items, net of estimated tax benefits (such as income taxes on
     investment sales, and non-recurring payments related to income tax and litigation contingencies of acquired companies).
     Please refer to Table 4 in our 3Q08 earnings release for further details. Free Cash Flow per Share is calculated by taking
     Free Cash Flow (as described above) divided by diluted weighted-average number of common shares outstanding used in
     the calculation of earnings per share.
3    Net income and earnings per share are adjusted for gains, net of tax, related to the dissolution of the Texas/Kansas City
     Cable Partnership in 2007, the dissolution of the Insight Midwest Partnership in 2008, and gains related to the settlement of
     an uncertain tax position of an acquired entity and certain state tax law changes in 2008. Please refer to Table 7-B in our
     3Q08 earnings release for a reconciliation of adjusted net income and earnings per share. Earnings per share amounts are
     presented on a diluted basis.
4    Pro forma results adjust for certain cable segment acquisitions and dispositions, including the acquisitions of Comcast
     SportsNet Bay Area/Comcast SportsNet New England (June 2007), the cable system acquired from Patriot Media (August
     2007), and the dissolution of the Insight Midwest Partnership (January 2008). Consolidated and cable pro forma results are
     presented as if the transactions noted above were effective on January 1, 2007. The net impact of these transactions
     increased the number of basic cable subscribers by 765,000. Please refer to Table 7-A in our 3Q08 earnings release for a
     reconciliation of pro forma financial data.
5    Other revenues include franchise fees, regional sports programming networks, residential video installation revenues, guide
     revenues, commissions from electronic retailing, other product offerings and revenues of our digital media center.


For more detailed information please refer to our quarterly earnings release.


                                                                                                                                   13

More Related Content

Q3 2008 Comcast Corporation Earnings Conference Call

  • 1. 3rd Quarter Results October 29, 2008 1
  • 2. Safe Harbor Caution Concerning Forward-Looking Statements This presentation contains forward-looking statements within the meaning of the Private Securities Litigation Reform Act of 1995. In some cases, you can identify those so-called “forward-looking statements” by words such as “may,” “will,” “should,” “expects,” “plans,” “anticipates,” “believes,” “estimates,” “predicts,” “potential,” or “continue,” or the negative of those words and other comparable words. We wish to take advantage of the “safe harbor” provided for by the Private Securities Litigation Reform Act of 1995 and we caution you that actual events or results may differ materially from the expectations we express in our forward- looking statements as a result of various risks and uncertainties, many of which are beyond our control. Factors that could cause our actual results to differ materially from these forward-looking statements include: (1) changes in the competitive environment, (2) changes in business and economic conditions, (3) changes in our programming costs, (4) changes in laws and regulations, (5) changes in technology, (6) adverse decisions in litigation matters, (7) risks associated with acquisitions and other strategic transactions, (8) changes in assumptions underlying our critical accounting policies, and (9) other risks described from time to time in reports and other documents we file with the Securities and Exchange Commission. We undertake no obligation to update any forward-looking statements. The amount and timing of share repurchases and dividends is subject to business, economic and other relevant factors. Non-GAAP Financial Measures Our presentation may also contain non-GAAP financial measures, as defined in Regulation G, adopted by the SEC. We provide a reconciliation of these non-GAAP financial measures to the most directly comparable GAAP financial measure in our quarterly earnings releases, which can be found on the Financial Information page of our web site at www.cmcsa.com or www.cmcsk.com. 2
  • 3. 2008: Focused on Execution • Solid results in a challenging environment • Strong competitive position • Proactive management of expenses and disciplined capital investment • Significant Free Cash Flow growth • Solid balance sheet 3
  • 4. 3nd Quarter 2008 - Consolidated Results 3Q08 Consolidated Revenue, OCF(1), Free Cash Flow(2), Adjusted EPS(3) and FCF/Share (in millions except per share amounts) 3Q08 +10% YTD +11% 00.0 $8,549 3Q08 +88% YTD +124% $7,781 00.0 3Q08 +33% YTD +19% $0.32 0.3 00.0 $0.24 3Q08 +10% YTD +12% $0.18 0.2 $0.17 00.0 $3,237 $2,929 3Q08 +77% YTD +109% 0.1 00.0 $928 $524 3Q07 3Q08 3Q07 3Q08 3Q07 3Q08 3Q07 3Q08 3Q07 3Q08 0.0 0.0 Revenue OCF Free Cash Flow Adjusted EPS FCF/Share 4 See detailed notes on Slide 13.
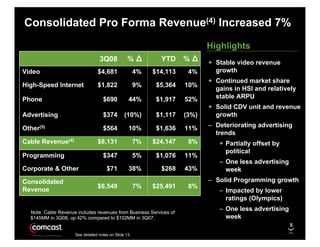
  • 5. Consolidated Pro Forma Revenue(4) Increased 7% Highlights %∆ %∆ 3Q08 YTD + Stable video revenue growth Video $4,681 4% $14,113 4% + Continued market share High-Speed Internet $1,822 9% $5,364 10% gains in HSI and relatively stable ARPU Phone $690 44% $1,917 52% + Solid CDV unit and revenue growth Advertising $374 (10%) $1,117 (3%) – Deteriorating advertising Other(5) $564 10% $1,636 11% trends Cable Revenue(4) $8,131 7% $24,147 8% + Partially offset by political Programming $347 5% $1,076 11% – One less advertising Corporate & Other $71 38% $268 43% week – Solid Programming growth Consolidated $8,549 7% $25,491 8% Revenue – Impacted by lower ratings (Olympics) – One less advertising Note: Cable Revenue includes revenues from Business Services of week $145MM in 3Q08, up 42% compared to $102MM in 3Q07. 5 See detailed notes on Slide 13.
  • 6. Consolidated Pro Forma Operating Cash Flow Increased 8% %∆ %∆ 3Q08 YTD Cable OCF $3,251 7% $9,755 8% Cable OCF Margin 40.0% (20 bps) 40.4% (10 bps) Programming OCF $105 9% $307 30% ($119) 16% ($300) 9% Corp & Other OCF Consolidated OCF $3,237 8% $9,762 9% Consol. OCF Margin 37.9% +20 bps 38.3% +20 bps Highlights + Controlling expenses + CDV and HSI costs decreased 9% + Employee expense reductions – $39MM expenses related to employee reductions – $20MM impact from 2 major hurricanes 6 See detailed notes on Slide 13.
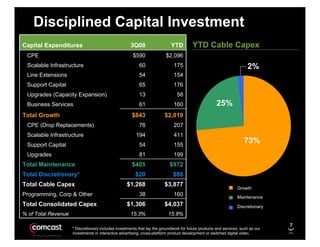
  • 7. Disciplined Capital Investment YTD Cable Capex Capital Expenditures 3Q08 YTD CPE $590 $2,096 Scalable Infrastructure 60 175 2% Line Extensions 54 154 Support Capital 65 176 Upgrades (Capacity Expansion) 13 58 25% Business Services 61 160 Total Growth $843 $2,819 CPE (Drop Replacements) 76 207 Scalable Infrastructure 194 411 73% Support Capital 54 155 Upgrades 81 199 Total Maintenance $405 $972 Total Discretionary* $20 $86 Total Cable Capex $1,268 $3,877 Growth Programming, Corp & Other 38 160 Maintenance Total Consolidated Capex $1,306 $4,037 Discretionary % of Total Revenue 15.3% 15.8% 7 * Discretionary includes investments that lay the groundwork for future products and services, such as our investments in interactive advertising, cross-platform product development or switched digital video. 7
  • 8. Financial Priorities Balanced and Disciplined Financial Strategy • Focus on Free Cash Flow Generation • Disciplined Capital Allocation • Returning Capital to Shareholders 113% FCF 106% FCF $367MM $2.8Bn $2.8Bn $182MM $0.94/Share $928MM $800MM $0.32/Share $1.3Bn $1.0Bn $0.42/Share $524MM $0.17/Share 3Q07 3Q08 YTD 07 YTD 08 Free Cash Flow Share Repurchases 8 Dividends Paid
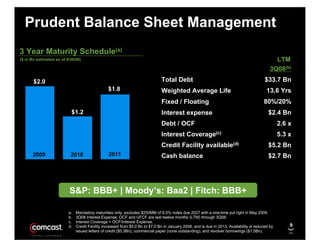
  • 9. Prudent Balance Sheet Management 3 Year Maturity Schedule(a) .0 LTM ($ in Bn estimated as of 9/30/08) 3Q08(b) Total Debt $33.7 Bn $2.0 .0 $1.8 13.6 Yrs Weighted Average Life 80%/20% Fixed / Floating $1.2 $2.4 Bn Interest expense .0 Debt / OCF 2.6 x Interest Coverage(c) 5.3 x Credit Facility available(d) $5.2 Bn 2011 2009 2010 Cash balance $2.7 Bn .0 2009 2010 2011 S&P: BBB+ | Moody’s: Baa2 | Fitch: BBB+ a. Mandatory maturities only, excludes $250MM of 8.5% notes due 2027 with a one-time put right in May 2009. b. 3Q08 Interest Expense, OCF and UFCF are last twelve months (LTM) through 3Q08. c. Interest Coverage = OCF/Interest Expense. 9 d. Credit Facility increased from $5.0 Bn to $7.0 Bn in January 2008, and is due in 2013. Availability is reduced by issued letters of credit ($0.3Bn), commercial paper (none outstanding), and revolver borrowings ($1.5Bn).
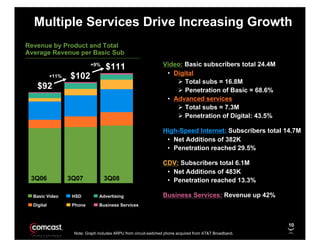
  • 10. Multiple Services Drive Increasing Growth Revenue by Product and Total Average Revenue per Basic Sub Video: Basic subscribers total 24.4M +9% $111 • Digital $102 10 +11% Total subs = 16.8M 00 $92 Penetration of Basic = 68.6% 90 • Advanced services 80 Total subs = 7.3M 70 Penetration of Digital: 43.5% 60 High-Speed Internet: Subscribers total 14.7M 50 • Net Additions of 382K 40 • Penetration reached 29.5% 30 CDV: Subscribers total 6.1M 20 • Net Additions of 483K 10 3Q06 3Q07 3Q08 • Penetration reached 13.3% 0 Business Services: Revenue up 42% Basic Video HSD Advertising Digital Phone Business Services 10 Note: Graph includes ARPU from circuit-switched phone acquired from AT&T Broadband.
  • 11. Product Evolution • New product offerings to meet changing marketplace • Revised bundles, economy tiers and retention offers • Targeted promotions by geographic area • More HD product bundles • Continued focus on product superiority • Expanding VOD offerings • Roll-out of DOCSIS 3.0 (“Wideband”) • Conversion to digital delivery (“All-Digital”) 11
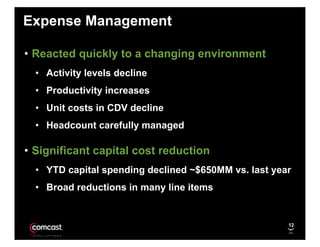
  • 12. Expense Management • Reacted quickly to a changing environment • Activity levels decline • Productivity increases • Unit costs in CDV decline • Headcount carefully managed • Significant capital cost reduction • YTD capital spending declined ~$650MM vs. last year • Broad reductions in many line items 12
  • 13. Notes 1 Operating Cash Flow is defined as operating income before depreciation and amortization, excluding impairment charges related to fixed and intangible assets and gains or losses on sale of assets, if any. 2 Free Cash Flow, which is a non-GAAP financial measure, is defined as ”Net Cash Provided by Operating Activities” (as stated in our Consolidated Statement of Cash Flows) reduced by capital expenditures and cash paid for intangible assets and adjusted for any payments related to certain non-operating items, net of estimated tax benefits (such as income taxes on investment sales, and non-recurring payments related to income tax and litigation contingencies of acquired companies). Please refer to Table 4 in our 3Q08 earnings release for further details. Free Cash Flow per Share is calculated by taking Free Cash Flow (as described above) divided by diluted weighted-average number of common shares outstanding used in the calculation of earnings per share. 3 Net income and earnings per share are adjusted for gains, net of tax, related to the dissolution of the Texas/Kansas City Cable Partnership in 2007, the dissolution of the Insight Midwest Partnership in 2008, and gains related to the settlement of an uncertain tax position of an acquired entity and certain state tax law changes in 2008. Please refer to Table 7-B in our 3Q08 earnings release for a reconciliation of adjusted net income and earnings per share. Earnings per share amounts are presented on a diluted basis. 4 Pro forma results adjust for certain cable segment acquisitions and dispositions, including the acquisitions of Comcast SportsNet Bay Area/Comcast SportsNet New England (June 2007), the cable system acquired from Patriot Media (August 2007), and the dissolution of the Insight Midwest Partnership (January 2008). Consolidated and cable pro forma results are presented as if the transactions noted above were effective on January 1, 2007. The net impact of these transactions increased the number of basic cable subscribers by 765,000. Please refer to Table 7-A in our 3Q08 earnings release for a reconciliation of pro forma financial data. 5 Other revenues include franchise fees, regional sports programming networks, residential video installation revenues, guide revenues, commissions from electronic retailing, other product offerings and revenues of our digital media center. For more detailed information please refer to our quarterly earnings release. 13