Atmosphere, weather and climate
- 1. Atmosphere, Weather and Climate
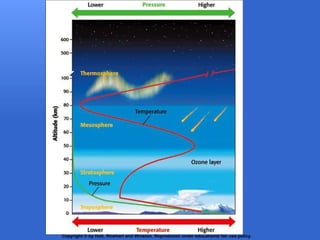
- 2. Earth’s Atmosphere Layers of Earth’s Atmosphere Troposphere : We live here, where weather occurs Stratosphere : Ozone layer- filters UV radiation Mesosphere : Middle layer, it’s the coldest! Thermosphere : outer edge of atmosphere; HOT!; where satellites and space shuttles hang out.
- 4. Earth’s Atmosphere Atmospheric Pressure Atmosphere is held in place by Earth’s gravity Air pressure affected by elevation, humidity and temperature Altitude ↑ = air pressure ↓ Temperature ↑ = air pressure ↓ Humidity ↑ = air pressure ↓ Measured using a barometer
- 5. Earth’s Atmosphere Atmospheric Temperature As altitude changes, temperature varies Troposphere: decrease w/altitude Stratosphere: increase w/ altitude Mesosphere: decrease w/ altitude Thermosphere: increase w/ altitude
- 6. Copyright © by Holt, Rinehart and Winston. Reproduced under educational fair use policy.
- 7. Earth’s Atmosphere Water is constantly cycled throughout Earth in various forms; solid (ice), liquid (water), gas (water vapor/steam) The Water Cycle Copyright © by Holt, Rinehart and Winston. Reproduced under educational fair use policy.
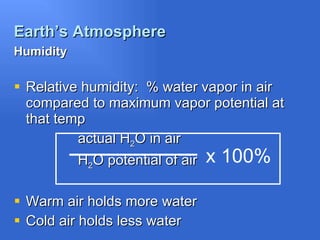
- 8. Earth’s Atmosphere Humidity Relative humidity: % water vapor in air compared to maximum vapor potential at that temp actual H 2 O in air H 2 O potential of air Warm air holds more water Cold air holds less water x 100%
- 9. Earth’s Atmosphere Dew Point Temperature which air must be cooled to in order for water vapor to condense into liquid If relative humidity is 100% then dew point = actual temperature
- 10. Earth’s Atmosphere Condensation Process by which a gas turns into liquid Water vapor condenses as air temperatures cool Condensation is visible in the form of CLOUDS Clouds form as warm, moist air rises
- 11. Earth’s Atmosphere Cloud Types Cumulus : puffy, white with flat bottoms (vertical motion) Stratus : layered, low altitude (horizontal motion) Cirrus : thin, feathery, white, high altitude Copyright © by Holt, Rinehart and Winston. Reproduced under educational fair use policy.
- 12. Earth’s Atmosphere Clouds and Weather Poor weather: Cumulus and stratus produce precipitation Root word “nimbus” or “nimbo” indicate clouds that produce precipitation Cumulonimbus- thunderstorms and severe weather Nimbostratus- light, long-lasting precipitation Fair weather: Cirrus indicate good weather
- 13. Global winds Why does air move? Differences in pressure! On global scale, air rises at the equator and sinks at the poles creating high pressure at the poles and low pressure at the equator- Remember convection??? Pressure belts every 30 °- bands of high and low pressure
- 14. Global winds Pressure belts Copyright © by Holt, Rinehart and Winston. Reproduced under educational fair use policy .
- 15. Global winds Coriolis Effect Coriolis Effect: curving of the path of currents due to Earth’s rotation Both air and water are subject to this Earth’s winds do not blow in straight paths, instead they are deflected. Clockwise in Northern Hemisphere Counterclockwise in Southern Hemisphere
- 16. Global winds Coriolis Effect Copyright © by Holt, Rinehart and Winston. Reproduced under educational fair use policy.
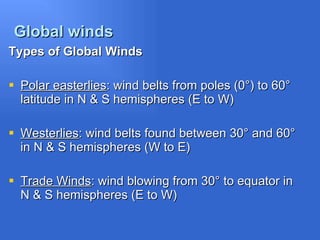
- 17. Global winds Types of Global Winds Polar easterlies : wind belts from poles (0 °) to 60 ° latitude in N & S hemispheres (E to W) Westerlies : wind belts found between 30° and 60° in N & S hemispheres (W to E) Trade Winds : wind blowing from 30° to equator in N & S hemispheres (E to W)
- 18. Global winds Copyright © by Holt, Rinehart and Winston. Reproduced under educational fair use policy .
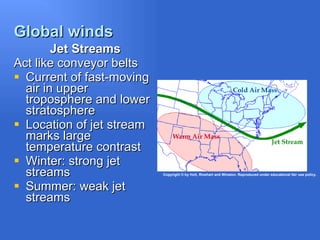
- 19. Global winds Jet Streams Act like conveyor belts Current of fast-moving air in upper troposphere and lower stratosphere Location of jet stream marks large temperature contrast Winter: strong jet streams Summer: weak jet streams Copyright © by Holt, Rinehart and Winston. Reproduced under educational fair use policy.
- 20. Global Winds Climate zones/Biomes Low- latitude: equator- 25 °N & S Rainforest : high humidity, heavy precipitation, constant high temperatures. Ex: Amazon, Congo, Indonesia Savanna : seasonal changes from wet to dry, and hot to slightly cooler. Ex: India, S. Africa, S. America Desert : low humidity, low precipitation, high day temp, lower night temp. Ex: N & S Africa, Mexico, Australia Copyright 2008 Worldplanetbiomes.org. Reproduced under educational fair use policy
- 21. Global winds Climate zones/Biomes Mid-latitude: 30 °-55° N & S Steppe : grasslands, semi-arid, warm/hot summer, cold winter. Ex: Great Plains, Gobi Desert Mediterranean (Chaparral): wet winter, dry summer. Ex: California, Mediterranean, Chile, Cape Town Grasslands : Dry, cold winter, warm summer. Ex: great Basin, interior Europe Deciduous Forest : Huge temp swings from summer to winter, wet. Ex: eastern US, Canada, Korea, Japan, Eastern Europe Copyright 2008 Worldplanetbiomes.org. Reproduced under educational fair use policy
- 22. Global winds Climate zones/ Biomes High-latitude climates Taiga : interior, long frigid winter, short cool summer, little precip., largest temp range of any zone. Ex: Alaska, Canada, N Europe, Siberia Tundra: coastal, long cold winter, short mild season, very little precipitation. Ex: Hudson Bay, Greenland Alpine : cool/cold, mountains/high plateaus, moderate temperatures similar to surrounding zones. Ex: Rocky Mountains, Alps, Himalayas, Andes Copyright 2008 Worldplanetbiomes.org. Reproduced under educational fair use policy
- 23. Global winds Climate zones/Biomes
- 24. Local winds High Pressure Systems (Anticyclones) Located where measured air pressure is highest compared to surroundings A high pressure center is indicated on a weather map by a blue "H". Winds flow clockwise around a high pressure center in the northern hemisphere and counterclockwise in the southern hemisphere Sinking air prevents cloud formation and precipitation- fair weather
- 25. Local winds Low Pressure Systems (Cyclones) Located where measured air pressure is lowest compared to surroundings A low pressure center is indicated on a weather map by a red "L“ Winds flow counterclockwise around a low in the northern hemisphere and clockwise in the southern hemisphere. Rising air facilitates development of clouds and precipitation
- 26. Local winds High and Low Pressure Systems on a weather map Copyright © by Holt, Rinehart and Winston. Reproduced under educational fair use policy.
- 27. AIR MASSES: Large bodies of air - have similar temperature and moisture properties
- 28. Five basic types of air masses determine the USA's weather. They can bring anything from scorching heat to bone-chilling cold depending on the type of air mass. These air masses are: Continental Arctic (cA): Extremely cold temperatures and very little moisture. Continental polar (cP): Cool and dry, but not as cold as Arctic air masses. Maritime polar (mP): Cool and moist. Maritime tropical (mT): Warm temperatures with copious moisture. Continental Tropical (cT): Hot and very dry.
- 30. Fronts Clashing air masses spark weather events- the boundaries are known as FRONTS Cold front Cold air moves under warm air Moves from NW to SE Air behind cold front is colder and drier than the air it replaces Copyright © by Holt, Rinehart and Winston. Reproduced under educational fair use policy.
- 31. Fronts Characteristics associated with Cold Fronts Copyright © by Holt, Rinehart and Winston. Reproduced under educational fair use policy.
- 32. Fronts Warm Fronts Warm air moves over cold, dense air Move from SW to NE Air behind warm front is warmer and more humid than air it replaces Copyright © by Holt, Rinehart and Winston. Reproduced under educational fair use policy.
- 33. Fronts Characteristics associated with Warm Fronts Copyright © by Holt, Rinehart and Winston. Reproduced under educational fair use policy.
- 34. Fronts Cold and Warm Fronts Copyright © by Holt, Rinehart and Winston. Reproduced under educational fair use policy.
- 35. Severe Weather Thunderstorms Strong/severe storm that produces lightning and thunder Lightning: electric discharge up to 54,000 °F Thunder: shockwave produced by lightning Also produce hail, high winds, flash floods and tornadoes Copyright © by Holt, Rinehart and Winston. Reproduced under educational fair use policy.
- 36. Severe Weather Tornadoes What are they? Spinning column of air with high wind speeds and low pressure that touches the ground How do they form? Funnel cloud pokes out bottom of cumulonimbus cloud Becomes tornado when it touches ground How are they measured? Fujita Scale (1-5) based on damage Copyright © by Holt, Rinehart and Winston. Reproduced under educational fair use policy.
- 37. Severe Weather Hurricanes How do they form? Series of thunderstorms over tropical water Winds in different directions cause storms to spin Wind speeds range from 120-150 km/hr How are they measured? Saffir-Simpson Scale (1-5) based on winds and storm surge Copyright © by Holt, Rinehart and Winston. Reproduced under educational fair use policy.


