Location via proxy:   [ UP ]  
[Report a bug]   [Manage cookies]                
SlideShare a Scribd company logo

1

MEASURING THE DIGITAL WORLD


           The Internet Economy
          Gian Fulgoni
          Chairman
          comScore, Inc.

          March, 2009


Proprietary and Confidential Do not distribute without written permission from comScore

2

comScore’s Business:
Digital Marketing Intelligence


                                                                                          Leading Digital Marketing
                                                                                            Intelligence Platform
                                                                                          Digital Media and Commerce
                                                                                          Digital Media and Commerce

                                                                                                 Internet Plus


                            Traditional Media
                            Traditional Media

                                                                                                   +
                                                                                           Deep Consumer Insights
                                                                TV
                        Radio

                                                                                                   +
                                                                                           Competitive Intelligence


                                                                                                   +
                                                                                               Buying Behavior


                   Audience Measurement                                                     Audience Measurement


Proprietary and Confidential Do not distribute without written permission from comScore                                2

3

comScore Customer Knowledge Platform:
A 360°View of 2 Million Global Internet Users

                                 ■ Designed to be representative of the online population
                                 ■         Projectable to the total U.S. population
                                 ■         TRUSTe certified for information privacy & security

WEB VISITING & VIEWING                                                                                        DEMOGRAPHICS
– All Web Site/Page Click Stream                                                                              – Self-reported and validated
– Content Viewed                                                                                              – Appended Segments (e.g. Claritas,
– Search Engine Queries                                                                                         Acxiom)
– Keyword Used                                                                                                – Individual & Household Level


ONLINE TRANSACTIONS                                                                                           SURVEYS
– All Secure Session Activity                                                                                 – E-mail or Contextual “Pops”
– Purchases and Subscriptions                                                                                 – Behavior-activated Surveys
– Price Paid, Shipping & Handling,                                                                            – Observation of All Surveys Taken
  Promotions                                                                                                    Across All Suppliers
– Applications/Configurations

MARKETING STIMULI                                                               TV VIEWING                    OFFLINE PURCHASING
– Online Ads                                                                    –Link to Digital Set Top TV   – Linked using Name and Address
– Referral Links                                                                Data using name and address   – Client CRM Databases
                                                                                                              – Retailer Loyalty Card Data
                                                                                                              – IRI Scanner Panel Data


Proprietary and Confidential Do not distribute without written permission from comScore                                                             3

4

Online Population:
U.S. versus Rest of World


                                     Online Population                                                          Online Population
                                     Growth Over Time                                                            by Geography


                                                                                          Total   Rest of the
                                                                                                       World


                                                                                                        US

                                                                                          US


                                    There are approximately 1 Billion people online today; 83% are located outside the US.
                                    There are approximately 1 Billion people online today; 83% are located outside the US.


    Source: comScore World Metrix, July 2008

Proprietary and Confidential Do not distribute without written permission from comScore                                             4

5

There’s a New Number One Online


                                                                             Internet Users Age 15+ (MM)


                                                                                              China, Japan, Korea, and India combined to
                                                                                              China, Japan, Korea, and India combined to
                                                                                              represent 29% of the total Worldwide online
                                                                                              represent 29% of the total Worldwide online
                                                                                             population; this total is 76% larger than the US
                                                                                             population; this total is 76% larger than the US
                                                                                                            online population
                                                                                                            online population


        Source: comScore World Metrix, October 2008

Proprietary and Confidential Do not distribute without written permission from comScore                                                         5

6

Unique Visitors to Top Global Properties

                                                                                                                        Total Worldwide
                                                    US Audience                                   Non-US Audience
                                                                                                                      Unique Visitors (MM)

                                                                                                         83%                     722.5


                                                                                                     83%                     636.4


                                                                                                   77%              542.2


                                                                              63%                        271.0


                                                                         80%                         244.3

                                                                                                                            The top 10 Global Properties
                                                                                                                            The top 10 Global Properties
                                                                        73%                        236.8                     attract a majority of Unique
                                                                                                                             attract a majority of Unique
                                                                                                                            Visitors from outside the US
                                                                                                                            Visitors from outside the US
                                                                     55%                     174.4


                                                                 75%                       171.2


                                                                67%                       159.8


                                                              75%                    144.8

    Source: comScore World Metrix, July 2008

Proprietary and Confidential Do not distribute without written permission from comScore                                                                     6

7

The Economy’s Impact on eCommerce


Proprietary and Confidential Do not distribute without written permission from comScore

8

Validation of comScore Sales Data: Comparison of
  comScore to U.S. Department of Commerce


                                                   Quarterly U.S. eCommerce Sales Estimates
                                                   Quarterly U.S. eCommerce Sales Estimates
                                                                     Source: comScore and U.S. Department of Commerce (DOC)


                                                                                                                                   Q4 2008

                                                                                                                               $ Sales
                                                                                                                               DOC:      $37.1B
                                                                                                                               comScore: $39.3B

                                                                                                                               % Change vs. YA
                                                                                                                               DOC:       -4.9%
$Billions


                                                                                                                               comScore: -3.5%


                                             comScore Estimate = (Total Non-Travel – Event Tickets + Estimated Auction Fees)
                                                  Excludes travel and event tickets, but includes auction fees and autos
     Proprietary and Confidential Do not distribute without written permission from comScore                                                      8

9

2008 eCommerce Growth Substantially Lower than
Preceding Years


                                                              Online Consumer Dollar Sales Growth
                                                              Online Consumer Dollar Sales Growth
                                                        Excluding Auctions, Autos and Managed Travel ($Billions)
                                                        Excluding Auctions, Autos and Managed Travel ($Billions)

                                                                                                  Source: comScore
                                                                                                                                                    +7%

                                                                                                                                      +17%          $221
                                                                                                                                      $200
                                                                                                                        +20%

                                                                                                         +22%
                                                                                                                        $171                               +9%
                                                                                                                                             +12%

                                                                                           +26%          $143
                                                                                                                               +13%
                                                         +29%                         $117
                                                                                                                 +20%
                                                        $93
                                                                                                  +26%
                       $72                                               +33%
                                                                                                                                             +21%          +6%
  Travel                                                                                                                       +24%

                                                                                                                 +24%
                                                                          +26%                    +26%
   Non-
  Travel


 Proprietary and Confidential Do not distribute without written permission from comScore                                                                         9

10

Online sales growth decelerated throughout
2008 while retail sales were held up by
inflation (esp. energy) until Q4 2008

                                                                             Quarterly eCommerce Growth vs. YA
                                                                             Quarterly eCommerce Growth vs. YA
                                                                                                Source: comScore
                                                                                                                                Q4 Y/Y Growth by Category:
                                                                                                                                 Sport and Fitness: +16%
                                                                                                                                Consumer Electronics: +3%
                                                                                                                                 Apparel and Acces.: +2%
                                                                                                                                 Furniture & Home: -10%


                                                                            Quarterly Retail Sales Growth vs. YA
                                                                            Quarterly Retail Sales Growth vs. YA
                                                                                           (exc. Food Service and Auto)
                                                                                           (exc. Food Service and Auto)
                                                                                          Source: U.S. Department of Commerce
                                                                                                                                           Q4 Y/Y Growth by
                                                                                                                                              Retailer Types:
                                                                                                                                           Gen Merch: -2%
                                                                                                                                              Sports: -3%
                                                                                                                                           Electronics: -5%
                                                                                                                                           Dept Stores: -7%
                                                                                                                                             Clothing: -8%
                                                                                                                                            Furniture: -13%


Proprietary and Confidential Do not distribute without written permission from comScore                                                                         10

11

The Internet is important to at least 6 in 10 consumers,
with 50% citing an increase vs. year ago


                                                                                           Importance of Internet
                                                                                       Source: comScore Survey January 2009


         Q: How important has the Internet become                                                             Q: How has this changed versus
          in providing you with information to help                                                                    a year ago?
                you make buying decisions?


                                65%


                                                                                                                         50%
                                                                   Very Important
                                                                                                                                       Significantly Increased


                                                                   Slightly Important
                                                                                                                                       Somewhat Increased


                    Past 3 months                                                                                  Versus a year ago


 Proprietary and Confidential Do not distribute without written permission from comScore                                                                         11

12

Five in ten people are surfing the Internet more to deal
with stress due to the current state of the economy


                                             Q. Which of the following are you doing more of to deal
                                              with stress due to the current state of the economy?


                                                                                           Source: comScore Survey January 2009


 Proprietary and Confidential Do not distribute without written permission from comScore                                          12

13

As the economic hardship worsened in 2008, there was a
dramatic increase in people conducting
financial/economic-related searches across the web

                                 Number of Unique Searchers (MM) for Each Term: December 2008 vs. YA
                                                                                             Source: comScore


Y/Y %          +27%                               +58%                               +100%            +83%      +160%   +157%   +223%
change


  Proprietary and Confidential Do not distribute without written permission from comScore                                               13

14

Search engines, followed by online coupon sites, have
become very important to consumers when shopping


                                                                               Importance of Online Sites
                                                                                  Source: comScore Survey January 2009


                     Q: In the past 3 months, how important have the following sites become when shopping?

                   67%


                                                           54%


                                                                                           42%
                                                                                                               39%
                                                                                                                         35%


 Proprietary and Confidential Do not distribute without written permission from comScore                                       14

15

On the positive side, energy prices have plummeted,
but food and beverage prices continue to rise


                                                                  Percent Changes in Price versus Last Year
                                                                                          Source: U.S. Bureau of Labor Statistics


                                 21%


Proprietary and Confidential Do not distribute without written permission from comScore                                             15

16

People earning less than $50k have the highest
unemployment rate, while those earning $50k-$100k
are most concerned about losing their jobs

                                                                  Job Loss Concerns by Income Segments
                                                                  Source: comScore


                                                                          Q: Are you concerned about losing your job?


                                                                                                                   Extremely concerned
          27%                                                                                 36%
                                                                    40%
                                                                                                                   Somewhat concerned


                                                                                                                   Neither


                                                                                                                   Somewhat unconcerned


                                                                                                                   Extremely unconcerned


                                                                                                                  I have already lost my job


Source: comScore Survey January 2009
Proprietary and Confidential Do not distribute without written permission from comScore                                                        16

17

Two in ten people believe the U.S. economy will
improve in the next 3 months; but double that number
believe it will worsen

                                                           U.S. Economy Predictions by Income Segments
                                                                                       Source: comScore Survey January 2009


                               Q: In the next 3 months, do you think the U.S. economy will…


                       Under $50k                                         $50k - $99,999k                       $100k or more

                                24%                                                        28%
                                                                                                                      19%
                                                                                                                                Significantly/Slightly Improve


                                                                                                                                Significantly/Slightly Worsen


                                  42%                                                      42%                         46%
                                  -18%                                                     -14%                        -27%     Net Pessimistic


 Proprietary and Confidential Do not distribute without written permission from comScore                                                                         17

18

Was Q4 ‘08 the bottom? eCommerce sales in
January grew 2% vs YA; seasonally-adjusted
retail sales grew 1% from Dec. 08 to Jan. ‘09

                                                          eCommerce Sales (Billions $) and % Growth vs. YA
                                                          eCommerce Sales (Billions $) and % Growth vs. YA
                                                                                                 Source: comScore
                                                                                                 Source: comScore


                                        +25%

                                                                              +23%        +23%
                      +23%


                                                                                                      +19%
                                                            +17%
Billions ($)


                                                                                                                                   % Growth
                                                                                                                      +13%


                                                                                                               +11%


                                                                                                                             +6%


Proprietary and Confidential Do not distribute without written permission from comScore                                                       18

19

eCommerce Continues to Gain Market Share from
Retail Stores


                                        eCommerce and Retail Sales Growth in January 2009 vs. YA
                                                                                    Source: comScore for eCommerce &
                                                                               U.S. Department of Commerce for Retail (DOC)


                                                                                                               % change vs. YA

                                          eCommerce                      (source: comScore)                             +2%
                                          Retail (source: DOC)

                                          Retail & Food Service                                                         -10%

                                          Retail excl. Autos                                                             -7%

                                          Furniture & Home Furniture Stores                                             -14%

                                          Electronics Stores                                                             -8%

                                          Food & Beverage Stores                                                        +2%

                                          Apparel & Accessories Stores                                                  -10%

                                          Sporting Goods, Hobby, Book & Music                                            -6%
                                          Stores


Proprietary and Confidential Do not distribute without written permission from comScore                                          19

20

Spending growth slows in upper income segment
and strengthens in middle income segment


                                                Online Spending vs. YA by Income Segment
                                                Online Spending vs. YA by Income Segment
                                                                                              Source: comScore
                                                                                              Source: comScore


                                                                                               Online Retail          Bracket Share of
                                   Income Segment                                          Spending Chg. vs. YA        Online Retail
                                                                                                                    Spending in Jan ‘09
                                                                                          Q4 2008         Jan ‘09


                                 Under $50,000                                             -17%             -9%             19%


                                  $50,000 - $99,999                                        -10%              2%             46%


                                   $100,000 or more                                         17%              8%             34%


                                  Total                                                     -3%              +2%           100%


Proprietary and Confidential Do not distribute without written permission from comScore                                                   20

21

The North American
            Online Advertising Industry


Proprietary and Confidential Do not distribute without written permission from comScore

22

Growth in Online Advertising Slowed in 2008


                                                                        Total Online Advertising
                                                                        $ Billions and % Chg vs YA


                                                                                                   +23%    +18% +13%        +11%
                           7        +29% +24%                                          +27%          5.9     5.8             5.9
                                                                                                                     5.7
                           6                                                                 5.2
                                            4.9                      5.1
                           5
                           4
                           3
                           2
                           1
                           0
                                     Q1 07                     Q2 07                       Q3 07   Q4 07   Q1 08   Q2 08   Q3 08
                       Source: PricewaterhouseCoopers and the Internet Advertising Bureau (IAB)

 Proprietary and Confidential Do not distribute without written permission from comScore

23

Search Spending Continued to Grow Strongly Through
 Q2 2008, Accounting for 40%+ of all Online Ad
 Dollars

                                                                                    Total Search Advertising
                                                                                  $ Billions and % Change vs YA
 $8.00
                                                                                                                    +24%
                                                                                                           +30%
                                                                                              +30%                 $5.06
                                                                                +29%                       $4.71
                                        +37%                                                 $4.10
                                                                              $3.64
 $4.00                              $3.16


 $0.00
                                  H1 06                                   H2 06             H1 07         H2 07    H1 08


Proprietary and Confidential Do not distribute without written permission from comScore

24

Growth in Online Display Advertising Slowed in 2008
and Shifted Dramatically to Pay-for-Performance


                                                                        Total Online Display Advertising
                                                                                  (CPM + CPC)
                                                                          $ Billions and % Chg vs YA

                                                           $3.03 $3.01
                                               $2.93 $2.93
                                   $2.82 $2.86              +8% +5%
                             $2.70             +12% +9%
                           3       +19% +16%
                             +17%


                           2
                                   Q1 07 Q2 07 Q3 07 Q4 07 Q1 08 Q2 08 Q3 08
                                  Source: CMR
                                  Data include static and rich display but do not include paid search or video ads

      Nielsen reports that CPM-based display advertising in Q3 08 declined by -6% vs Y/A.


 Proprietary and Confidential Do not distribute without written permission from comScore

25

Challenges Emerging for Display Advertising


■ An expanding glut of online inventory that's putting further stress on
  prices and making it even harder to monetize content.
                                                    Ad Age 2009

■ CPMs for ad-network-sold ads are dropping, some by as much as 50%
  year-over-year, says a recent study from Pubmatic
                                                  MediaPost 2009

■ One issue Martin Nisenholtz [SVP of Digital Operations at New York Times
  Corporation] hammered home was the abundance of inventory coming
  from social networks, which has driven prices down
                                                   NY Times and paidcontent.org

■ Numerous factors have conspired to lower display ad prices in recent
  months. They include the glut of social network ad inventory, the rise of
  vertical ad networks, and doubts about the branding effectiveness of
  traditional IAB standard ad formats.
                                                   ClickZ


Proprietary and Confidential Do not distribute without written permission from comScore

26

The Right Metrics are Critical

            Cookie Deletion Understates Campaign ROI


Proprietary and Confidential Do not distribute without written permission from comScore

27

The Cookie Deletion Problem: Overstated Audiences
and Campaign Reach but Understated Frequency


A comScore Study of Yahoo and DoubleClick Cookies

  ■ 30% of Internet users delete their cookies in a month
               – This rate corroborated by independent studies from Belden, Jupiter and Nielsen

  ■ These deleters do so an average of 4 times a month
               – 5 different cookies for same site in a month on one computer

  ■ True for 1st party site cookies and 3rd party ad serving cookies
  ■ Cookie deletion creates major problems:
               – Up to 2.5 times overstatement of unique visitors in server logs
               – 2.5 times overstatement of reach and a similar understatement of frequency in ad
                 server log
               – Leads to an understatement of campaign ROI because one loses “visibility” into
                 cookied computers


Proprietary and Confidential Do not distribute without written permission from comScore

28

The Right Metrics are Critical:
            Clicks Understate Campaign ROI


Proprietary and Confidential Do not distribute without written permission from comScore

29

Decline in Online Ad Click-Through Rates


                                                            2.50%

          2.50%


          2.00%                                                                             In 2008, comScore measured
                                                                                            click rates as less than 0.1%

          1.50%
                                                                                    1.12%                                   2002
                                                                                                                            2006
          1.00%

                                                                                                        0.41%
          0.50%                                                                                                     0.20%


          0.00%
                                                       Rich Media                                  Non-Rich Media


 Sources: Doubleclick, eMarketer, Eyeblaster, ABI Research estimates


Proprietary and Confidential Do not distribute without written permission from comScore

30

Clicks on Display Ads Are a Misleading Metric
and Don’t Reflect Brand-Building Effects


  ■ Recommendation: Only use to evaluate direct
    response ad campaigns (or Search)
  ■ Clicks don’t reflect a campaign’s sales impact, nor
    the cumulative (latent) impact of ads
  ■ Clicks don’t tell you anything about brand building
    effects


Proprietary and Confidential Do not distribute without written permission from comScore   30

31

The Impact
            of Display and Search Advertising


Proprietary and Confidential Do not distribute without written permission from comScore

32

Measuring the Holistic Impact
of Online Ad Campaigns


  ■ 200+ studies conducted to assess the impact of Paid Search and
    Online ads on Online and offline sales
  ■ Real world analysis: comScore panelists divided into two matched
    groups (exposed and non-exposed to advertising)
               – Search only
               – Display ads only
               – Search and Display ads together
               – Neither

  ■ Passively measured behavior and / or surveys
               – Linked to in-store buying through CRM databases, retailer loyalty cards (we have
                      125 Million card dataset accessible), credit card data, IRI scanner panel


Proprietary and Confidential Do not distribute without written permission from comScore             32

33

Site visitation lift: not only is there significant impact within the 1st
week, with or without a click, but past the 1st week, there is
significant lift that would be missed by only counting clicks or
immediate actions

                                          Results from comScore Campaign Effectiveness Studies


                                                                              A dvertiser Site R each
                                                                                                                                         6.6%
                                                                                                                   5.8%
                                                                                          4.8%
                                                                                                                                  4.5%
                                                                                                           3.9%
                                          3.5%
                                                                                   3.1%
                         2.1%


                     % Lif t: 65.0%                                           % Lif t: 53.8%            % Lif t: 49.1%         % Lif t: 45.7%


                      Week o f f irs t                                     Weeks 1-2 af ter             Weeks 1-3 af ter       Weeks 1-4 af ter
                       ex p o s ure                                         f irs t ex p o s ure        f irs t ex p o s ure   f irs t ex p o s ure
                                                                                            Co ntro l      Tes t


Proprietary and Confidential Do not distribute without written permission from comScore                                                               33

34

Display ads don’t just increase site visiting: Trademark Searches
also continue to see a lift over the 4 weeks after exposure to an ad


                                          Results from comScore Campaign Effectiveness Studies


                                                          % Making a TM/Brand Search
                                                                                                                                     0.9%

                                                                                                                 0.7%
                                                                                                                              0.6%
                                                                                          0.5%
                                                                                                          0.5%
                                                                               0.4%
                                       0.3%
                       0.2%

                  % Lif t: 52.3%                                          % Lif t: 46.0%                % Lif t: 40.3%      % Lif t: 38.1%


                    Week o f f irst                                     Weeks 1-2 af ter                Weeks 1-3 af ter    Weeks 1-4 af ter
                     exp o sure                                         f irst exp o sure               f irst exp o sure   f irst exp o sure
                                                                                            Co ntro l     Test


Proprietary and Confidential Do not distribute without written permission from comScore                                                         34

35

Observing subsequent Search activity is important, because media
often works best when multiple approaches are used. Here we see
clear synergies between Search and Display in driving Online sales


                                                               % Making A Purchase on the Advertiser Site
                                                                             (Retail Only)                                       5.1%
                                                                                                        2.4%             1.9%
                                      1.0% 1.5%                                                 1.1%

                                        Display Only                                            Search Only             Search & Display
                                        % Lift: +42%                                            % Lift: +121%            % Lift: +173%

                                                                                          Online $$ per 000 Exposed
                                                                                                 (Retail Only)
                                                                                                                                 $6,107

                                                                                                        $2,724          $2,723
                                      $994 $1,263                                              $1,548

                                        Display Only                                             Search Only            Search & Display
                                        % Lift: +27%                                            % Lift: +76%             % Lift: +124%


                                                                                          Control                Test
Proprietary and Confidential Do not distribute without written permission from comScore                                                    35

36

Online is important but you can’t ignore offline buying either. The sales
lift generated offline by online advertising is significant and would
certainly not be captured by a CPC or cookie-based model


      Higher offline sales lifts are found for Search advertising vs. Display,
      but when combined, the synergy provides even more lift


                                                Incremental Impact on Offline Sales per (000) Exposed


Proprietary and Confidential Do not distribute without written permission from comScore                 36

37

The higher reach of Display ads often helps lift sales
more than Search


             The overall number of people reached by Display ads is
             typically much higher than Search
             As a result, even though the sales lift among those exposed to a
             Search ad is higher, the total dollar sales gained from Display
             ads is often larger than Search due to the smaller lift acting on a
             larger base

                                                                                   Incremental Impact on Offline Sales per
        % of Households Reached                                                                (000) Exposed                          Total Sales Lift Index

                                                                                          119%
                                                          81%                                                                    200
                                                                                                                                 200%                      198
                                                                                                                                                           198%
                                                                                                      82%

                                                                                                                                                100
                                                                                                                                               100%

    11%                          8%                                                                                 16%

                                                                                                                                Search &    Search Only Display Only
Search &  Search Only                                  Display                       Search and    Search Only   Display Only    Display
 Display                                                Only                           Display


Proprietary and Confidential Do not distribute without written permission from comScore

38

Summary of Findings
  ■ The high degree of cookie deletion renders most studies that rely
    on cookie-based metrics inaccurate:
               – As a measure of consumers’ behavioral response to advertising
               – As a measure of a campaign’s reach and frequency
               – As a measure of a campaign’s ROI
  ■ Panel-based measurement is needed.
  ■ The number of clicks on display ads is not an accurate predictor
    of the effectiveness of online display ads.
  ■ Display ads have a substantial branding impact:
               – Even with no clicks or minimal clicks, online display ads can generate
                 substantial lift in site visitation, trademark search queries, and lift in both
                 online and offline sales.
  ■ Higher offline sales lifts are found for search advertising vs.
    display, but when combined the synergy provides even more lift.

Proprietary and Confidential Do not distribute without written permission from comScore

39

Implications


■ Pay-for-performance display ad campaigns that are
  based on clicks are a bargain for the advertiser and a
  “give-away” for the publisher
■ Display ad campaigns should generally be considered
  as an overlay to search campaigns
■ More research needs to be conducted to evaluate the
  role of reach and frequency and creative in generating
  a ROI from display ad campaigns


Proprietary and Confidential Do not distribute without written permission from comScore

More Related Content

The Us Internet Economy

  • 1. MEASURING THE DIGITAL WORLD The Internet Economy Gian Fulgoni Chairman comScore, Inc. March, 2009 Proprietary and Confidential Do not distribute without written permission from comScore
  • 2. comScore’s Business: Digital Marketing Intelligence Leading Digital Marketing Intelligence Platform Digital Media and Commerce Digital Media and Commerce Internet Plus Traditional Media Traditional Media + Deep Consumer Insights TV Radio + Competitive Intelligence + Buying Behavior Audience Measurement Audience Measurement Proprietary and Confidential Do not distribute without written permission from comScore 2
  • 3. comScore Customer Knowledge Platform: A 360°View of 2 Million Global Internet Users ■ Designed to be representative of the online population ■ Projectable to the total U.S. population ■ TRUSTe certified for information privacy & security WEB VISITING & VIEWING DEMOGRAPHICS – All Web Site/Page Click Stream – Self-reported and validated – Content Viewed – Appended Segments (e.g. Claritas, – Search Engine Queries Acxiom) – Keyword Used – Individual & Household Level ONLINE TRANSACTIONS SURVEYS – All Secure Session Activity – E-mail or Contextual “Pops” – Purchases and Subscriptions – Behavior-activated Surveys – Price Paid, Shipping & Handling, – Observation of All Surveys Taken Promotions Across All Suppliers – Applications/Configurations MARKETING STIMULI TV VIEWING OFFLINE PURCHASING – Online Ads –Link to Digital Set Top TV – Linked using Name and Address – Referral Links Data using name and address – Client CRM Databases – Retailer Loyalty Card Data – IRI Scanner Panel Data Proprietary and Confidential Do not distribute without written permission from comScore 3
  • 4. Online Population: U.S. versus Rest of World Online Population Online Population Growth Over Time by Geography Total Rest of the World US US There are approximately 1 Billion people online today; 83% are located outside the US. There are approximately 1 Billion people online today; 83% are located outside the US. Source: comScore World Metrix, July 2008 Proprietary and Confidential Do not distribute without written permission from comScore 4
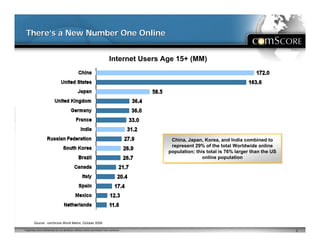
  • 5. There’s a New Number One Online Internet Users Age 15+ (MM) China, Japan, Korea, and India combined to China, Japan, Korea, and India combined to represent 29% of the total Worldwide online represent 29% of the total Worldwide online population; this total is 76% larger than the US population; this total is 76% larger than the US online population online population Source: comScore World Metrix, October 2008 Proprietary and Confidential Do not distribute without written permission from comScore 5
  • 6. Unique Visitors to Top Global Properties Total Worldwide US Audience Non-US Audience Unique Visitors (MM) 83% 722.5 83% 636.4 77% 542.2 63% 271.0 80% 244.3 The top 10 Global Properties The top 10 Global Properties 73% 236.8 attract a majority of Unique attract a majority of Unique Visitors from outside the US Visitors from outside the US 55% 174.4 75% 171.2 67% 159.8 75% 144.8 Source: comScore World Metrix, July 2008 Proprietary and Confidential Do not distribute without written permission from comScore 6
  • 7. The Economy’s Impact on eCommerce Proprietary and Confidential Do not distribute without written permission from comScore
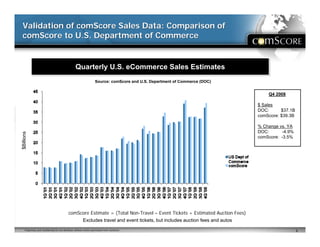
  • 8. Validation of comScore Sales Data: Comparison of comScore to U.S. Department of Commerce Quarterly U.S. eCommerce Sales Estimates Quarterly U.S. eCommerce Sales Estimates Source: comScore and U.S. Department of Commerce (DOC) Q4 2008 $ Sales DOC: $37.1B comScore: $39.3B % Change vs. YA DOC: -4.9% $Billions comScore: -3.5% comScore Estimate = (Total Non-Travel – Event Tickets + Estimated Auction Fees) Excludes travel and event tickets, but includes auction fees and autos Proprietary and Confidential Do not distribute without written permission from comScore 8
  • 9. 2008 eCommerce Growth Substantially Lower than Preceding Years Online Consumer Dollar Sales Growth Online Consumer Dollar Sales Growth Excluding Auctions, Autos and Managed Travel ($Billions) Excluding Auctions, Autos and Managed Travel ($Billions) Source: comScore +7% +17% $221 $200 +20% +22% $171 +9% +12% +26% $143 +13% +29% $117 +20% $93 +26% $72 +33% +21% +6% Travel +24% +24% +26% +26% Non- Travel Proprietary and Confidential Do not distribute without written permission from comScore 9
  • 10. Online sales growth decelerated throughout 2008 while retail sales were held up by inflation (esp. energy) until Q4 2008 Quarterly eCommerce Growth vs. YA Quarterly eCommerce Growth vs. YA Source: comScore Q4 Y/Y Growth by Category: Sport and Fitness: +16% Consumer Electronics: +3% Apparel and Acces.: +2% Furniture & Home: -10% Quarterly Retail Sales Growth vs. YA Quarterly Retail Sales Growth vs. YA (exc. Food Service and Auto) (exc. Food Service and Auto) Source: U.S. Department of Commerce Q4 Y/Y Growth by Retailer Types: Gen Merch: -2% Sports: -3% Electronics: -5% Dept Stores: -7% Clothing: -8% Furniture: -13% Proprietary and Confidential Do not distribute without written permission from comScore 10
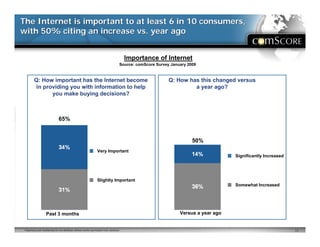
  • 11. The Internet is important to at least 6 in 10 consumers, with 50% citing an increase vs. year ago Importance of Internet Source: comScore Survey January 2009 Q: How important has the Internet become Q: How has this changed versus in providing you with information to help a year ago? you make buying decisions? 65% 50% Very Important Significantly Increased Slightly Important Somewhat Increased Past 3 months Versus a year ago Proprietary and Confidential Do not distribute without written permission from comScore 11
  • 12. Five in ten people are surfing the Internet more to deal with stress due to the current state of the economy Q. Which of the following are you doing more of to deal with stress due to the current state of the economy? Source: comScore Survey January 2009 Proprietary and Confidential Do not distribute without written permission from comScore 12
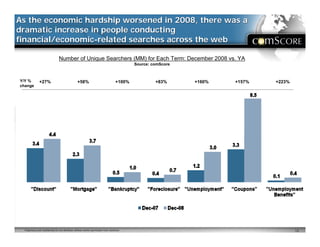
  • 13. As the economic hardship worsened in 2008, there was a dramatic increase in people conducting financial/economic-related searches across the web Number of Unique Searchers (MM) for Each Term: December 2008 vs. YA Source: comScore Y/Y % +27% +58% +100% +83% +160% +157% +223% change Proprietary and Confidential Do not distribute without written permission from comScore 13
  • 14. Search engines, followed by online coupon sites, have become very important to consumers when shopping Importance of Online Sites Source: comScore Survey January 2009 Q: In the past 3 months, how important have the following sites become when shopping? 67% 54% 42% 39% 35% Proprietary and Confidential Do not distribute without written permission from comScore 14
  • 15. On the positive side, energy prices have plummeted, but food and beverage prices continue to rise Percent Changes in Price versus Last Year Source: U.S. Bureau of Labor Statistics 21% Proprietary and Confidential Do not distribute without written permission from comScore 15
  • 16. People earning less than $50k have the highest unemployment rate, while those earning $50k-$100k are most concerned about losing their jobs Job Loss Concerns by Income Segments Source: comScore Q: Are you concerned about losing your job? Extremely concerned 27% 36% 40% Somewhat concerned Neither Somewhat unconcerned Extremely unconcerned I have already lost my job Source: comScore Survey January 2009 Proprietary and Confidential Do not distribute without written permission from comScore 16
  • 17. Two in ten people believe the U.S. economy will improve in the next 3 months; but double that number believe it will worsen U.S. Economy Predictions by Income Segments Source: comScore Survey January 2009 Q: In the next 3 months, do you think the U.S. economy will… Under $50k $50k - $99,999k $100k or more 24% 28% 19% Significantly/Slightly Improve Significantly/Slightly Worsen 42% 42% 46% -18% -14% -27% Net Pessimistic Proprietary and Confidential Do not distribute without written permission from comScore 17
  • 18. Was Q4 ‘08 the bottom? eCommerce sales in January grew 2% vs YA; seasonally-adjusted retail sales grew 1% from Dec. 08 to Jan. ‘09 eCommerce Sales (Billions $) and % Growth vs. YA eCommerce Sales (Billions $) and % Growth vs. YA Source: comScore Source: comScore +25% +23% +23% +23% +19% +17% Billions ($) % Growth +13% +11% +6% Proprietary and Confidential Do not distribute without written permission from comScore 18
  • 19. eCommerce Continues to Gain Market Share from Retail Stores eCommerce and Retail Sales Growth in January 2009 vs. YA Source: comScore for eCommerce & U.S. Department of Commerce for Retail (DOC) % change vs. YA eCommerce (source: comScore) +2% Retail (source: DOC) Retail & Food Service -10% Retail excl. Autos -7% Furniture & Home Furniture Stores -14% Electronics Stores -8% Food & Beverage Stores +2% Apparel & Accessories Stores -10% Sporting Goods, Hobby, Book & Music -6% Stores Proprietary and Confidential Do not distribute without written permission from comScore 19
  • 20. Spending growth slows in upper income segment and strengthens in middle income segment Online Spending vs. YA by Income Segment Online Spending vs. YA by Income Segment Source: comScore Source: comScore Online Retail Bracket Share of Income Segment Spending Chg. vs. YA Online Retail Spending in Jan ‘09 Q4 2008 Jan ‘09 Under $50,000 -17% -9% 19% $50,000 - $99,999 -10% 2% 46% $100,000 or more 17% 8% 34% Total -3% +2% 100% Proprietary and Confidential Do not distribute without written permission from comScore 20
  • 21. The North American Online Advertising Industry Proprietary and Confidential Do not distribute without written permission from comScore
  • 22. Growth in Online Advertising Slowed in 2008 Total Online Advertising $ Billions and % Chg vs YA +23% +18% +13% +11% 7 +29% +24% +27% 5.9 5.8 5.9 5.7 6 5.2 4.9 5.1 5 4 3 2 1 0 Q1 07 Q2 07 Q3 07 Q4 07 Q1 08 Q2 08 Q3 08 Source: PricewaterhouseCoopers and the Internet Advertising Bureau (IAB) Proprietary and Confidential Do not distribute without written permission from comScore
  • 23. Search Spending Continued to Grow Strongly Through Q2 2008, Accounting for 40%+ of all Online Ad Dollars Total Search Advertising $ Billions and % Change vs YA $8.00 +24% +30% +30% $5.06 +29% $4.71 +37% $4.10 $3.64 $4.00 $3.16 $0.00 H1 06 H2 06 H1 07 H2 07 H1 08 Proprietary and Confidential Do not distribute without written permission from comScore
  • 24. Growth in Online Display Advertising Slowed in 2008 and Shifted Dramatically to Pay-for-Performance Total Online Display Advertising (CPM + CPC) $ Billions and % Chg vs YA $3.03 $3.01 $2.93 $2.93 $2.82 $2.86 +8% +5% $2.70 +12% +9% 3 +19% +16% +17% 2 Q1 07 Q2 07 Q3 07 Q4 07 Q1 08 Q2 08 Q3 08 Source: CMR Data include static and rich display but do not include paid search or video ads Nielsen reports that CPM-based display advertising in Q3 08 declined by -6% vs Y/A. Proprietary and Confidential Do not distribute without written permission from comScore
  • 25. Challenges Emerging for Display Advertising ■ An expanding glut of online inventory that's putting further stress on prices and making it even harder to monetize content. Ad Age 2009 ■ CPMs for ad-network-sold ads are dropping, some by as much as 50% year-over-year, says a recent study from Pubmatic MediaPost 2009 ■ One issue Martin Nisenholtz [SVP of Digital Operations at New York Times Corporation] hammered home was the abundance of inventory coming from social networks, which has driven prices down NY Times and paidcontent.org ■ Numerous factors have conspired to lower display ad prices in recent months. They include the glut of social network ad inventory, the rise of vertical ad networks, and doubts about the branding effectiveness of traditional IAB standard ad formats. ClickZ Proprietary and Confidential Do not distribute without written permission from comScore
  • 26. The Right Metrics are Critical Cookie Deletion Understates Campaign ROI Proprietary and Confidential Do not distribute without written permission from comScore
  • 27. The Cookie Deletion Problem: Overstated Audiences and Campaign Reach but Understated Frequency A comScore Study of Yahoo and DoubleClick Cookies ■ 30% of Internet users delete their cookies in a month – This rate corroborated by independent studies from Belden, Jupiter and Nielsen ■ These deleters do so an average of 4 times a month – 5 different cookies for same site in a month on one computer ■ True for 1st party site cookies and 3rd party ad serving cookies ■ Cookie deletion creates major problems: – Up to 2.5 times overstatement of unique visitors in server logs – 2.5 times overstatement of reach and a similar understatement of frequency in ad server log – Leads to an understatement of campaign ROI because one loses “visibility” into cookied computers Proprietary and Confidential Do not distribute without written permission from comScore
  • 28. The Right Metrics are Critical: Clicks Understate Campaign ROI Proprietary and Confidential Do not distribute without written permission from comScore
  • 29. Decline in Online Ad Click-Through Rates 2.50% 2.50% 2.00% In 2008, comScore measured click rates as less than 0.1% 1.50% 1.12% 2002 2006 1.00% 0.41% 0.50% 0.20% 0.00% Rich Media Non-Rich Media Sources: Doubleclick, eMarketer, Eyeblaster, ABI Research estimates Proprietary and Confidential Do not distribute without written permission from comScore
  • 30. Clicks on Display Ads Are a Misleading Metric and Don’t Reflect Brand-Building Effects ■ Recommendation: Only use to evaluate direct response ad campaigns (or Search) ■ Clicks don’t reflect a campaign’s sales impact, nor the cumulative (latent) impact of ads ■ Clicks don’t tell you anything about brand building effects Proprietary and Confidential Do not distribute without written permission from comScore 30
  • 31. The Impact of Display and Search Advertising Proprietary and Confidential Do not distribute without written permission from comScore
  • 32. Measuring the Holistic Impact of Online Ad Campaigns ■ 200+ studies conducted to assess the impact of Paid Search and Online ads on Online and offline sales ■ Real world analysis: comScore panelists divided into two matched groups (exposed and non-exposed to advertising) – Search only – Display ads only – Search and Display ads together – Neither ■ Passively measured behavior and / or surveys – Linked to in-store buying through CRM databases, retailer loyalty cards (we have 125 Million card dataset accessible), credit card data, IRI scanner panel Proprietary and Confidential Do not distribute without written permission from comScore 32
  • 33. Site visitation lift: not only is there significant impact within the 1st week, with or without a click, but past the 1st week, there is significant lift that would be missed by only counting clicks or immediate actions Results from comScore Campaign Effectiveness Studies A dvertiser Site R each 6.6% 5.8% 4.8% 4.5% 3.9% 3.5% 3.1% 2.1% % Lif t: 65.0% % Lif t: 53.8% % Lif t: 49.1% % Lif t: 45.7% Week o f f irs t Weeks 1-2 af ter Weeks 1-3 af ter Weeks 1-4 af ter ex p o s ure f irs t ex p o s ure f irs t ex p o s ure f irs t ex p o s ure Co ntro l Tes t Proprietary and Confidential Do not distribute without written permission from comScore 33
  • 34. Display ads don’t just increase site visiting: Trademark Searches also continue to see a lift over the 4 weeks after exposure to an ad Results from comScore Campaign Effectiveness Studies % Making a TM/Brand Search 0.9% 0.7% 0.6% 0.5% 0.5% 0.4% 0.3% 0.2% % Lif t: 52.3% % Lif t: 46.0% % Lif t: 40.3% % Lif t: 38.1% Week o f f irst Weeks 1-2 af ter Weeks 1-3 af ter Weeks 1-4 af ter exp o sure f irst exp o sure f irst exp o sure f irst exp o sure Co ntro l Test Proprietary and Confidential Do not distribute without written permission from comScore 34
  • 35. Observing subsequent Search activity is important, because media often works best when multiple approaches are used. Here we see clear synergies between Search and Display in driving Online sales % Making A Purchase on the Advertiser Site (Retail Only) 5.1% 2.4% 1.9% 1.0% 1.5% 1.1% Display Only Search Only Search & Display % Lift: +42% % Lift: +121% % Lift: +173% Online $$ per 000 Exposed (Retail Only) $6,107 $2,724 $2,723 $994 $1,263 $1,548 Display Only Search Only Search & Display % Lift: +27% % Lift: +76% % Lift: +124% Control Test Proprietary and Confidential Do not distribute without written permission from comScore 35
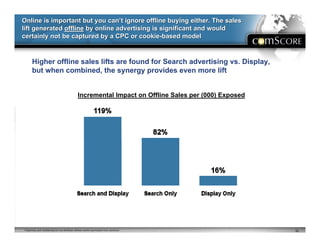
  • 36. Online is important but you can’t ignore offline buying either. The sales lift generated offline by online advertising is significant and would certainly not be captured by a CPC or cookie-based model Higher offline sales lifts are found for Search advertising vs. Display, but when combined, the synergy provides even more lift Incremental Impact on Offline Sales per (000) Exposed Proprietary and Confidential Do not distribute without written permission from comScore 36
  • 37. The higher reach of Display ads often helps lift sales more than Search The overall number of people reached by Display ads is typically much higher than Search As a result, even though the sales lift among those exposed to a Search ad is higher, the total dollar sales gained from Display ads is often larger than Search due to the smaller lift acting on a larger base Incremental Impact on Offline Sales per % of Households Reached (000) Exposed Total Sales Lift Index 119% 81% 200 200% 198 198% 82% 100 100% 11% 8% 16% Search &  Search Only Display Only Search &  Search Only Display  Search and  Search Only Display Only Display Display Only Display Proprietary and Confidential Do not distribute without written permission from comScore
  • 38. Summary of Findings ■ The high degree of cookie deletion renders most studies that rely on cookie-based metrics inaccurate: – As a measure of consumers’ behavioral response to advertising – As a measure of a campaign’s reach and frequency – As a measure of a campaign’s ROI ■ Panel-based measurement is needed. ■ The number of clicks on display ads is not an accurate predictor of the effectiveness of online display ads. ■ Display ads have a substantial branding impact: – Even with no clicks or minimal clicks, online display ads can generate substantial lift in site visitation, trademark search queries, and lift in both online and offline sales. ■ Higher offline sales lifts are found for search advertising vs. display, but when combined the synergy provides even more lift. Proprietary and Confidential Do not distribute without written permission from comScore
  • 39. Implications ■ Pay-for-performance display ad campaigns that are based on clicks are a bargain for the advertiser and a “give-away” for the publisher ■ Display ad campaigns should generally be considered as an overlay to search campaigns ■ More research needs to be conducted to evaluate the role of reach and frequency and creative in generating a ROI from display ad campaigns Proprietary and Confidential Do not distribute without written permission from comScore