The document discusses different types of data sets and various concepts related to data preprocessing. It describes common data types like records, relational data, and transaction data. It also defines key concepts in data preprocessing like data objects, attributes, handling missing/noisy data, data integration, reduction, transformation and discretization. The goal of these techniques is to clean, integrate and prepare raw data for analysis.
Data preprocessing involves cleaning, transforming, and reducing raw data to prepare it for analysis. It addresses issues like missing values, inconsistencies, noise and redundancy. Key tasks include data cleaning to detect and correct errors, data integration to combine related data from multiple sources, and data reduction to reduce dimensionality or data size for more efficient analysis while retaining important information. Techniques like wavelet transforms, principal component analysis and dimensionality reduction are commonly used for data reduction. Preprocessing aims to improve data quality and prepare it for downstream analysis tasks.
This document summarizes key concepts from Chapter 3 of the textbook "Data Mining: Concepts and Techniques". It discusses the importance of data preprocessing, which includes tasks like data cleaning, integration, reduction, and transformation. Specific techniques are described for handling missing/noisy data, data integration when combining multiple sources, and reducing dimensionality through feature selection or dimension reduction methods like PCA. The goal of preprocessing is to prepare raw data into a format suitable for data mining algorithms.
This document provides an overview of data preprocessing techniques discussed in Chapter 3 of the textbook "Data Mining: Concepts and Techniques". It covers topics such as data quality, data cleaning, data integration, data reduction, and data transformation. Data reduction techniques like dimensionality reduction aim to obtain a reduced representation of data that uses less space but produces similar analytical results. Dimensionality reduction methods include wavelet transforms, principal component analysis, and feature selection. Wavelet transforms decompose a signal into different frequency subbands and allow clusters to become more distinguishable at different resolution levels.
This document summarizes key concepts from Chapter 3 of the textbook "Data Mining: Concepts and Techniques". It discusses the importance of data preprocessing, which includes tasks like data cleaning, integration, reduction, and transformation. Specific techniques are described for handling missing/noisy data, data integration when combining multiple sources, and reducing dimensionality through feature selection or dimension reduction methods like PCA. The goal of preprocessing is to prepare raw data into a format suitable for data mining algorithms.
Data Preprocessing and Visualizsdjvnovrnververdfvdfationwokati2689
This document provides an overview of data preprocessing techniques discussed in Chapter 3 of the textbook "Data Mining: Concepts and Techniques". It covers topics such as data quality, data cleaning, data integration, data reduction, and data transformation. Data reduction techniques like dimensionality reduction aim to obtain a reduced representation of data that uses less space but produces similar analytical results. Dimensionality reduction methods include wavelet transforms, principal component analysis, and feature selection. Wavelet transforms decompose a signal into different frequency subbands and allow clusters to become more distinguishable at different resolution levels.
This document provides an overview of data preprocessing techniques discussed in Chapter 3 of the textbook "Data Mining: Concepts and Techniques". It covers topics such as data quality, data cleaning, data integration, data reduction, and data transformation. Data reduction techniques like dimensionality reduction aim to obtain a reduced representation of data that uses less space but produces similar analytical results. Methods like wavelet transforms and principal component analysis map data to a new space to emphasize clustered regions and remove outliers or unimportant attributes.
This document provides an overview of data preprocessing techniques discussed in Chapter 3 of the textbook "Data Mining: Concepts and Techniques". It covers topics such as data quality, data cleaning, data integration, data reduction, and data transformation. Data reduction techniques like dimensionality reduction aim to obtain a reduced representation of data that uses less space but produces similar analytical results. Dimensionality reduction methods include wavelet transforms, principal component analysis, and feature selection. Wavelet transforms decompose a signal into different frequency subbands and allow clusters to become more distinguishable at different resolution levels.
This document summarizes key concepts from Chapter 3 of the textbook "Data Mining: Concepts and Techniques". It discusses the importance of data preprocessing, which includes tasks like data cleaning, integration, reduction, and transformation. Specific techniques are described for handling missing/noisy data, data integration when combining multiple sources, and reducing dimensionality through feature selection or dimension reduction methods like PCA. The goal of preprocessing is to prepare raw data into a format suitable for data mining algorithms.
This document summarizes key concepts from Chapter 3 of the textbook "Data Mining: Concepts and Techniques". It discusses data preprocessing, which includes data cleaning, integration, reduction, and transformation. Data cleaning deals with handling missing, noisy, and inconsistent data. Data integration combines data from multiple sources. Data reduction reduces data volume for analysis through techniques like dimensionality reduction. Data transformation normalizes and discretizes values.
This document discusses data preprocessing and data warehouses. It explains that real-world data is often dirty, incomplete, noisy, and inconsistent. Data preprocessing aims to clean and transform raw data into a format suitable for data mining. The key tasks of data preprocessing include data cleaning, integration, transformation, reduction, and discretization. Data cleaning involves techniques like handling missing data, identifying outliers, and resolving inconsistencies. Data integration combines data from multiple sources. The document also defines characteristics of a data warehouse such as being subject-oriented, integrated, time-variant, and nonvolatile.
This document discusses data preprocessing techniques for data mining. It covers data cleaning, integration, reduction, transformation, and discretization. Data cleaning involves handling missing, noisy, and inconsistent data through techniques like filling in missing values, smoothing noisy data, and resolving inconsistencies. Data integration combines data from multiple sources. Data reduction reduces data size through dimensionality reduction, numerosity reduction, and compression. Dimensionality reduction techniques include wavelet transforms and principal component analysis.
The document discusses data preprocessing concepts from Chapter 3 of the book "Data Mining: Concepts and Techniques". It covers topics like data quality, major tasks in preprocessing including data cleaning, integration and reduction. Data cleaning involves handling incomplete, noisy and inconsistent data using techniques such as imputation of missing values, smoothing of noisy data, and resolving inconsistencies. Data integration combines data from multiple sources which requires tasks like schema integration and entity identification. Data reduction techniques include dimensionality reduction and data compression.
Data preprocessing involves cleaning, transforming, and reducing raw data to prepare it for modeling and analysis. The document discusses several key aspects of data preprocessing including:
- Why data preprocessing is important to improve data quality and ensure accurate analysis results.
- Common data issues like missing values, noise, inconsistencies that require cleaning. Techniques for cleaning include filling in missing data, identifying and handling outliers, and resolving inconsistencies.
- Methods for reducing data like binning, regression, clustering, sampling to obtain a smaller yet representative version of the data.
- The major tasks in preprocessing like data cleaning, integration, transformation, reduction and discretization which are aimed at handling real-world data issues.
Data Preprocessing can be defined as a process of converting raw data into a format that is understandable and usable for further analysis. It is an important step in the Data Preparation stage. It ensures that the outcome of the analysis is accurate, complete, and consistent.
This document contains a series of fill-in-the-blank sentences contrasting "this/that" and "these/those" in the near and far context. It provides examples of using these words to refer to singular and plural nouns that are either close by or farther away. The sentences cover a range of common nouns like apples, books, balls, chairs, cars, dogs, and others.
The document discusses techniques for decomposing software projects to aid in cost estimation. It describes decomposing by problem or process. Process decomposition breaks down framework activities like communication. For complex projects, communication can be broken into smaller tasks. The document also discusses software sizing methods, empirical estimation models, and making buy versus build decisions. It outlines manual and automated cost estimation techniques from project-level to activity-level estimates.
Clustering is an unsupervised learning technique that groups similar objects together. It involves grouping data points such that items in the same cluster are more similar to each other than items in different clusters. This document discusses and compares several clustering algorithms, including K-means, K-medoids, and hierarchical clustering. It also covers applications of clustering in domains such as marketing, astronomy, genomics, and more.
This document appears to be a lab report submitted by Saman Iftikhar for an advanced computer networks course. The report spans 15 pages and covers topics related to computer networks. No other contextual or summarizable information is provided in the document.
The document discusses the five senses and sense organs in humans. It describes how sensory cells receive stimuli from the environment and group together to form sense organs like the skin, nose, tongue, eye and ear. It then focuses on describing the skin in more detail, including its layers - the epidermis and dermis. It notes the functions of skin, including protection, temperature control, and its role as a sense organ for touch, pain, pressure, heat and cold. It discusses the key cell types and structures involved in the skin and sensory processes.
This document discusses operating system protection and security. It defines protection as controlling access to system resources and ensuring enforcement of access policies. The goals of protection are to ensure objects are only accessed correctly by allowed processes. Security focuses on malicious external threats, while protection handles internal access control. The document outlines various attacks, authentication methods, and types of malware like viruses, worms, and trojans. It also describes domain-based access control and implementation in UNIX using user IDs.
An exception occurs when the normal flow of a program is disrupted, such as dividing by zero or accessing an out-of-bounds array element. Exceptions are handled using try-catch blocks to catch specific exceptions or finally blocks to clean up resources. Methods can throw exceptions using the throw statement or specify thrown exceptions in the method declaration using throws. Programmers can also create custom exception classes by extending the Exception class.
Ethical principles in psychological researchsaman Iftikhar
This document discusses ethics in psychological research. It defines ethics as moral principles that govern behavior or activities. Ethics in psychology refers to correctly following rules to protect research participants from harm while respecting their rights. The American Psychological Association establishes guidelines for ethical research including obtaining informed consent, avoiding deception, protecting participants' safety, maintaining confidentiality, allowing withdrawal from studies, and debriefing participants after a study. Key ethical factors are avoiding pressure, ensuring safety, giving proper credit, and maintaining communication with participants.
The document presents a methodology for detecting polysemy tags in a tag set using WordNet and Wikipedia. The methodology retrieves tags and URLs from Delicious RSS feeds as an experimental dataset. Polysemy words in the tag sets are detected using WordNet definitions and Wikipedia pages. The results show that WordNet alone cannot detect all polysemy tags, but the addition of Wikipedia improves accuracy. The approach is evaluated based on the types of polysemy detected, and it is able to identify common types like contrastive and complementary polysemy but not rare types. Future work could focus on detecting more uncommon polysemy types.
The document outlines the 8 steps of the selection process: 1) blank application form, 2) preliminary interview, 3) employee testing, 4) employment interview, 5) reference checking, 6) medical examination, 7) decision making, and 8) induction. The selection process involves choosing qualified candidates through application forms, interviews, tests, and examinations to fill positions in an organization.
A pipeline is a series of processing elements where the output of one element is input to the next. Pipelines can operate sequentially or in parallel. Common types of pipelines include instruction pipelines in CPUs, graphics pipelines in GPUs, software pipelines using system calls, and HTTP pipelining. The key aspect of pipeline design is balancing stage processing times so the pipeline outputs finished items at the rate of its slowest stage. Reservation tables are used to visualize scheduling in pipelines. Multiprocessing uses multiple CPUs connected with shared memory and I/O to boost system speed, provide fault tolerance, and better match applications.
A context diagram shows the system boundaries and major information flows between external entities and the system. It indicates people, organizations, and systems that communicate with the system, and depicts the data received from and sent to the outside world. A context diagram is also known as a level 0 data flow diagram, showing the system's major processes, data flows, and data stores at a high level of abstraction. Examples of context diagrams are presented.
The document provides instructions for creating different objects in Microsoft Access: a table, form, report, query, and labels. It describes opening Access, using the design view to create a table with fields and data types, and entering data. It also lists the steps to use the form and report wizards to generate a form and report. Creating a query involves using the query wizard to select specific fields. Finally, it notes that labels can be generated by clicking on labels under the create option menu.
This document discusses flag usage in computing. It explains that the flag register contains 16 bits that show the status of operations, with 9 bits indicating the current status. There are status flags like carry, zero, and sign that reflect the outcome of arithmetic operations. Additionally, there are control flags that direct CPU operations. Examples are provided to illustrate how specific instructions affect the flags.
We are pleased to share with you the latest VCOSA statistical report on the cotton and yarn industry for the month of July 2024.
Starting from January 2024, the full weekly and monthly reports will only be available for free to VCOSA members. To access the complete weekly report with figures, charts, and detailed analysis of the cotton fiber market in the past week, interested parties are kindly requested to contact VCOSA to subscribe to the newsletter.
Data analytics is a powerful tool that can transform business decision-making across industries. Contact District 11 Solutions, which specializes in data analytics, to make informed decisions and achieve your business goals.
Hadoop Vs Snowflake Blog PDF Submission.pptxdewsharon760
Explore the key differences between Hadoop and Snowflake. Understand their unique features, use cases, and how to choose the right data platform for your needs.
Graph Machine Learning - Past, Present, and Future -kashipong
Graph machine learning, despite its many commonalities with graph signal processing, has developed as a relatively independent field.
This presentation will trace the historical progression from graph data mining in the 1990s, through graph kernel methods in the 2000s, to graph neural networks in the 2010s, highlighting the key ideas and advancements of each era. Additionally, recent significant developments, such as the integration with causal inference, will be discussed.
Why You Need Real-Time Data to Compete in E-CommercePromptCloud
In the fast-paced world of e-commerce, real-time data is crucial for staying competitive. By accessing up-to-date information on market trends, competitor pricing, and customer preferences, businesses can make informed decisions quickly. Real-time data enables dynamic pricing strategies, effective inventory management, and personalized marketing efforts, all of which are essential for meeting customer demands and outperforming competitors. Embrace real-time data to stay agile, optimize your operations, and drive growth in the ever-evolving e-commerce landscape. Get in touch for custom web scraping services: https://bit.ly/3WkqYVm
Why You Need Real-Time Data to Compete in E-Commerce
02Data updated.pdf
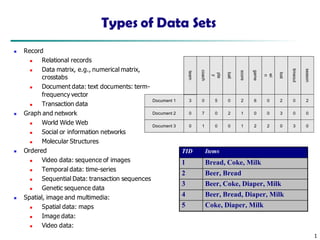
1. 1
Types of Data Sets
Record
Relational records
Data matrix, e.g., numerical matrix,
crosstabs
Document data: text documents: term-
frequency vector
Transaction data
Graph and network
World Wide Web
Social or information networks
Molecular Structures
Ordered
Video data: sequence of images
Temporal data: time-series
Sequential Data: transaction sequences
Genetic sequence data
Spatial, image and multimedia:
Spatial data: maps
Image data:
Video data:
Document 1
season
timeout
lost
wi
n
game
score
ball
pla
y
coach
team
Document 2
Document 3
3 0 5 0 2 6 0 2 0 2
0
0
7 0 2 1 0 0 3 0 0
1 0 0 1 2 2 0 3 0
TID Items
1 Bread, Coke, Milk
2 Beer, Bread
3 Beer, Coke, Diaper, Milk
4 Beer, Bread, Diaper, Milk
5 Coke, Diaper, Milk
2. 2
Data Objects
Data sets are made up of data objects.
A data object represents an entity.
Examples:
sales database: customers, store items, sales
medical database: patients, treatments
university database: students, professors, courses
Also called samples , examples, instances, data points,
objects, tuples.
Data objects are described by attributes.
Database rows -> data objects; columns ->attributes.
3. 3
Attributes
Attribute (or dimensions, features, variables):
a data field, representing a characteristic or feature
of a data object.
E.g., customer _ID, name, address
Types:
Nominal
Binary
Numeric: quantitative
Interval-scaled
Ratio-scaled
4. 4
Attribute Types
Nominal: categories, states, or “names of things”
Hair_color = {auburn, black, blond, brown, grey, red, white}
marital status, occupation, ID numbers, zip codes
Binary
Nominal attribute with only 2 states (0 and 1)
Symmetric binary: both outcomes equally important
e.g., gender
Asymmetric binary: outcomes not equally important.
e.g., medical test (positive vs. negative)
Convention: assign 1 to most important outcome (e.g., HIV
positive)
Ordinal
Values have a meaningful order (ranking) but magnitude between
successive values is not known.
Size = {small, medium, large}, grades, army rankings
5. 5
Numeric Attribute Types
Quantity (integer or real-valued)
Interval
Measured on a scale of equal-sized units
Values have order
E.g., temperature in C˚or F˚, calendar dates
No true zero-point
Ratio
Inherent zero-point
We can speak of values as being an order of
magnitude larger than the unit of measurement
(10 K˚ is twice as high as 5 K˚).
e.g., temperature in Kelvin, length, counts,
monetary quantities
6. 6
Discrete vs. Continuous Attributes
Discrete Attribute
Has only a finite or countably infinite set of values
E.g., zip codes, profession, or the set of words in a
collection of documents
Sometimes, represented as integer variables
Note: Binary attributes are a special case of discrete
attributes
Continuous Attribute
Has real numbers as attribute values
E.g., temperature, height, or weight
Practically, real values can only be measured and
represented using a finite number of digits
Continuous attributes are typically represented as
floating-point variables
7. 7
Data Quality: Why Preprocess the Data?
Measures for data quality: A multidimensional view
Accuracy: correct or wrong, accurate or not
Completeness: not recorded, unavailable, …
Consistency: some modified but some not, dangling, …
Timeliness: timely update?
Believability: how trustable the data are correct?
Interpretability: how easily the data can be
understood?
8. 8
Major Tasks in Data Preprocessing
Data cleaning
Fill in missing values, smooth noisy data, identify or remove
outliers, and resolve inconsistencies
Data integration
Integration of multiple databases, data cubes, or files
Data reduction (Reduced representation of the data set that is
much smaller in valumn)
Dimensionality reduction
Numerosity reduction
Data compression
Data transformation and data discretization
Normalization (smaller rang i.e.[0.0,1.0]
Concept hierarchy generation :- raw data values are replaced by
ranges
9. 9
Data Cleaning
Data in the Real World Is Dirty: Lots of potentially incorrect data,
e.g., instrument faulty, human or computer error, transmission error
incomplete: lacking attribute values, lacking certain attributes of
interest, or containing only aggregate data
e.g., Occupation=“ ” (missing data)
noisy: containing noise, errors, or outliers
e.g., Salary=“−10” (an error)
inconsistent: containing discrepancies in codes or names, e.g.,
Age=“42”, Birthday=“03/07/2010”
Was rating “1, 2, 3”, now rating “A, B, C”
discrepancy between duplicate records
Intentional (e.g., disguised missing data)
Jan. 1 as everyone’s birthday?
10. 10
Incomplete (Missing) Data
Data is not always available
E.g., many tuples have no recorded value for several
attributes, such as customer income in sales data
Missing data may be due to
equipment malfunction
inconsistent with other recorded data and thus deleted
data not entered due to misunderstanding
certain data may not be considered important at the
time of entry
not register history or changes of the data
Missing data may need to be inferred
11. 11
How to Handle Missing Data?
Ignore the tuple: usually done when class label is missing
(when doing classification)—not effective when the % of
missing values per attribute varies considerably
Fill in the missing value manually: tedious + infeasible?
Fill in it automatically with
a global constant : e.g., “unknown”, a new class?!
the attribute mean
the attribute mean for all samples belonging to the
same class: smarter
the most probable value: inference-based such as
Bayesian formula or decision tree
12. 12
Noisy Data
Noise: random error or variance in a measured variable
Incorrect attribute values may be due to
faulty data collection instruments
data entry problems
data transmission problems
technology limitation
inconsistency in naming convention
Other data problems which require data cleaning
duplicate records
incomplete data
inconsistent data
13. 13
How to Handle Noisy Data?
Binning
first sort data and partition into (equal-frequency) bins
then one can smooth by bin means, smooth by bin
median, smooth by bin boundaries, etc.
14. How to Handle Noisy Data?
Regression
smooth by fitting the data into regression functions
Clustering
detect and remove outliers
Combined computer and human inspection
detect suspicious values and check by human (e.g.,
deal with possible outliers)
14
15. 15
15
Data Integration
Data integration:
Combines data from multiple sources into a coherent store
Schema integration: e.g., A.cust-id. B.cust-#
Integrate metadata from different sources
Entity identification problem:
Identify real world entities from multiple data sources, e.g., Bill
Clinton = William Clinton
Detecting and resolving data value conflicts
For the same real world entity, attribute values from different
sources are different
Possible reasons: different representations, different scales, e.g.,
metric vs. British units
16. 16
16
Handling Redundancy in Data Integration
Redundant data occur often when integration of multiple
databases
Object identification: The same attribute or object
may have different names in different databases
Derivable data: One attribute may be a “derived”
attribute in another table, e.g., annual revenue
Redundant attributes may be able to be detected by
correlation analysis and covariance analysis
Careful integration of the data from multiple sources may
help reduce/avoid redundancies and inconsistencies and
improve mining speed and quality
17. 17
Correlation Analysis (Nominal Data)
Χ2 (chi-square) test
The larger the Χ2 value, the more likely the variables are
related
The cells that contribute the most to the Χ2 value are
those whose actual count is very different from the
expected count
Correlation does not imply causality
# of hospitals and # of car-theft in a city are correlated
Both are causally linked to the third variable: population
Expected
Expected
Observed 2
2 )
(
18. 18
Data Transformation
A function that maps the entire set of values of a given attribute to a
new set of replacement values s.t. each old value can be identified
with one of the new values
Methods
Smoothing: Remove noise from data
Attribute/feature construction
New attributes constructed from the given ones
Aggregation: Summarization, data cube construction
Normalization: Scaled to fall within a smaller, specified range
min-max normalization
z-score normalization
normalization by decimal scaling
Discretization: Concept hierarchy climbing
19. 19
Data Preprocessing
Data Preprocessing: An Overview
Data Quality
Major Tasks in Data Preprocessing
Data Cleaning
Data Integration
Data Reduction
Data Transformation and Data Discretization