1 Cinemark Holdings Inc. Simulated ERM Program .docx
- 1. 1 Cinemark Holdings Inc.: Simulated ERM Program Ben Li, Assistant Vice President of Compliance, is assigned the responsibility of developing an ERM program at Cinemark Holdings Inc. (CHI). Over the past year, Ben has put in place the following ERM activities: Risk Identification and Assessment The risk identification and assessment process steps are as follows: 1) Conduct online surveys of the heads of the 10 business segments and their 1-2 direct reports (15 people) and their mid-level managers (80 people). Exhibit 1 shows the instructions that are included in the online survey. Exhibit 2 shows samples of the information collected from the online survey. 2) Each of the 10 business segments separately organizes and compiles the results of the online survey. They typically compile a robust list of 70-80 potential key risks. Each business segment then prioritizes their top-5 risks and reports them to Ben Li,
- 2. resulting in a total of 50 key risks (a partial sample of the top-50 risk list is shown in Exhibit 3). 3) A consensus meeting is conducted where the 50 risks are shared with the top 10 members of senior management in an open-group setting at an offsite one- day event. The 50 risks are each discussed one at a time, after which the facilitator has the group collectively discuss and score them for likelihood and severity. The risk ranking is calculated as the likelihood score plus the severity score; the control effectiveness score is used to determine if there is room to improve the controls and is used in the risk decision making process step. The top-20 risks are identified as the key risks to CHI and are selected for additional mitigation and advanced to the risk decision making stage. A Heat Map (see Exhibit 4) is provided to assist in this effort. 4) The 30 risks remaining from the 50 discussed at the consensus meeting are considered the non- key risks, and these are monitored with key risk indicators to see if, over time, either the likelihood and/or severity is increasing to the level which would result in one of these being elevated to a key risk. Risk Decision Making Ben Li formed a Risk Committee to look at the risk identification and assessment information and to define CHI’s risk appetite and risk limits, which were defined as follows:
- 3. Risk Appetite CHI will maintain its overall risk profile in a manner consistent with our mission and vision and with the expectations of our shareholders. Risk Limits CHI will also avoid any individual risk exposures deemed excessive by its Risk Committee; the individual risk exposures will be determined separately for each key risk. CHI has zero tolerance for risks related to internal fraud or violations of the employee code of conduct. 2 Ben Li expanded the role of the Risk Committee to also select and implement the risk mitigation for each of the 20 key risks, at the same time as the committee determines the risk limits. The committee defines the risk limit for each key risk as the level that would lower the risk’s ranking to the level of a non-key risk. In addition, the Risk Committee designates Executive Risk Owners for each of the 20 key risks,
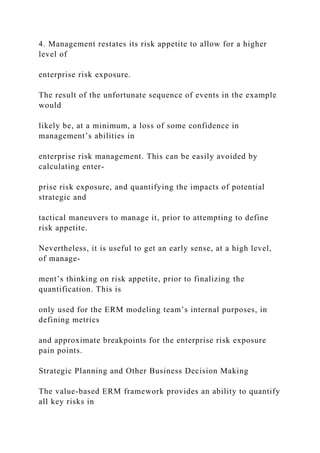
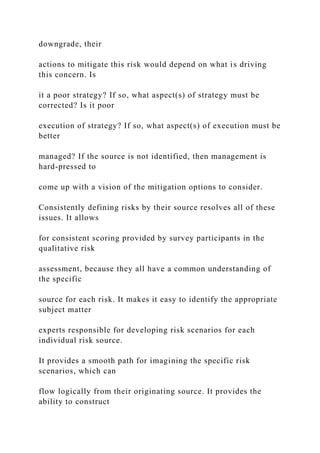
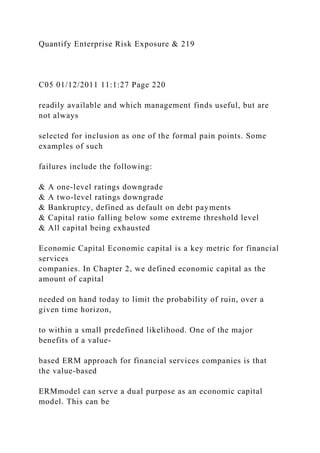
- 4. whose role is to continue to report information on risk exposures to the Risk Committee and to lead efforts to implement the risk mitigation determined by the Risk Committee. Risk Reporting The Risk Committee and the CHI Board of Directors periodically receive updates of the following items: 1) Heat Map (see Exhibit 4) 2) Definition of risk appetite and risk limits 3) Key Risk Dashboard; an example is shown below: Key Risk Dashboard Risk Description Employee turnover due to increased dissatisfaction with their work conditions (long shifts, low compensation, etc.) Executive Risk Owner: Natalie Turner (head of HR); Mike Bronner (head of Corporate Wellness) Risk Mitigation-in-Place 1) Employee complaints hotline (document HR- 65) 2) Incentive compensation guidelines (document HR-10-1.2)
- 5. Control Effectiveness Score: 3 (Prior score N/A*) Risk Identification and Assessment Business Segment: XD Theatres - Domestic Likelihood Score: 3 (Prior score N/A*) Severity Score: 2 (Prior score N/A*) Key Risk Indicators: 1) Number of employees quitting yearly 2) Number of complaints received through employee hotline 3) Salary of employees in same industry * This is the first ERM process cycle, so no prior scores are yet available. There are no other ERM-specific reports generated at CHI. 3 EXHIBIT 1: INSTRUCTIONS FOR RISK IDENTIFICATION AND ASSESSEMENT ONLINE SURVEY 1) Provide a list of all key risks to your area(s) of responsibility; in considering the risks, please include risks from any of the following types of risk: human
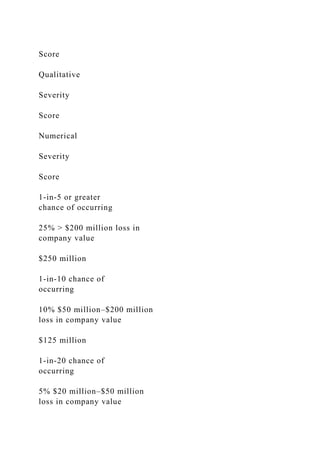
- 6. resources; technology; disasters; compliance; reputation risk; process risk; litigation; external fraud; market risk; credit risk; and liquidity risk. 2) For each risk, please do the following: a. Score the likelihood and severity using the L/S scoring criteria below b. Identify the risk owner(s) responsible for assuring effective risk controls c. List the controls or mitigation-in-place d. Score the control effectiveness using the C/E scoring criteria below e. Describe any post-risk-event action plans f. List the internal historical events that have occurred related to this risk, their impact on CHI, and the effectiveness of controls at that time L/S Scoring Criteria Score Chance of Occurring (within the coming year) Score Severity Score (Loss in Company Value*)
- 7. 5 ≥20% 5 ≥ 10% ($440M) 4 ≥10% and <20% 4 ≥5% ($220M) but <10% ($440M) 3 ≥5% and <10% 3 ≥2% ($88M) but <5% ($220M) 2 ≥2% and <5 2 ≥1% ($44M) but <2% ($88M) 1 <2% 1 <1% ($44M) * Assume CHI market cap is $4.4B and use this as a proxy for company value; company value is what we are worth if we achieve our baseline strategic plan. 4 C/E Scoring Criteria Score Control Effectiveness Score 5 Optimized: Part of an integrated risk control framework with continual updates and dynamic
- 8. ability to identify and remediate in real time 4 Monitored: Individual controls are in place with periodic updates, with most remediation needing to be done manually by management although there are some dynamic automation in place to identify and remediate 3 Standardized: Controls exist and are documented but there is no consistent system in place to identify and remediate when controls become ineffective 2 Informal: Controls exist but are not consistently documented and maintaining effective controls depends on informal or ad hoc actions by management 1 Unreliable: Controls do not exist 5 EXHIBIT 2: SAMPLE OF INFO COLLECTED FROM RISK ID & ASSESSEMENT ONLINE SURVEY Example of one risk provided by one survey participant:
- 9. Business Segment XD Theatres - Domestic Risk Employee turnover due to increased dissatisfaction with their work conditions (long shifts, low compensation, etc.) Likelihood Score 3 Severity Score 2 Executive Risk Owner(s) Natalie Turner (head of HR); Mike Bronner (head of Corporate Wellness) Controls in Place 3) Employee complaints hotline (document HR-65) 4) Incentive compensation guidelines (document HR-10-1.2) C/E Score 3 Post-risk-event action plans 1) Employee Assistance Program (EAP) (document HR-81) 2) Employee health and wellness training (document HR-90) 3) Training procedures for new employees (document HR-98) Past events, their impact, and control effectiveness Summary and Detailed Reports available upon request (contact Risk Owners)
- 10. Total Qual Score 5 (3 + 2) 6 EXHIBIT 3: PARTIAL LIST FROM Top-50 RISK LIST Risk # Description 1 Technology failure in displaying Star Wars: Secrets of the Empire at the Orlando VOID theatre, resulting in viral customer tweets discouraging people from trying out virtual reality theatres 2 Unexpected poor performance of a major film release, resulting in $20M revenue loss 3 Reputational damage resulting in $100M revenue loss 4 Worse-than-expected tornado season impacts Texas 5 Tampering with, and theft of, electronic data 6 Inability to meet CHI's long-term lease and debt obligations (which amount to approx. $1.8B) 7 Unexpected design flaw in the seats of D-Box theatres, resulting in $30M of repairs 8 Unexpected changes in foreign exchange rates
- 11. 9 Unexpected increase in minimum wages 10 Unexpected lawsuit related to alleged violation of U.S. Food and Drug Administration requirements on nutrition labeling of certain menu items 11 Unexpected ransomware attack on advertising servers at 50 major theatres, resulting in devastating reputational impact 12 Unexpected rise of political instability in Latin America 13 Unexpected delay in the release of movie “Godzilla: King of the Monsters” (planned release: May, 2019) 14 Mass shooting in a major Cinemark theatre, resulting in a $15M loss in sales 15 Unexpected decrease in the production of new films 16 Unexpected innovation introduces disruptive alternative film distribution channel, lowering theatre demand by 20% 17 Unexpected changes in film rental fees, resulting in a $15M increase in expenses 18 Lawsuit stemming from alleged violation of ADA regulations 19 Unexpected turmoil in equity market, resulting in $50M loss
- 12. 20 Disgruntled employee leaves CHI and steals personal customer information Etc. Etc. 7 EXHIBIT 4: HEAT MAP Risk 38 Risk 16 Risk 35 Risk 30 Risk 23
- 13. Risk 25 Risk 32 Risk 36 Risk 7 Risk 12 Risk 13 Risk 22 Risk 34 Risk 20 Risk 31 Risk 8 Risk 28 Risk 5 Risk 9 Risk 29 Risk 17 Risk 3 Risk 14 Risk 10
- 14. Risk 26 Risk 21 Risk 6 Risk 24 Risk 39 Risk 4 Risk 1 Risk 27 Risk 18 Risk 33 Risk 15 Risk 40 Risk 19 Risk 2 Risk 37 Risk 11 Risk 43 Risk 50
- 15. Risk 48 Risk 41 Risk 42 Risk 44 Risk 46 Risk 47 Risk 45 Risk 49 0 1 2 3 4 5 0 1 2 3 4 5 S e ve ri
- 16. ty Likelihood Cinemark Holdings - Heat Map FFIRS 12/22/2010 14:13:57 Page 1 Corporate Value of Enterprise Risk Management FFIRS 12/22/2010 14:13:57 Page 2 FFIRS 12/22/2010 14:13:57 Page 3 Corporate Value of Enterprise Risk Management The Next Step in Business Management SIM SEGAL John Wiley & Sons, Inc.
- 17. FFIRS 12/22/2010 14:13:57 Page 4 Copyright # 2011 by Sim Segal. All rights reserved. Published by John Wiley & Sons, Inc., Hoboken, New Jersey. Published simultaneously in Canada. No part of this publication may be reproduced, stored in a retrieval system, or transmitted in any form or by any means, electronic, mechanical, photocopying, recording, scanning, or otherwise, except as permitted under Section 107 or 108 of the 1976 United States Copyright Act, without either the prior written permission of the Publisher, or authorization through payment of the appropriate per-copy fee to the Copyright Clearance Center, Inc., 222 Rosewood Drive, Danvers, MA 01923, (978) 750-8400, fax (978) 646-8600, or on the Web� at� www.copyright.com.� Requests� to� the� Publisher� for� permission� should� be� addressed� to the Permissions Department, JohnWiley & Sons, Inc., 111 River Street, Hoboken, NJ 07030, (201)� 748-6011,� fax� (201)� 748-6008,� or� online� at� http://www.wiley.com/go/permissions. Limit of Liability/Disclaimer ofWarranty:While the publisher and author have used their best efforts in preparing this book, they make no representations or warranties with respect to the accuracy or completeness of the contents of this book and specifically disclaim any implied
- 18. warranties of merchantability or fitness for a particular purpose. No warranty may be created or extended by sales representatives or written sales materials. The advice and strategies contained herein may not be suitable for your situation. You should consult with a professional where appropriate. Neither the publisher nor author shall be liable for any loss of profit or any other commercial damages, including but not limited to special, incidental, consequential, or other damages. For general information on our other products and services or for technical support, please contact our Customer Care Department within the United States at (800) 762-2974, outside the United States at (317) 572-3993 or fax (317) 572-4002. Wiley also publishes its books in a variety of electronic formats. Some content that appears in print may not be available in electronic books. For more information about Wiley products, visit� our� web� site� at� www.wiley.com. Library of Congress Cataloging-in-Publication Data: Segal, Sim, 1964— Corporate value of enterprise risk management : the next step in business management / Sim Segal. p. cm. Includes index. ISBN 978-0-470-88254-2 (cloth); ISBN 978-1-118-02328-0 (ebk);
- 19. ISBN 978-1-118-02329-7 (ebk); ISBN 978-1-118-02330-3 (ebk) 1. Risk management. I. Title. HD61.S364 2011 658.1505—dc22 2010045243 Printed in the United States of America 10 9 8 7 6 5 4 3 2 1 www.copyright.com http://www.wiley.com/go/permissions www.wiley.com FTOC 12/29/2010 9:39:8 Page 5 Contents Foreword ix Preface xi Acknowledgments xix PART I: BASIC ERM INFRASTRUCTURE Chapter 1: Introduction 3 Evolution of ERM 4 Basel Accords 4 September 11th 5 Corporate Accounting Fraud 7 Hurricane Katrina 9 Rating Agency Scrutiny 10 Financial Crisis 11 Rare Events 13
- 20. Long-Term Trends 14 Challenges to ERM 15 Summary 16 Notes 16 Chapter 2: Defining ERM 18 Definition of Risk 18 Definition of ERM 24 Summary 58 Notes 59 Chapter 3: ERM Framework 61 Value-Based ERM Framework 63 Challenges of Traditional ERM Frameworks 63 v FTOC 12/29/2010 9:39:8 Page 6 Value-Based ERM Framework 65 Overcoming the Challenges by Using a Value-Based ERM Framework 83 Summary 109 Notes 110 PART II: ERM PROCESS CYCLE Chapter 4: Risk Identification 113 Components of Risk Identification 113 Five Keys to Successful Risk Identification 114
- 21. Risk Categorization and Definition 114 Qualitative Risk Assessment 129 Emerging Risk Identification 153 Killer Risks 155 Summary 166 Notes 167 Chapter 5: Risk Quantification 168 Practical Modeling 169 Components of Risk Quantification 174 Calculate Baseline Company Value 174 Quantify Individual Risk Exposures 185 Quantify Enterprise Risk Exposure 207 Summary 223 Notes 224 Chapter 6: Risk Decision Making 226 Defining Risk Appetite and Risk Limits 227 Integrating ERM into Decision Making 239 Summary 269 Notes 270 Chapter 7: Risk Messaging 271 Internal Risk Messaging 271 External Risk Messaging 280 Summary 292 Notes 293 vi & Contents FTOC 12/29/2010 9:39:8 Page 7
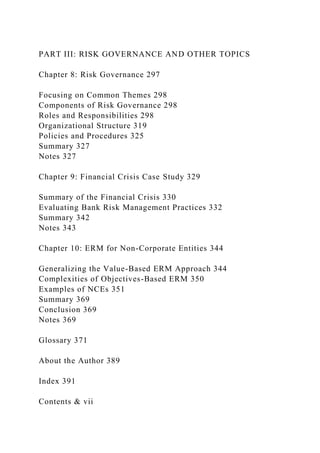
- 22. PART III: RISK GOVERNANCE AND OTHER TOPICS Chapter 8: Risk Governance 297 Focusing on Common Themes 298 Components of Risk Governance 298 Roles and Responsibilities 298 Organizational Structure 319 Policies and Procedures 325 Summary 327 Notes 327 Chapter 9: Financial Crisis Case Study 329 Summary of the Financial Crisis 330 Evaluating Bank Risk Management Practices 332 Summary 342 Notes 343 Chapter 10: ERM for Non-Corporate Entities 344 Generalizing the Value-Based ERM Approach 344 Complexities of Objectives-Based ERM 350 Examples of NCEs 351 Summary 369 Conclusion 369 Notes 369 Glossary 371 About the Author 389 Index 391 Contents & vii
- 23. FTOC 12/29/2010 9:39:8 Page 8 FBETW 01/05/2011 15:56:19 Page 9 Foreword IN MY FORMER ROLE leading Standard & Poor’s ERM evaluations,I visited with hundreds of executives from companies all over the worldand in all types of businesses, and discussed their ERM programs. I watched these ERM programs evolve, and witnessed their successes, and sometimes their colossal failures. Much more often than not, firms struggled both with having a clear objective for their ERM efforts and with the day- to-day problems of implementation. This perspective tells me that there is a tremendous need for clear thinking and clear exposition of the actions needed to practice ERM. The value-based approach that Segal developed, and introduces for the first time in this important book, definitely provides that clarity. Many other ERM
- 24. books merely outline the problem and leave the readers to figure out how to implement a solution on their own. Here you will find each and every step of ERM implementation clearly laid out for the practitioner to follow along. In addition, Segal’s approach to ERM: & Is robust, yet highly practical & Is able to quantify strategic and operational risks (this alone makes this book a worthwhile read) & Takes the mystery out of risk appetite, one of the most elusive ERM topics (two-thirds of those believing that defining risk appetite is critical to their ERM programs have not yet done so) & Supports better decision making This book is also highly accessible to every business leader. Segal’s writing style is smooth and in plain language. He offers crisp insights that can benefit everyone interested in ERM, from the ERM-savvy to the ERM novice.
- 25. ix FBETW 01/05/2011 15:56:19 Page 10 Finally, this book offers a very credible business case for adopting ERM. I have read nearly every book related to this topic, and I heartily recom- mend this one. This could well be the only ERM book you will ever need. —Dave Ingram, CERA Senior Vice President, Willis Re Former leader of Standard & Poor’s insurance ERM evaluations x & Foreword FPREF 01/05/2011 16:17:53 Page 11 Preface PURPOSE OF THE BOOK Adoption of enterprise risk management (ERM) programs is a strong and growing global trend. However, while ERM programs have a lot of potential,
- 26. traditional approaches to ERM often struggle to generate sufficient buy-in from internal stakeholders, such as business decision-makers. The primary reason for this is that traditional ERM approaches lack a business case for their adoption. In response to this difficulty, I developed the value- based ERM approach, and this book is its first in-depth presentation. The value-based ERM approach is designed to have a built-in business case for its adoption. At its core, it is a synthesis of ERM and value- based manage- ment. This synthesis provides the missing link between risk and return. It is this connection that transforms ERM into a strategic management approach that enhances strategic planning and other business decision making. As a result, the value-based ERM approach is seen by internal stakeholders—business segment leaders, senior management, and the board—as a way to help them
- 27. achieve their goals of profitably growing the business and increasing company value. The value-based ERM approach has several other advantages as well. It works equally well in all industry sectors. I have used this approach to help implement ERM programs for corporate entities in a wide range of sectors, such as manufacturing, energy, entertainment, technology, services, tele- communications, banking, and insurance, as well as for non- corporate entities, such as professional associations. The value-based ERM approach also works equally well regardless of geography or accounting system. In addition, the value-based ERM approach is an advanced yet practical approach to ERM. I have used this approach exclusively in my work as an ERM consultant, helping organizations to quickly, fully, and successfully implement their ERM programs.
- 28. xi FPREF 01/05/2011 16:17:53 Page 12 Finally, the value-based ERM approach also overcomes the three core challenges that prevent traditional ERM programs from achieving their full potential: 1. An inability to quantify strategic and operational risks 2. An unclear definition of risk appetite 3. A lack of integration into business decision making The value-based approach quantifies all types of risk: strategic, operational, and financial. This is often referred to as the ‘‘holy grail’’ of ERM. I am unaware of any other ERM approach that can fully quantify strategic and operational risks. In addition, the value-based ERM approach provides a clear, quantitative definition of risk appetite that can be used in the risk governance process.
- 29. Finally, the value-based ERM approach, due to its linkage between risk and return as well as its sheer practicality, fully integrates ERM information into decision making at all levels, from strategic planning to tactical decision making to transactions. I often am encouraged when I read introductions to allegedly new ERM information in articles, books, and seminars that tout an ERM approach that ‘‘adds value’’ to the business, only to end up disappointed when I find the same old traditional ERM approaches, which have no direct connection to value. In sharp contrast, this book presents an ERM approach that is centrally focused on measuring, protecting, and increasing company value. INTENDED AUDIENCE The primary audience for this book is corporate stakeholders, including: & Heads of ERM programs, such as chief risk officers (CROs) and their staff & Heads of internal audit
- 30. & Heads of compliance & Senior executives, such as CEOs and CFOs & Management, such as business segment leaders & Heads of strategic planning & Heads of human resources & Boards of directors, including chairs of audit committees and chairs of risk committees & Shareholders xii & Preface FPREF 01/05/2011 16:17:53 Page 13 & Rating agencies & Regulators Other audiences for this book include the following: & Stakeholders of non-profit organizations, such as charitable organizations and professional associations & Heads of government bodies & Financial planners and their customers & Professors of MBA/EMBA programs in Finance, and their students Corporate Audiences Heads of ERM programs, such as chief risk officers (CROs) and their
- 31. staff,will learn an advanced yet practical approach for either implementing an ERM program for the first time, or for enhancing an existing ERM program. They will learn an ERM approach that offers several advantages, such as: & Builds buy-in among the business segments, senior management, and the board & Satisfies all 10 key ERM criteria (which also serve as benchmarking criteria for any ERM program) & Avoids the five common mistakes of risk identification & Overcomes the three core challenges of traditional ERM programs by: & Quantifying strategic and operational risks in a consistent manner with financial risks & Clearly defining risk appetite in a way that it can be used in the risk governance process & Integrating ERM into key decision-making processes, including strate- gic planning, strategic and tactical decisions, and transactions & Satisfies rating agency ERM requirements & Satisfies regulatory risk disclosure requirements
- 32. Heads of internal audit and heads of compliance will learn how to quantify the value that they bring to the company, in terms of its direct impact on company value. They will also learn their ERM roles and responsibilities. Senior executives, such as CEOs and CFOs, will learn an ERM approach that can offer them the following advantages: Preface & xiii FPREF 01/05/2011 16:17:53 Page 14 & Improves the company’s shock resistance, making it more likely to achieve the strategic plan goals & Potentially leads to a higher stock price, resulting from a more effective set of tools for communicating with stock analysts & Potentially leads to a better rating by satisfying rating agency ERM requirements Management, such as business segment leaders, as well as heads
- 33. of strategic planning and heads of human resources, will learn an ERM approach that can offer them the following advantages: & Well-defined methodology to manage risk exposures to within risk appe- tite, and quantitative information that supports decisions on risk mitiga- tion alternatives & Better prioritization of limited resources, by focusing efforts on the most important risks and the most impactful component drivers of the key risk scenarios & Enhanced strategic planning process, with a more sophisticated and dynamic ability to project results for the baseline scenario as well as key risk scenarios, including upside and downside ranges of outcomes & Decision-making tool for selecting projects with the best risk–return profile for all types of routine decisions, including strategic planning, strategic and tactical decisions, and transactions & Enhanced business performance analysis, with metrics that reflect the
- 34. entire contribution to company value during the past period, and that correct a serious flaw in balanced scorecards & Improved incentive compensation plan, by (a) providing a firm basis for asserting that it is not a risky compensation plan subject to new SEC disclosure requirements; and (b) better aligning management and share- holder interests through correction of two suboptimal aspects of common compensation schemes Boards of directors, including chairs of audit committees and chairs of risk committees, will learn the following: & What questions they should be asking management about risk manage- ment practices & How to gain comfort that the key risks of the organization are well understood and effectively managed xiv & Preface
- 35. FPREF 01/05/2011 16:17:53 Page 15 & What their roles and responsibilities are regarding risk governance & How to satisfy SEC disclosure requirements on risk governance Shareholders will learn what they should expect from companies in which they invest, in terms of a robust ERM program to protect and grow company value. In addition, they will learn how to identify companies with superior abilities to manage risks, through an enhanced ability to interpret their risk disclosures. Rating agencies will learn what they should be including in their ERM evaluation criteria. In addition, they will learn an ERM approach that offers them enhanced prospective information about a company, including the likelihood that the company will properly execute its strategic plan. Regulators will learn what they should be requiring from companies to
- 36. better protect against bankruptcies, as well as shareholder losses generally. Other Audiences Stakeholders of non-profit organizations, such as charitable organi- zations and professional associations, in analogous roles to their corpo- rate counterparts listed earlier, will learn analogous lessons. Using a generalized version of the value-based ERM approach, these stakeholders will learn how to improve the chances of achieving their (usually multiple) goals. Heads of government bodies will learn how to apply the value- based ERM approach to their entities, and how this can better leverage their limited resources and help them achieve their strategic objectives. Financial planners and their customers will learn how the value- based ERM concepts can be applied to help individuals identify their key risks, robustly define their risk appetite, and better allocate
- 37. their assets among a range of financial products (such as investments and insurance), on an integrated basis, to increase the chances of achieving their personal goals. Professors of MBA/EMBA programs in Finance and their students will learn a full range of ERM concepts and how they are practically applied. This book is currently serving as the basis for an MBA/EMBA course I am teaching at Columbia Business School. Any professor wishing to use this book as a required text for a similar course will be provided with supplementary teaching materials, including the syllabus, lecture materials, exercises and solutions, and exams and solutions. Preface & xv FPREF 01/05/2011 16:17:53 Page 16
- 38. SUMMARY OF THE CONTENTS The book is divided into three sections: Part I: Basic ERM Infrastructure (Chapters 1–3) Part II: ERM Process Cycle (Chapters 4–7) Part III: Risk Governance and Other Topics (Chapters 8–10) Part I: Basic ERM Infrastructure (Chapters 1–3) Chapter 1, Introduction, highlights the major events over the past 10 years that contributed to the growing popularity of ERM. This provides the context for a better understanding of traditional ERM approaches and their short- comings, which are discussed in the following two chapters. The chapter concludes by discussing two major challenges to the ERM movement. It is important to clearly define ERM before delving into the heart of our discussions. ERM is a complex and wide-ranging topic. In addition, there is a lot of confusion in the market regarding what ERM is, and, as a result, there are
- 39. many disparate definitions. Finally, even the concept of risk itself is often understood in differing ways, because it is so common a term as to be taken for granted. We therefore devote the entirety of Chapter 2, Defining ERM, to first defining risk and then defining ERM in four ways: by a basic definition; in terms of the 10 key ERM criteria; by the four steps in the ERM process cycle; and by its fundamental benefits. The 10 key ERM criteria introduced in this chapter are a foundational element for this book, and are revisited frequently throughout. In addition, the 10 key ERM criteria can be used to benchmark any ERM program to determine its level of robustness. Chapter 3, ERM Framework, begins by discussing the failure of traditional ERM approaches to satisfy the 10 key ERM criteria and the three core challenges to these programs. The chapter then introduces the value-based ERM framework and discusses how it satisfies all 10 key ERM
- 40. criteria, and how it resolves the three core challenges of traditional ERM programs. The value- based ERM framework is central to all discussions that follow. Part II: ERM Process Cycle (Chapters 4–7) Chapter 4, Risk Identification, discusses the first step in the ERM process cycle. The three components of risk identification include risk categorization and definition; qualitative risk assessment; and emerging risk identification. Al- though risk identification is the first step in the ERM process cycle, traditional xvi & Preface FPREF 01/05/2011 16:17:53 Page 17 approaches are still suboptimal. This chapter discusses the five keys to success- ful risk identification. One of the five keys to success is defining risks by their source, a crucial building block that most organizations fail to construct
- 41. properly, leading to several difficulties with their ERM programs. In addition, several applications of the risk categorization and definition (RCD) tool are discussed. This chapter concludes with a discussion of two ‘‘killer risks.’’ Chapter 5, Risk Quantification, discusses the second step in the ERM process cycle. This chapter begins by stressing the importance of practical modeling, a critical characteristic of the value-based ERM approach. Next, this chapter discusses how to calculate the baseline company value—an internal calculation of company value consistent with the strategic plan. This is a key element of the value-based approach, which quantifies risks in terms of their potential impact on baseline company value. The chapter then discusses how to quantify individual risk exposures, revealing the secrets of how to quantify all types of risks, including strategic, operational, and financial. This is illustrated
- 42. with several case studies. The chapter closes with a discussion on how to quantify enterprise risk exposure, the aggregate measure of risk exposure at the enterprise level. This represents the distribution of possible outcomes, capturing combinations of multiple key risk scenarios occurring simultaneously, includ- ing their interactivity. Chapter 6, Risk Decision Making, discusses the third step in the ERM process cycle. The first decisions involve defining risk appetite (enterprise level tolerance limits) and risk limits (tolerance limits below enterprise level). The discussion reveals how to develop a clear, quantitative definition of risk appetite that can be used in the risk governance process. The chapter then discusses how to integrate ERM information into decision-making processes. This includes enhancing the strategic planning process and providing a universal protocol for all decisionmaking, whether related to risk
- 43. mitigation or to routine business, such as strategic planning, strategic and tactical decisions, or transactions. In the discussions of mitigation decisions, this chapter reveals how to quantify the value of mitigation in place, which can be used to illustrate the value of internal audit or the compliance department. Chapter 7, Risk Messaging, discusses the fourth and final step in the ERM process cycle. The first part of this chapter addresses internal risk messaging, which includes integration of ERM into business performance analysis and incentive compensation. One notable element of the business performance analysis discussion is how the value-based ERM approach can correct a fundamental flaw in balanced scorecards. The second part of this chapter discusses external risk messaging, which is about using ERM information for Preface & xvii
- 44. FPREF 01/05/2011 16:17:53 Page 18 communications with external stakeholders, including shareholders, stock analysts, rating agencies, and regulators. Part III: Risk Governance and Other Topics (Chapters 8–10) Chapter 8, Risk Governance, addresses three aspects of risk governance: roles and responsibilities; organizational structure; and policies and procedures. The roles and responsibilities are discussed for internal ERM stakeholders including corporate ERM; the ERM committee; risk experts; business segments; the board of directors; and internal audit. In the discussion of the roles and responsibilities of corporate ERM, an entire section is devoted to listing all the ways in which the value-based ERM approach helps achieve one of their most challenging responsibilities: building buy-in for the ERM program. Chapter 9, Financial Crisis Case Study, answers the question, ‘‘Because
- 45. banks massively failed, causing the global financial crisis that began in the United States in 2007, and they claim to have been using ERM, can ERM be any good?’’ The chapter begins with a summary of the financial crisis, and then proceeds to evaluate bank risk management practices against the 10 key ERM criteria to determine whether banks were actually practicing ERM. Chapter 10, ERM for Non-Corporate Entities, reveals how to generalize the value-based ERM approach for application to non-corporate entities, including non-profit organizations, such as charitable organizations and professional associations; government bodies; and individuals. The book concludes with a glossary of ERM terms. Web Site The following Web page provides additional resources for this book: www.simergy.com/ermbookresources.
- 46. The following Web site provides additional resources on ERM: www.simergy.com. xviii & Preface FLAST 12/29/2010 11:8:37 Page 19 Acknowledgments I WOULD FIRST LIKE to thank those who reviewed the draft manuscriptand provided feedback that improved the quality of this book. I wouldespecially like to recognize those whose contributions of time and effort were unusually generous, and to whom I am deeply indebted: Rich Lauria, Leslie Bauer, Adam Litke, Dale Hall, Michel Rochette, Hugo Rodrigues, and David Romoff provided numerous corrections and insights that enhanced both the content and readability of the text. In addition, I would like to thank Barbara Minto, inventor of the Minto Pyramid Principle and the author of The Minto Pyramid Principle: Logic in Writing, Thinking, & Problem Solving. The ease with which this book flows for
- 47. the reader is due to the Minto technique, which helps writers clarify their thinking and express concepts logically and smoothly. Finally, I would like to thank my publisher, John Wiley & Sons, and the outstanding editors with whom I have had the pleasure of working: Sheck Cho, Stacey Rivera, and Chris Gage. I would also like to thank Rachel Rabinowitz for introducing me to Wiley. xix FLAST 12/29/2010 11:8:37 Page 20 FLAST 12/29/2010 11:8:37 Page 21 Corporate Value of Enterprise Risk Management FLAST 12/29/2010 11:8:37 Page 22
- 48. C01 12/29/2010 9:49:22 Page 1 IPART ONE Basic ERM Infrastructure C01 12/29/2010 9:49:22 Page 2 C01 12/29/2010 9:49:22 Page 3 1CHAPTER ONE Introduction History is the sum total of the things that could have been avoided. Konrad Adenauer ENTERPRISE RISK MANAGEMENT, or ERM, is generally defined asfollows: The process by which companies identify, measure, manage, and disclose all key risks to increase value to stakeholders. One of the challenges with ERM lies in understanding what this defini- tion means. There are many interpretations, and some would say misinter-
- 49. pretations, of this short definition. In the next chapter, we will fully and properly define ERM. For now, consider ERM simply as an approach to treat risk holistically in an organization. 3 C01 12/29/2010 9:49:22 Page 4 EVOLUTION OF ERM ERMhas been gaining significantmomentum in recent years.Wewill discuss the following eight most important factors driving this trend, which are as follows: 1. Basel Accords 2. September 11th 3. Corporate accounting fraud 4. Hurricane Katrina 5. Rating agency scrutiny 6. Financial crisis 7. Rare events
- 50. 8. Long-term trends The first seven factors involve significant discrete events and are listed in chronological order, while the remaining factor includes trends that have developed gradually over time. Some of the discrete events originate from, or relate primarily to, the financial services sector. However, it is helpful for those in all sectors to understand these events because they are commonly known in ERM circles and their impacts on ERM are felt in all industry sectors. In addition, it is helpful to understand the chronology because the order of events has played a role in ERM development. The cumulative impact of events, and the regulatory and corporate responses to them, has led to the current environment for ERM. BASEL ACCORDS Basel II,1 an international guideline for risk management, influenced the
- 51. advancement of ERM practices in the financial services sector. The Basel Accords are guidelines developed by a group of global banking regulators in an attempt to improve risk management practices. Basel II, the second of two accords developed by the Basel Committee on Banking Supervision, was published in 2001. There are three pillars in Basel II: & Pillar 1: Minimum capital requirements & Pillar 2: Supervisory review & Pillar 3: Market discipline 4 & Introduction C01 12/29/2010 9:49:22 Page 5 Pillar 1 specifies methods to calculate capital requirements, offering standardized options based on industry averages and advanced options for more sophisticated banks based on their own internal models, customized to account for the specifics of the company, its businesses, and
- 52. its risks, and largely using management’s own estimates for most parameters. Pillar 2 allows for supervisors to review the bank’s risk management practices and risk exposures and, if necessary, apply a multiplier to increase the amount of minimum required capital calculated in Pillar 1. Pillar 3 addresses appropriate risk disclosures. The most important advancement since Basel I was the expansion of scope to include operational risks, moving banks in the direction of a holistic treatment of risk (although many other risks, including all strategic risks, are still excluded). In retrospect, it is easy to criticize and say that the Basel Committee failed in their goal, as evidenced by the global financial crisis that began in the United States in 2007. However, these accords were widely adopted and did represent an improvement from prior practices. Even if the Basel Accords fell short of their
- 53. goal to develop a standard benchmark for stellar risk management practices, they did however result in an enhanced focus on risk in the banking sector and beyond, as others held up the banking sector as a model for managing risk. Solvency II, a set of risk management standards for European Union (EU) insurance companies scheduled to take effect in November 2012, is clearly influenced by Basel II, and is largely analogous to it. SEPTEMBER 11TH The terrorist attacks on the United States on September 11, 2001, advanced our thinking in the area of ERM by raising awareness of four major aspects of risk: 1. Terrorism risk 2. Concentration risk 3. Risk complexity 4. Need for an integrated approach Terrorism Risk
- 54. Virtually all organizations are more aware of the possibility of a terrorist attack as a result of September 11th. Many of these organizations, particularly those September 11th & 5 C01 12/29/2010 9:49:22 Page 6 operating in or near major cities or potential terrorist targets, have also thought through various terrorism scenarios. They have examined the potential im- pacts of an attack impacting their physical assets, employees, customers, stakeholders, suppliers, and/or the economies in which they operate. These exercises have led to some preventive mitigation (such as decentralizing offices) as well as enhanced business continuity plans. An additional benefit is the general raising of awareness of the possibility of the previously unthinkable. This is helpful, since ERM requires management to keep an open mind to a
- 55. more complete range of future scenarios. Concentration Risk Even before September 11th, companies were aware of the danger of concen- trations of risk. For example, companies try to avoid depending too much on a single large customer or supplier; investing too much of their assets in any one sector; or having too much knowledge, power, or access concentrated with one employee. However, September 11th dramatically changed the way compa- nies, and governments, thought about concentration risk. The result was a complete rethinking of where and how resources are, or might become, exposed in a concentrated way to terrorism or other types of risk. Where are our most critical employees located? Where do we gather our most critical employees together? Where are the bulk of our invested assets geographically? Are any of our key customers or suppliers or other credit
- 56. counterparties exposed to significant concentration risk? One manifestation of this was many employers decentralizing their locations out of major landmark buildings and also out of major cities. Risk Complexity September 11th raised awareness of the complexity of risk. A complex set of interdependencies, which remains beneath the surface until a significant dis- ruption reveals it, became apparent in the aftermath of the attacks. There were numerous secondary impacts that were unexpected, or at least had not been examined until then. Though it may appear obvious now, few would have predicted how severely the airline business would be impacted. After all, statistically, even with a moderate increase in terrorism, flying is still far safer than other modes of travel. According to a study by Sivak and Flannigan published in the
- 57. January–February issue of American Scientist, even if a terrorist event equiv- alent to September 11th occurred every month, flying would still be safer 6 & Introduction C01 12/29/2010 9:49:22 Page 7 than driving.2 However, the human factor is a significant component of risk complexity. It is more difficult to account for fear and other irrational human tendencies, which often direct actions that are counter to our collective best interests. A Cornell University study found that an additional 725 people lost their lives in just the three months following September 11th as a result of a shift from flying to driving.3 Another type of risk complexity that was highlighted as a result of September 11th was that while there are mostly downside impacts from a horrible event, there are often upside impacts as well. For
- 58. example, anyone in the security business can tell you how much opportunities increased after the attacks. In addition, companies providing teleconferencing benefited as well, as business travel decreased dramatically. While this is not a new concept, again, the sheer scale of September 11th increased awareness that in considering a risk scenario, it is important to factor in the potentially offsetting upside impacts as well. Need for an Integrated Approach September 11th highlighted the need for an integrated approach to risk management. It moved the U.S. government closer to managing risks on a basis more consistent with ERM principles. The government reorganization in response to September 11th is analogous to the beginnings of an ERM program. They established the Department of Homeland Security, later
- 59. organized under the ODNI (Office of the Department of National Intelligence), which centralizes efforts regarding most risks facing the country. One of the key recognitions was that the government was in possession of intelligence which should have, or could have, prevented the attacks, but due to a lack of coordination, sharing, and prioritization of information, a disaster occurred. It is the same within companies. Many companies possess excellent infor- mation, but fail to realize their potential—both in terms of averting disasters as well as capitalizing on opportunities—due to a lack of integration between separate business segments. CORPORATE ACCOUNTING FRAUD In 2001 and 2002, a wave of accounting scandals rocked the business world. Enron, Tyco, and WorldCom were just three of the most prominent examples. These firms suffered dramatic financial collapses and had executives convicted
- 60. Corporate Accounting Fraud & 7 C01 12/29/2010 9:49:22 Page 8 and sentenced to prison. The names of these executives—Jeff Skilling, Ken Lay, Andrew Fastow, Dennis Kozlowski, and Bernie Ebbers—still send shudders down the spines of executives everywhere, nearly a decade later. In addition, Arthur Andersen, the audit firm for both Enron and WorldCom, went out of business as a result of the scandals. The fallout from all the accounting scandals included two significant events that led many companies to improve their risk management processes. The first event involved litigation, and increased the accountability of members of the board of directors and, more important, their personal financial liability, in the event of undetected corporate accounting fraud. In aWorldCom
- 61. lawsuit, a settlement was reported that involved 10 outside directors paying damages out of their personal assets amounting to approximately 20 percent of their net worth, and whichwere not allowed to be reimbursed by their directors and officers (D&O) liability insurance coverage. An Enron lawsuit settlement involved similar personal payments from directors. These settlements were significant in that they led to two major trends. First, serving on a board of directors became less attractive due to the increased liability. Many companies saw directors retiring from the board, and found it more difficult to recruit directors. The second, and more important trend for ERM, is that the remaining directors became more diligent about risk, and began asking management what was being done to protect the company against key risks. In many instances where companies have adopted ERM, it was precipitated by pressure on management from a member
- 62. of the board of directors. The second event involved legislation and enhanced the risk manage- ment practices of companies and their auditors in relation to ensuring the accuracy of external financial reports. In 2002, the U.S. Congress passed the Sarbanes-Oxley Act, also commonly referred to as SOX. Similar legislation was later adopted elsewhere, including Japan (J-SOX), France, Italy, and some other countries. This legislation required companies to establish a highly detailed and expensive process for identifying risks to, and establishing, documenting, and testing the effectiveness of risk controls for, the financial reporting process, and to have company executives formally attest to the accuracy of the financial reports. In an effort to comply with SOX, many companies adopted a modified version of the COSO Internal Control frame-
- 63. work developed in the early 1990s.4 Though SOX has been widely criticized as onerous and ineffective, it did raise corporate awareness of risk regarding financial reporting accuracy as well as more generally. Many companies used process maps to help identify 8 & Introduction C01 12/29/2010 9:49:22 Page 9 vulnerable areas (e.g., regarding the handoffs and access to data) in the reporting process, and some began to expand the use of process maps to identify risks and inefficiencies in other company processes as well. SOX also empowered employees to identify and address some new risks, as well as to raise, and get funding to resolve, some known issues. HURRICANE KATRINA The August 2005 hurricane that devastated the city of New Orleans taught us
- 64. many lessons regarding risk management, but two of them in particular have helped advance ERM practices in a way that is both lasting and significant. These lessons relate to: & Worst-case scenarios & Natural disasters Worst-Case Scenarios Like September 11th, Hurricane Katrina opened the imagination up to worst- case scenarios, even though they may be remote in likelihood. According to the U.S. Army Corps of Engineers, Hurricane Katrina was a 1- in-396-year event. The lesson here is to put more emphasis on the impact of risk scenarios, rather than on the likelihood. The likelihood may be very small, but it is more a matter of not exposing yourself to anything that can wipe you out completely. Natural Disasters
- 65. Up until relatively modern times, people have been largely exposed to the elements of nature. For example, before Benjamin Franklin invented the lightning rod in 1747, every city faced the very real possibility of entire neighborhoods burning down with each new lightning storm. Each new technological advance over the years has brought with it more power over our environment, as well as a growing sense of invulnerability. Katrina reminded us of our vulnerability to natural disasters and the fallibility of our best attempts to prevent or mitigate them. This was dramati- cally underscored in the wake of the powerful hurricane and the ensuing flooding, which showed the most powerful nation in the world unable to stem the virtual loss of a major city to nature. After Katrina, many companies began Hurricane Katrina & 9
- 66. C01 12/29/2010 9:49:22 Page 10 to incorporate more natural disaster scenarios in their ERM programs, and that practice continues today. RATING AGENCY SCRUTINY In October 2005, rating agency scrutiny of company ERM programs took a great leap forward. Standard & Poor’s (S&P) added ERM as an additional dis- tinct ratings category for their credit ratings of insurance companies, globally. Though the other major rating agencies did not follow their approach precisely, they did begin to highlight how they were addressing ERM, in response to questions raised as a result of S&P’s move. S&P’s ERM review advanced the global practices of ERM in four ways: 1. Rapid advancement 2. Continual evolution 3. Growth beyond requirements 4. Expansion to all sectors
- 67. Rapid Advancement Insurance companies moved, and moved quickly, to begin implementing an ERM program or enhance their existing ERM programs. S&P’s move was bold and brilliant from a marketing perspective. As a separate and distinct com- ponent of the overall rating, the ERM ‘‘grade’’ a company received would be publicly available. As a result, companies were highly motivated to get a good grade. S&P published their ERM ratings criteria in some detail, and companies used this as a guide for enhancing their ERM programs. Companies needed to be prepared in time for their next meeting with S&P, and since implementing ERM has a long lead time, many scrambled to prepare for the S&P ERM review. Continual Evolution Insurance companies began to enhance their ERM programs each year. S&P
- 68. made a strategic decision to raise the bar on the level of sophistication that would be required to maintain the ERM rating, and did so each year since the introduction of its initial ERM review criteria. Once companies achieved the ERM rating they desired, they quickly became even more concerned about the possibility of losing that rating, and what that might signal to bondholders 10 & Introduction C01 12/29/2010 9:49:22 Page 11 and shareholders alike. As a result, S&P helped encourage a continual evolu- tion of ERM programs at these companies. Growth beyond Requirements Insurance companies began to take ERM programs even further than S&P requirements. Once companies began to develop robust ERM programs, some of them began to tout how their ERM programs afforded them a
- 69. competitive advantage. Spurred on by a certain level of competition, others began to investigate how they too could use ERM for competitive purposes. Expansion to All Sectors Other sectors became, and continue to become, more aware of the need to advance their ERM programs. S&P enjoyed much success with their insurance ERM reviews, not only in terms of their moving the sector forward in ERM sophistication but also in terms of attention. S&P received a phenomenal level of press coverage for their innovative approach. This led to S&P announcing in May 2008 that they would enhance their ERM reviews as part of their credit ratings of non-financial companies. This is an important and much-needed development, because most non-financial sectors have been lagging in risk management practices as compared to the financial services sector. Although the
- 70. non-financial sector ERM review is not treated as a distinct ratings category like that in the insurance sector, even before its formal incorporation into the ratings process, these companies are becoming more aware of S&P’s ERM criteria, and are acknowledging the need to improve their risk management practices. FINANCIAL CRISIS The global financial crisis that began in the United States in 2007 has shaken up the status quo in the world of risk management and has opened the door for all companies to look at how to improve their ERM programs. First, the crisis has clearly laid false the claim by the banking sector that they had best-in-class risk management practices. This is important, because others in the financial services sector had been enamored with the banking approach and were of the opinion that all they had to do was mimic it. In Chapter 9 we describe what
- 71. banks were and were not doing in terms of ERM practices. In addition to witnessing the fall of the mighty in the banking sector, companies had their own direct experience in the crisis that, if they survived Financial Crisis & 11 C01 12/29/2010 9:49:22 Page 12 it (and many did not), served as a wake-up call. During the heart of the crisis, there was a lull in ERM advancement as individuals and companies were just scampering to survive. However, after the worst seemed to be over, companies in all sectors of the economy began to perform assessments of their ERM programs to determine priorities for enhancements. As before, the financial services sector is actively engaged. However, the non- financial services sector is also moving forward, some companies more quickly than others. In particular, Steve Dreyer, who leads S&P’s global
- 72. initiative to incorporate ERM into their credit ratings for non-financial services compa- nies, indicates that ‘‘coming out of the financial crisis, many companies in the consumer products sector enhanced their ERM activities, in part due to their experience with the financial crisis and its impact on their supply chain. Likewise, energy companies exposed to recession-driven low natural gas prices have focused more intently than ever on proactively managing exposure to commodity price movements.’’ Another important consequence of the financial crisis is that it is no longer as difficult for those involved in the ERM process to get management to consider worst-case scenarios. Living ‘‘in the tail’’—which refers to experiencing what was previously considered so unlikely an event that it would graphically reside in the extreme downside tail-end portion of the distribution curve illustrating
- 73. the range of possible events—has opened management’s imagination of what else can go badly, and how badly it can go. In addition, it is expected that fallout from the financial crisis in the forms of legislation, regulation, and litigation could have significant positive impacts on the advancement of ERM globally. At the time of the writing of this book, it is too early to determine these impacts. However, there are two consequences that are worth mentioning that have the potential to accelerate adoption of ERM programs: 1. SEC disclosure regulation 2. Dodd-Frank legislation SEC Disclosure Regulation In February 2010, the SEC passed a regulation requiring the disclosure of risk governance as well as risky compensation programs. These are both discussed in Chapter 7. Adopting an ERM program would help companies
- 74. comply with this regulation. The regulation may reveal the presence, or lack, of good risk 12 & Introduction C01 12/29/2010 9:49:22 Page 13 governance at companies. In addition, the regulation requires an ability to determine whether the incentive compensation program is risky, and this cannot effectively be done without a proper ERM program in place. Dodd-Frank Legislation In July 2010, the Dodd-Frank legislation became effective. Much of the legislation was written to merely empower regulators to design and implement new requirements, which will take awhile to emerge. However, there is one aspect of the bill that has the potential to advance ERM practices. The bill created a new entity, the Financial Stability Oversight Council, and empowered
- 75. it to make recommendations regarding new risk management requirements for financial institutions. RARE EVENTS In 2009, two threats resurfaced related to risk events so rare that they had not been taken seriously in modern times. Although these threats did not result in significant impacts, they played a part in helping management keep an open mind about rare events, which is important in ERM. The two threats were: 1. H1N1 flu pandemic 2. Pirates H1N1 Flu Pandemic For many years, scientists have been saying that it is only a matter of when, not if, we will experience a pandemic disease of similar virulence as the 1918– 1919 flu pandemic, or the Spanish Flu, when, according to the Center for
- 76. Disease Control (CDC), more than 2.5 percent of the global population died. Though many companies did include such scenarios in their ERM programs, most approached it with a bit of skepticism. This is no longer the case. As the 2009 flu season approached, there were significant fears that the impending H1N1 flu pandemic might be as deadly as the 1918 flu. Although it turned out to only be about as deadly as a typical seasonal flu, this experience changed attitudes. Before H1N1, the fact that an ‘‘old’’ date (1918) was attached to the deadly event made it seem more unlikely or unreal to us. Rare Events & 13 C01 12/29/2010 9:49:22 Page 14 Pirates Though not a particularly important factor, piracy is worth mentioning because it is another example of something that previously
- 77. seemed un- imaginable in modern times. However, in 2009, pirate attacks off the coast of Somalia received a lot of media attention and became a concern for the shipping industry and cruise lines. Before this occurred, if you raised this as a potential risk, the response would have been, ‘‘Pirates? Are you kidding?’’ Pirates evoke a far distant history of wooden ships and cannon. It had been over 100 years since the last attack on a U.S. ship by pirates. Yet, again, a remote (and ridiculous-sounding) risk event becoming reality is more fodder for ERM programs, which include exercises to identify emerging risks— risks currently not on the radar screen but that might become important in the future. Events such as this have made us more aware of the gap between our attitude before a remote event occurs and immediately afterwards, and how quickly our mind-set, and our reality, can change.
- 78. LONG-TERM TRENDS In addition to the events laid out chronologically earlier in the chapter, there are two other drivers of ERM adoption worth mentioning that have evolved over a long period of time. One is technological advancement. ERM requires a lot of computing power. Until recently, the run time for the required calcula- tions was prohibitively slow. However, the continued increase in processing speeds is now making ERM feasible, and companies are beginning to take advantage of this. Another driver is increased risk savvy in the business world and even in the general population. Until fairly recently, consumers of information have been content to receive ‘‘best-estimate’’ projections, be they earnings fore- casts or weather forecasts. However, in recent years, consumers have become more comfortable with the concept of volatility (the
- 79. best estimate does not always occur) and also more accustomed to receiving and process- ing multiple scenarios (ranges of possible results, either above or below best estimate). As a result, forecasts have taken a more sophisticated turn and commonly provide a range of possible or likely occurrences. For exam- ple, television weather forecasts of hurricanes routinely display a range of possible paths, often with color-coded probability ranges produced by so- phisticated weather models. Another example is media coverage of elections, 14 & Introduction C01 12/29/2010 9:49:22 Page 15 where analysts now present consumers with numerous detailed scenarios that might influence different results. CHALLENGES TO ERM
- 80. As a result of all the factors driving awareness and adoption of ERM programs, ERM is currently a hot topic, and has been for a few years. Most companies have begun adopting ERM, are considering adopting ERM, or are curious to learn more about ERM. Boards of directors are asking about it, and their management is actively seeking knowledge about it. Even non- profit organi- zations and government entities have an interest in ERM and how they can adapt it for their use. At companies implementing ERM, many have a formal full-time position of chief risk officer (CRO) to lead the development, imple- mentation, maintenance, and enhancement of the ERM program. In response to this demand, providers of products and services have been rapidly investing in growth to serve the growing ERM market. Conferences are adding ERM as a topic to their agenda or offering entire events dedicated solely to ERM. Universities are building ERM curricula for executives
- 81. as well as students, and are searching for both content and qualified professors. Consult- ing firms, audit firms, and technology providers are continually seeking to develop and expand their ERM products and services and are competing to hire ERM practitioners from the limited pool of qualified people. With all this momentum, it may seem inevitable that ERM will become a large and sustaining movement in the corporate world and beyond. However, there are two major challenges that currently threaten to derail the ERM movement: 1. Confusion over ERM providers 2. ERM programs falling short of expectations Confusion over ERM Providers The first challenge is confusion in the market over just what ERM is and who is offering valid ERM services. The rapid proliferation of providers of ERM products
- 82. and services has resulted in many ERM providers that narrowly define ERM in a way that plays to their limited set of products and services, which are usually risk management offerings that pre-date ERM. This confusion over what constitutes ERM may also lead to the tarnishing and eventual abandonment of the label ERM, although the valid underlying ERM concepts would live on Challenges to ERM & 15 C01 12/29/2010 9:49:22 Page 16 under a new name. Chapter 2 addresses this by providing a robust definition of ERM, which can be used to evaluate whether a company’s risk management program is, in fact, an ERM program. Another result of this confusion in the marketplace for ERM products and services is that it may dissuade some companies from adopting ERM. ERM Programs Falling Short of Expectations
- 83. The second challenge is that the majority of ERM programs are falling short of expectations. There is no consensus yet on ERM best practices, and there are a variety of methods being employed. Most ERM frameworks and approaches currently in use, while producing some valuable benefits, are resulting in suboptimal ERM programs. Chapter 3 defines the ERM framework for an advanced yet practical approach that helps companies avoid these issues and successfully implement a robust ERM program. The majority of the book describes this framework and approach in more detail. SUMMARY Due to a confluence of significant risk-related events, mostly over the past 10 years, as well as longer-term supporting trends, the time for ERM seems to have arrived. Some disastrous events, both man-made and natural, have raised management’s awareness of specific sources of risks, the
- 84. possibility of worst- case scenarios, and the need for an integrated approach to managing risk. Some actions, both proactive and reactive, by external stakeholders—rating agencies and government bodies—have improved risk management practices and disclosures, as well as raised management’s awareness of the benefits of an ERM program. While poised to continue to grow as a business approach, ERM suffers from some confusion in the marketplace and a lack of leading practices. In the next chapter, we will begin to clear up some of this confusion by thoroughly and clearly defining ERM. The remainder of this book will then go on to delineate leading practices for ERM. NOTES 1. Basel II replaced the original Basel Accord. While there is now a Basel III emerging, it is not materially different, from the perspective of our discussion.
- 85. The primary difference is higher capital requirements. 16 & Introduction C01 12/29/2010 9:49:22 Page 17 2. ‘‘Definitive Statistics Comparing Driving with Flying,’’ available at www .fearofflying.com/about/research.shtml#driving. The study indicates that such an increase in terrorism would make flying about as risky as rural interstate driving, which is one of the least risky types of driving. Therefore, overall, driving would still be riskier. 3. ‘‘How We Calculate Risk: Fear of Flying After 9/11 Led to Increase in Auto Deaths,’’ available at http://thestatsblog.wordpress.com/2008/01/16/fear- of-flying-after-911-led-to-increase-in-auto-deaths/. 4. The COSO Internal Control framework is intended as a process to help achieve effectiveness and efficiency of operations, reliability of financial reporting, and
- 86. compliance. Notes & 17 C02 01/07/2011 10:39:7 Page 18 2CHAPTER TWO Defining ERM Security is mostly a superstition. It does not exist in nature, nor do the children of men as a whole experience it. Avoiding danger is no safer in the long run than outright exposure. Life is either a daring adventure or nothing. Helen Keller B EFORE WE CAN even begin to define ERM, we must define risk.While risk is a very common term, it has several connotations. Weneed a very clear and specific understanding of risk itself, in terms of how we will use it in the context of ERM. DEFINITION OF RISK We will discuss the following three fundamental aspects of risk: 1. Risk is uncertainty. 18
- 87. C02 01/07/2011 10:39:7 Page 19 2. Risk includes upside volatility. 3. Risk is deviation from expected. Risk Is Uncertainty A good way to think about risk is that it is present whenever there is less than 100 percent certainty that an event will occur precisely as expected. If that is our definition of risk, is there anything that does not involve risk? This may bring to mind the famous quote about uncertainty by Benjamin Franklin: ‘‘The only things certain in life are death and taxes.’’ Other than these two eventualities, is there anything else in your life that does not involve risk? Interestingly, even death and taxes involve uncertainty, regarding the timing of the former and the exact amount of the latter. So, it may be that absolutely everything involves uncertainty.
- 88. Risk Includes Upside Volatility When you think of the risks in your life, you probably think of negative events, such as losing your job or losing your health. On a daily basis, risk may be as simple as the chance of not getting somewhere on time because of traffic or weather conditions. However, in an ERM context, we will define risk as any deviation from expected. Defined this way, risk includes both downside and upside volatility.1 For example, you certainly would consider the possibility that your bonus will be lower than expected as being a risk; however, you are unlikely to think of the possibility of your bonus being higher than expected as being a risk. But that is exactly what our definition of risk asks you to do— consider risk as the possibility that results may not be exactly equal to expected, but rather are either lower or higher than expected. The ‘‘upside volatility’’ refers to the range of possible upside risk events, and the
- 89. ‘‘downside volatility’’ refers to the range of possible downside risk events. Including upside volatility in the definition of risk is important in ERM, because we need to appropriately reflect three characteristics of risk: 1. Offsets from other business segments 2. Offsets from other events 3. Cost of volatility Offsets from Other Business Segments A single event that is a downside risk event for one business segment might be an upside risk event for a second business segment. For example, consider a Definition of Risk & 19 C02 01/07/2011 10:39:7 Page 20 tour company in the United States that markets national tours as well as tours to China to U.S. citizens. Assume a risk event occurs where the U.S. dollar
- 90. becomes devalued against China’s currency, renminbi (RMB). The tour company would expect a decrease in business for their tours to China, but they also might expect an increase in business for their national tours. In such cases, management must understand the net impact of the single event on the enterprise as a whole. A related concept is that what appears to be a downside risk event can ultimately turn out to be an upside risk event for the entity. One example is a moderate external attack from a competitor, which strengthens the entity’s defenses, allowing it to survive what would otherwise have been a fatal attack later on from a larger competitor. This is analogous to the famous quote by Friedrich Nietzsche: ‘‘Whatever does not kill us makes us stronger.’’ For a related anecdote, see ‘‘Blessing in Disguise.’’ Offsets from Other Events
- 91. Multiple risk events can occur simultaneously, with some being downside risk events and others being upside risk events. In these cases, manage- ment needs to measure the net impact of all risk events combined. For example, during one period, everything goes precisely as planned, except for two things: BLESSING IN DISGUISE I n October 2007, a swimmer named Michael Phelps was training forthe 2008 Beijng Olympics when he broke his wrist.2 Having won six gold medals at the 2004 Athens Olympics, Phelps had hoped to beat the world record of seven Olympic gold medals set by Mark Spitz in 1972. Despite publicly denying it at the time, in a later interview, Phelps admitted that the moment he realized he broke his wrist, he knew that his dream of winning eight Olympic gold medals was in jeopardy. During rehabilitation therapy for his wrist, Phelps was limited to doing kicking exercises in the water. Once he was fully healed, it became apparent that the injury had been a blessing in disguise. The extensive leg workouts gave him a competi- tive advantage that propelled him to his goal of winning eight
- 92. Olympic gold medals in Beijing. Stronger legs made him faster, allowing him to push harder off the walls when turning and to kick harder during his swimming strokes.3 20 & Defining ERM C02 01/07/2011 10:39:8 Page 21 1. A downside risk event occurs, such as a cost savings program not being executed as expected, resulting in fixed costs being $10million higher than expected. 2. An upside risk event occurs, such as an unexpected decrease in the cost of raw materials used in production, resulting in variable costs being $10 million lower than expected The net effect of these risk events—one upside and one downside—is zero. In an ERM context, had we applied an approach that only captured the downside risk event, we would have ignored the offsetting
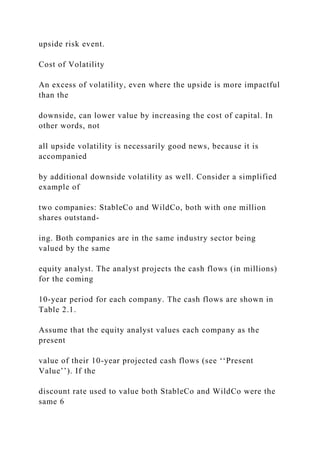
- 93. upside risk event. Cost of Volatility An excess of volatility, even where the upside is more impactful than the downside, can lower value by increasing the cost of capital. In other words, not all upside volatility is necessarily good news, because it is accompanied by additional downside volatility as well. Consider a simplified example of two companies: StableCo and WildCo, both with one million shares outstand- ing. Both companies are in the same industry sector being valued by the same equity analyst. The analyst projects the cash flows (in millions) for the coming 10-year period for each company. The cash flows are shown in Table 2.1. Assume that the equity analyst values each company as the present value of their 10-year projected cash flows (see ‘‘Present Value’’). If the discount rate used to value both StableCo and WildCo were the same 6
- 94. percent rate, StableCo would be valued at $80.10 per share and WildCo would be valued at $91.22 per share, or $11.12 per share more than StableCo. However, it is unlikely that the same discount rate would be used to value both companies. WildCo does have more total projected cash flow over the 10- year period. The upside volatility is expected to generate more additional dollars of cash flow than are lost by the accompanying additional downside volatility, as TABLE 2.1 Cash Flow Projection: StableCo and WildCo Cash Flows (in millions) Year 1 Year 2 Year
- 95. 3 Year 4 Year 5 Year 6 Year 7 Year 8 Year 9 Year 10 Total StableCo 10 10 10 11 11 11 12 11 12 12 110 WildCo 10 5 25 !2 18 10 28 2 24 6 126 Definition of Risk & 21
- 96. C02 01/07/2011 10:39:10 Page 22 compared to StableCo. However, WildCo also has higher overall volatility than StableCo. This is illustrated in Figure 2.1, which graphs the values from Table 2.1. Investors require a higher rate of return when there is higher volatility or uncertainty. Higher risk goes with higher required returns. Assume that the additional volatility of WildCo translates to the equity analyst adding 300 basis points to the discount rate. The equity analyst will now value WildCo using a 9 percent (6 percent þ 3 percent) discount rate, Ca sh fl ow (i n m
- 97. ill io ns ) 30 25 20 15 10 5 0 -5 1 2 3 4 5 6 7 8 9 10 StableCo WildCo Year FIGURE 2.1 WildCo Is More Volatile Than StableCo PRESENT VALUE Present value is a calculation that reduces a series of future cash flows to asingle equivalent value at the present time, adjusting for the time value
- 98. of money. For example, assume that, for you, the time value of money is a 6 percent interest rate, in terms of your business dealings with your local bank. In other words, you are indifferent between the bank offering you $106 one year from now or offering you $100 today. Now, assume the bank offers you $100 one year from now and $150 two years from now. What is the present value, i.e., what is the single value today which you would accept in place of these future cash flows? The present value is calculated as: Present value ¼ $100 ð1:06Þ1 þ $150 ð1:06Þ2 ¼ $227:84 The future cash flows are said to be discounted to the present time. 22 & Defining ERM C02 01/07/2011 10:39:14 Page 23 reflecting the higher level of risk in the stock. This produces a valuation for WildCo equal to $78.84 per share, which is $1.27 lower than
- 99. StableCo’s valuation. In this case, the additional volatility (which reflects all volatility— upside and downside) of WildCo outweighed the additional cash flows, result- ing in a lower valuation than the less volatile (and lower total cash flow) StableCo. Risk Is Deviation from Expected Risk is generally thought of as the possibility of a loss. This is the most common reference used, even by many ERM practitioners. However, loss is an in- complete concept because, as discussed earlier, it excludes upside volatility, which is the possibility of an unexpected gain. But loss has an even more insidious shortcoming. It often inadvertently causes people to overestimate the severity, or magnitude, of a risk. This is because when considering a negative (downside) risk event, or scenario, it is natural to visualize, for example, the loss
- 100. as the total outflow of cash. Unfortunately, this results in double-counting some expected losses, which should be excluded. Consider the following example. A Fortune 500 company is considering litigation risk. Several risk scenarios are developed, including one worst-case scenario where the company could have a total of $100 million in after-tax litigation costs. In this example, the loss from this risk event might be thought to be $100 million. But that would be incorrect. This large company experiences litigation costs each year, and a certain amount is normal and expected. Because our definition of risk is deviation from expected, the risk severity, or impact, should only include the excess over the amount expected. The annual expected litigation cost is likely to be included in the company’s strategic plan baseline financial projection. Assume that it is, and that the annual expected litigation cost is estimated at $35 million in the baseline
- 101. projection. The risk severity of the worst-case litigation risk scenario would then be: ðLitigation costs in worst-case scenarioÞ ! ðLitigation costs in baseline scenarioÞ ¼ ð$100millionÞ ! ð$35millionÞ ¼ $65million While this may seem like a straightforward distinction, it is one that is often overlooked. It is easy to forget to deduct the amount expected. In some cases, those individuals involved with developing the risk scenario may not be familiar with the strategic plan baseline financial projection and what items it incorporates. In other cases, the strategic plan baseline projection Definition of Risk & 23 C02 01/07/2011 10:39:14 Page 24 should have accounted for an item, but omitted it. In the latter cases, the risk scenario development exercise offers an opportunity to enhance the baseline projection.
- 102. The strategic plan projection is usually developed with primary focus on value drivers, and this influences which items are included and their account- ing. The ERM process, in this case specifically the risk scenario development process, brings in another perspective—the risk drivers. Bringing both aspects of business—both risk and return—into the strategic planning process improves its robustness. Now that we have clarified the three fundamental aspects of the definition of risk, we will move on to the definition of ERM itself. However, we will further expand on the definition of risk in Chapter 4, in the section ‘‘Risk Categorization and Definition.’’ DEFINITION OF ERM ERM is a complex process. To help provide a solid understanding of ERM, with its key nuances, we will spend the remainder of this chapter defining ERM from
- 103. the following perspectives: & Basic definition & Key criteria & The ERM process cycle & Fundamental benefits Basic Definition In Chapter 1, we provided a short definition of ERM: The process by which companies identify, measure, manage, and disclose all key risks to increase value to stakeholders. In the next section, we describe the key criteria implied by this basic definition, and that comprise the defining characteristics of an ERM program. Key Criteria There are 10 criteria that are the critical defining elements of an ERM program. These can serve as a useful benchmark against which to evaluate whether a 24 & Defining ERM C02 01/07/2011 10:39:15 Page 25 company truly has a robust ERM program. Currently, most ERM
- 104. programs are relatively immature, as measured against these criteria, and are slowly evolv- ing toward a robust program. These criteria are: 1. Enterprise-wide scope 2. All risk categories included 3. Key risk focus 4. Integrated across risk types 5. Aggregated metrics 6. Includes decision making 7. Balances risk and return management 8. Appropriate risk disclosures 9. Measures value impacts 10. Primary stakeholder focus Criterion 1: Enterprise-wide Scope Enterprise is the first word in ERM. This means that ERM must apply to every area of the company. One never knows where a significant risk event will occur. In fact, it often occurs precisely where management is
- 105. not looking. Unfortunately, most ERM programs do not have a comprehensive enterprise- wide scope. In such companies, one or more of the following situations exist: & A ‘‘golden boy’’ unit & An area deemed insignificant & A limiting approach & Differing cultures & Incomplete implementation A ‘‘Golden Boy’’ Unit The most noteworthy, and troubling, situation is the presence of a ‘‘golden boy’’ unit. This is a business unit that enjoys special rules because it has been generating large revenue growth and/or profits. The special rules usually take the form of exempting the business unit from scrutiny or even routine oversight processes, such as corporate reporting criteria, risk manage- ment activities, or internal audits. This can be the result of a misalignment of incentives (e.g., management is paid for revenue or earnings growth and is not held accountable for increasing the firm’s risk exposure). Whatever the cause,
- 106. the result is either a lack of understanding of the risks involved in the business, or worse, willful ignorance. Definition of ERM & 25 C02 01/07/2011 10:39:15 Page 26 One example of this was AIG Financial Products (AIGFP). AIGFP caused the collapse of AIG during the global financial crisis that began in the United States in 2007. They exposed AIG to enormous risk exposure in credit default swaps (CDSs). Before these exposures exploded into drowning losses, AIGFP was a growing source of large profits for AIG, and this led to their being exempt from corporate risk management scrutiny. An Area Deemed Insignificant Another situation is a business unit that is deemed minor enough to omit from the ERM process. This often happens as a result of rolling out an ERM implementation in stages, where priority
- 107. order is based on size of the business segment. In considering whether or not to extend the ERM program further, management decides to omit a small business area. This is potentially dangerous. Large losses often arise from small or obscure parts of the firm believed to have very little risk. However, risk exposure is not always in proportion to the visible size of the business; it is therefore critical to consider risks that may arise from any- where in the company. Nassim Taleb, author of The Black Swan: The Impact of the Highly Improbable and other books on large loss events, points out that large losses will eventually appear in business areas with certain qualities that generate routine, and relatively minor, income for a long period of time.4 Companies that ignore this warning, and deem apparently minor areas of their organization too small to
- 108. include in their ERM program, may be unknowingly exposed to a ticking time bomb of risk exposure with a fuse of unknown length. A Limiting Approach A common reason that many corporations cannot roll out their ERM program to all of their operations is because the approach they are using only works with their primary business segment. This is especially true for financial services companies with a holding company structure containing many different types of businesses. In these cases, the ERM approach commonly used for the banking or insurance operations is based on capital requirements and cannot be applied to other businesses that do not have any capital requirements.5 Differing Cultures In some organizations, two (or more) cultures exist, causing some business processes not to be adopted uniformly. In these cases, ERM may have been adopted, and even successfully implemented, by one part of the enterprise while another part, operating under a different
- 109. culture, 26 & Defining ERM C02 01/07/2011 10:39:15 Page 27 remains uninterested or unaware of ERM. This is more likely to occur in companies where business segments are more independent, as opposed to those with a more authoritative corporate department. Competing cultures can be caused by a variety of differences that separate them, including, but not limited to, the following: & Office location & Time zone & Local culture & Language & Types of business & Origins (e.g., a merger of two companies) Incomplete Implementation In many situations, it is simply the case that ERM is in an earlier stage of development and has not yet been extended fully to all business segments. Eventually, the ERM program may become truly
- 110. enterprise-wide. Most ERM programs are currently in this situation. Until the ERM program covers all areas, the company remains vulnerable. An ERM program that does not fully extend across the entire enterprise is similar to the watertight bulkheads (walls) that were not extended high enough above the waterline on the infamous Titanic, resulting in its rapid sinking and massive loss of lives on April 15, 1912. Criterion 2: All Risk Categories Included The word all in the basic ERM definition means that all risk categories must be included. In Chapter 4, we will improve on the standard industry terminology for risk categories, but for now, we will use the common industry terms. Risk categories, for most companies, include financial risk, strategic risk, and operational risk. The definitions of these risk categories are as follows: & Financial risk. Unexpected changes in external markets,
- 111. prices, rates, and liquidity supply and demand. This includes market risk, credit risk, and liquidity risk. & Strategic risk. Unexpected changes in key elements of strategy formu- lation or execution. & Operational risk. Unexpected changes in elements related to operations, such as human resources, technology, processes, and disasters. Definition of ERM & 27 C02 01/07/2011 10:39:15 Page 28 There is one additional risk category—insurance risk, which generally applies only to insurance companies. Insurance risk involves poor performance of the pricing, underwriting, reserving, or setting of required capital for insurance products. Including all risk categories is critical for the validity of an ERM program.
- 112. Key risks can reside in any of the risk categories. Ignoring a risk category, or not having a balanced focus among all risk categories, can expose the company to excessive risk and result in focusing limited risk mitigation resources on the wrong priorities. Surprisingly, the vast majority of ERM programs focus all, or most, of their attention only on financial risks. The primary evidence of this imbalance is the lack of a sufficiently robust approach to quantifying strategic and operational risks. There are three main causes of this neglect: 1. Inability to quantify strategic and operational risks 2. Myth regarding importance of financial risks 3. Financial analyst bias Inability to Quantify Strategic and Operational Risks One basis for this imbalance is an inability to quantify strategic and operational risks. For financial risks, there is a large amount of objective market data to use in
- 113. developing risk scenarios, which include quantitative impacts on financial results. However, for strategic and operational risks, which are heavily depen- dent on the specific makeup of the organization impacted, there is far less data available. In addition, popular quantification methods do not adequately support strategic and operational risks. The quantification methods either do not provide any quantification, or worse, they dramatically understate the severity of the risk. In Chapter 3, we explore this issue in more detail and describe an emerging approach that resolves this, and other, issues. Myth Regarding Importance of Financial Risks A second source of the disproportional focus on financial risks is the belief that financial risks are the most important risks—that they are themajority of the risks that most threaten the organization. This is not supported by experience, and in fact, quite the
- 114. opposite is true. Research studies consistently show that strategic and opera- tional risks represent the majority of the key risks for a company and also comprise the biggest threats. A research study published in December 2009, which I directed and co- authored, examined the distribution of risks by risk category.6 The analysis was 28 & Defining ERM C02 01/07/2011 10:39:15 Page 29 based on the occurrence of negative events, related to public companies, appearing on the front page of the Wall Street Journal in 2006. Only 1 percent of such front-page news were financial risks, while approximately two-thirds (64 percent) were strategic risks and approximately one-third (35 percent) were operational risks. Similar results are found in other industry research, confirming that the
- 115. source of significant risk events for companies is, in decreasing order: strategic risk, operational risk, and financial risk. In Figure 2.2, an 18- year study by the Corporate Executive Board Company shows the root causes for one-year market capitalization declines of 50 percent or more, involving the top 20 percent of the Fortune 1000. Approximately two-thirds (65 percent) were strategic, 20 percent were operational (including legal and compliance risks categorized as operational), and only 15 percent were financial. However, even the 15 percent may be overstated, because many if not all of the risks categorized as financial appear to be operational, specifically human re- sources-related (such as performance risk, which is management or staff not performing their function as expected).7 Figure 2.3 shows a six-year study by Mercer Management Consulting
- 116. examining the triggering events for the 100 largest one-month value declines among the Fortune 1000 between 1993 and 1998. The vast majority of the risks were strategic (61 percent), one-third (33 percent) were operational, and only 6 percent were financial. 16% 15% 13% 7% 4% 4% 2% 2% 2% 5% 4% 3% 1% 4% 3% 6% 4% 3% 2%
- 117. Operational Risks Legal and Compliance Risks Financial Risks Strategic Risks n = 98 Market Capitalization Decline Drivers Top 20% of Fortune 1000 (1988-2005) 15%7%13%65% FIGURE 2.2 Risks Causing 50 Percent Decline in Value Definition of ERM & 29 C02 01/07/2011 10:39:18 Page 30 Another research study shows that the vast majority of members of boards
- 118. of directors believe that the biggest threats for their organizations are strategic risks rather than financial risks. Figure 2.4 shows the results of a 2006 survey of directors by The Conference Board, which asked directors about the biggest threats facing their organizations. The research reveals that, across all sectors, 24 12 7 6 4 2 1 1 1 11 7 7 6 3 2 1 0 0 0
- 121. Prices Law- suits Natural Disaster FIGURE 2.3 Largest 100 Declines in Value 0% 20% 40% 60% All Sectors Financial Services 16% 26% 41% 52% 53% 48% Strategic risk Risk of regulatory change Financial risk FIGURE 2.4 Directors’ Ranking of Biggest Threats Source: The Conference Board, The Role of U.S. Corporate
- 122. Boards in Enterprise Risk Management, 2006. 30 & Defining ERM C02 01/07/2011 10:39:19 Page 31 directors believing that strategic risks are the biggest threats outnumber those believing the threats to be financial risks bymore than 3 to 1 (53 percent versus 16 percent). Even within the financial services sector, directors voting strategic risks as most important outnumbered those voting for financial risks by almost 2 to 1 (48 percent versus 26 percent). Part of the myth that financial risks are the most important is based on an incorrect approach to risk categorization and definition; in confusing the source of a risk with its outcome, risks that are either in whole or in part strategic or operational risks are frequently miscategorized as exclusively financial risks. One example is the global financial crisis that began in the
- 123. United States in 2007. There were multiple sources of risk that led to the financial crisis, many of which were not financial risks. See ‘‘Criterion 2: All Risk Categories Included’’ in Chapter 9 for the case study analysis. Financial Analyst Bias A third cause of the lack of appropriate focus on non- financial risks is financial analyst bias. Most of those doing the modeling share a financial-centric mind-set. Their education is focused on financial risk. Their training and certification is in financial risk. Their experience is only with financial risk. Even the name and purview of their department may limit them to financial risk. In addition, their techniques cannot readily handle strategic and operational risks; their methods work best when there is a wealth of objective quantitative data available, which is not the case with strategic and operational risks. The lack of sufficient inclusion of non-financial risks may be
- 124. the result of one or a combination of the previously mentioned factors. Whatever the reason, this represents a dangerous flaw in most ERM programs. The impor- tance of this cannot be overstated. These partially quantitative ERM programs fail to quantify the vast majority of the key risks in terms of their individual and collective contribution to the overall volatility of the organization, in terms of the key metrics. These partially quantitative ERM programs give the strong impression that they are not incomplete, causing management to erroneously rely on, and misinterpret, the information. This false impression is given by the level of precision implied by the data handed to management by the financial modelers (also known as financial analysts or simply modelers) of these flawed ERM programs. The modelers routinely provide outputs from their models showing
- 125. the volatility of key metrics, presented in a way that implies a high degree of accuracy; one example is showing the figure out to a large number of significant digits. Definition of ERM & 31 C02 01/07/2011 10:39:19 Page 32 This problem is rampant in the financial services sector, where it is even more common to find this imbalance in the quantification of key risks. One example, from the banking sector, is the ‘‘Value-at-Risk’’ (VaR) metric. VaR is often defined as the maximum amount of capital that can be lost in a single day, within a given small predefined likelihood. Another example, at insur- ance companies, is the ‘‘economic capital’’ metric, which is the amount of capital needed on hand today to limit the probability of ruin, over a given
- 126. time horizon, to within a given small predefined likelihood. In both of these examples, these numbers are commonly provided to management in number form that includes a large number of significant digits, implying a high level of accuracy (e.g., a number is shown as $35,455,809, rather than $35 million). In addition, these numbers are often provided without the proper disclaimers of incompleteness regarding overall firm volatility. This offers an incorrect representation to management, despite being quite unintentional, that this (financial-only) volatility represents the bulk, or even the totality, of the risk exposures about which management needs to be concerned. This is alarming because of the dangerous nature of ignoring the majority of the key risks in the metrics, and particularly so because this is often occurring under the guise of an enterprise risk management
- 127. program . . . yet the word enterprise seems ignored. However, what is even more shocking is that what the (usually) math-savvy modelers are doing violates a basic mathematical concept we all learned in elementary school—the rule of significant digits. See ‘‘Significant Digits.’’ SIGNIFICANT DIGITS The rule of significant digits can best be illustrated through a simpleexample. Assume we have two numbers. The first number is 2. What do we know about the level of accuracy of this number? It might be rounded up from 1.50 or it might be rounded down from 2.49. Now, we have a second number, which is 2.04. This number is presented to us out to two decimal places. What do we know? Well, we know it has far more implied accuracy than the first number. However, the second number similarly may be rounded up from 2.0350 or rounded down from 2.0449. The significant digits rule indicates that where two numbers have different levels of significant digits, we must report the sum of those two numbers with 32 & Defining ERM


