1000 track1 gland_sims
•
0 likes•119 views

This document summarizes a presentation given at Predictive Analytics World in Chicago on establishing a data-driven culture through change management. The presentation discusses defining what it means for a culture to be data-driven, engaging leadership to support the change, and implementing sustainable changes. It also provides tactics for measuring whether the shift to a more data-driven culture is successful. The key recommendations are to align analytics goals with organizational objectives, evaluate how analytics fits the existing processes, communicate wins from analytics projects to drive further adoption, and use the right metrics to assess the analytics program over time.
Report
Share


1000 track1 gland_sims
- 1. The world’s foremost authority in benchmarking, best practices, process and performance improvement, and knowledge management. CHANGE MANAGEMENT FOR ESTABLISHING A DATA- DRIVEN CULTURE Predictive Analytics World, Chicago June 21, 2017
- 2. SPEAKERS Holly Lyke-Ho-Gland Principal Research Lead APQC hlykehogland@apqc.org Michael Sims Research Analyst APQC msims@apqc.org
- 3. ©2017 APQC. ALL RIGHTS RESERVED. 3 AGENDA During this session, we will discuss: o What data-driven decision making means o How to engage leadership in data-driven decision making o Tactics that support long-term adoption of data-driven decision making o How to measure and keep on track
- 4. WHAT DOES “DATA-DRIVEN” MEAN?
- 5. ©2017 APQC. ALL RIGHTS RESERVED. 5 WHY THIS TOPIC? 18.9% 20.8% 29.6% 32.1% 35.8% 0.0% 10.0% 20.0% 30.0% 40.0% Determining the right structure (e.g., decentralized, centralized, or federated model) for an analytics department Providing performance measures and ROI on analytics Aggregating analysis into a dashboard to support decision making Combining business acumen with statistical analysis to provide insights Establishing a culture of data-based decision making 2017 Top Analytics Challenges N=159 Note: The values in the graph do not add up to 100%, because it was a “select top three” question.
- 6. ©2017 APQC. ALL RIGHTS RESERVED. 6 DEFINING “DATA DRIVEN” Combines data trends and business acumen for decision making Goals of data driven Reduces the impact of cognitive biases Introduces new information through analytics Decision-Making Spectrum
- 8. ©2017 APQC. ALL RIGHTS RESERVED. 8 SCOPE THE CURRENT STATE This type of interview is invaluable to the change management process in a number of ways, including: highlighting key areas to include in the business case, helping change leaders anticipate collateral effects of the change, identifying potential change champions and subject-matter experts, and inculcating the sentiment that the organization at-large is involved in the change process (as opposed to only the change leaders).
- 9. ©2017 APQC. ALL RIGHTS RESERVED. 9 CRITERIA FOR A BUSINESS CASE Key components of the business case: 1. Value—includes an estimation of the impact on the bottom line, top-line growth, or on other performance indicators or role of the program to support strategic initiatives or goals for the organization. 2. Cost—all anticipated resource requirements, including IT infrastructure, new hires, consulting services, and third-party solutions. 3. Risk—includes the potential risks associated with the change, which can include dependencies, capacity issues, resource limitations, or timeline.
- 11. ©2017 APQC. ALL RIGHTS RESERVED. 11 MATCH STRUCTURE TO YOUR ORGANIZATION’S NEEDS 1. What is driving the needs? Is it a mandate from senior management? Is it a bottom-up initiative, or is it aimed at a specific function, initiative, or goal? 2. Where does it fit on the maturity scale? How long has the organization used analytics and how comfortable are decision makers using data to drive their decisions? Example Program StructuresScoping Questions
- 12. ©2017 APQC. ALL RIGHTS RESERVED. 12 BALANCE BUSINESS ACUMEN AND TECHNICAL SKILLS Domain experts—someone who can define the problem, and know how the insights are going to be used. Analytics experts—someone who knows the limitations and possibilities of analytics. Data management experts—someone who knows where to get the data and what it means. Once the analytics team understands the skeptics’ concerns it can address them through: Demystifying analytics—have additional dialogues and coaching to overcome the lack of understanding about what the data and analysis truly mean. Proving concrete examples—show the value of the approach by showcasing results or how other teams in the organization are already using the actual models. Engaging Skeptics
- 13. ©2017 APQC. ALL RIGHTS RESERVED. 13 ENGAGING THE ORGANIZATION Don’t Rely on a One-Size-Fits-All Approach • Dashboards • Face-to-face meetings • Training • Project support services • Access to raw data Use an Iterative Analytics Process • Helps develop buy-in by the business • Improves long-term communication • Cross-trains stakeholders • Ensures the projects meets its goals
- 14. ©2017 APQC. ALL RIGHTS RESERVED. 14 STRUCTURED COMMUNICATIONS AND QUICK WINS Structured Communications Focusing on the purpose of each phase allows you to identify what you are trying to get the audience to do. Pilot Program A quick-win project should: • provide value to decision makers or align with a strategic goal, • outline value in terms of performance measures management cares about (e.g., revenue, costs, risk, or customer satisfaction), and • demonstrate a clear “before/after effect.”
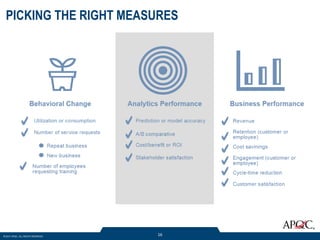
- 16. ©2017 APQC. ALL RIGHTS RESERVED. 16 PICKING THE RIGHT MEASURES
- 17. ©2017 APQC. ALL RIGHTS RESERVED. 17 TAKEAWAYS Make sure goals and objectives of analytics program align with organization objectives. Evaluate and understand how analytics fits into your organization's process. In order for change to stick, you have to communicate your small and big wins. Assess whether you have the right measures in place to evaluate your analytics program.
- 18. QUESTIONS
- 19. ©2017 APQC. ALL RIGHTS RESERVED. 19 NEXT STEPS 1. Stay up to date on our research and check out our Data and Analytics Expertise Page. 2. Access the full report : 1. Change Management Practices for Establishing a Data-driven Culture (Best Practices Report) 2. PAW Discount Code: PAW2017 3. Have a success story you want to share? Contact us at hlykehogland@apqc.org or msims@apqc.org.
- 20. The world’s foremost authority in benchmarking, best practices, process and performance improvement, and knowledge management. 123 N. Post Oak Lane, Third Floor | Houston, TX | 77024 | apqc.org