


17 02-27 slw presentation final (march)
- 1. THE HIGH MARGIN PRECIOUS METALS COMPANY MARCH 2017
- 2. CAUTIONARY STATEMENTS CAUTIONARY NOTE REGARDING FORWARD LOOKING-STATEMENTS The information contained in this Presentation contains “forward-looking statements” within the meaning of the United States Private Securities Litigation Reform Act of 1995 and “forward-looking information” within the meaning of Canadian securities legislation. There can be no assurance that forward-looking statements will prove to be accurate, as actual results and future events could differ materially from those anticipated in such statements. Readers are strongly cautioned to carefully review the cautionary notes to this Presentation starting on page 42 and in particular: Note 1 at the end of this Presentation contains our cautionary note regarding forward-looking statements and sets out the material assumptions and risk factors that could cause actual results to differ, including, but not limited to, fluctuations in the price of commodities, the outcome of the challenge by the CRA of Silver Wheaton’s tax filings, the absence of control over mining operations from which Silver Wheaton purchases silver or gold, and risks related to such mining operations. Readers should also consider the section entitled “Description of the Business – Risk Factors” in Silver Wheaton’s Annual Information Form and the risks identified under “Risks and Uncertainties” in Management's Discussion and Analysis for the period ended December 31, 2015, both available on SEDAR and in Silver Wheaton’s Form 40-F and Silver Wheaton’s Form 6-K filed March 16, 2016, both on file with the U.S. Securities and Exchange Commission. Where applicable, readers should also consider any updates to such “Risks and Uncertainties” that may be provided by Silver Wheaton in its quarterly Management’s Discussion and Analysis. Note 2 at the end of this Presentation contains our cautionary note regarding the presentation of mineral reserve and mineral resource estimates. 2
- 3. How Streaming Works Silver Wheaton makes an upfront payment and in return we purchase a fixed percentage of the future silver and/or gold production from a mine at a predetermined price 3 PRECIOUS METAL STREAMING A WIN-WIN MODEL Silver Wheaton shares value differential with its partners resulting in a win-win model Partner Mining Company Upfront payment (Cash and/or SLW shares) Delivery payment ($ per ounce) Traditional Miner Streaming Company Opportunity exists to create value for both parties Value of Future Precious Metal Production Value of Future Precious Metal Stream Why Streaming Works The market values precious metal in a streaming company greater than precious metal produced by a traditional miner
- 4. 4 New Mine Example Peñasquito Expansion Example Salobo – Initial Stream Improves project IRR for our partner mining companies and thus creates value 55% 7.5% 0% 10% 20% 30% 40% 50% 60% 95% 6.3% 0% 10% 20% 30% 40% 50% 60% 70% 80% 90% 100% Upfront Payment as a percentage of total capex Stream as a percentage of mine revenue Upfront Payment as a percentage of expansion capex Stream as a percentage of mine revenue PRECIOUS METAL STREAMING WHY IT WORKS
- 5. WHO IS SILVER WHEATON?
- 6. HIGH-QUALITY ASSET BASE DIVERSIFIED PORTFOLIO Well-diversified with low political risk Operating Mines (22) Development Projects (8) Partners: Vale Glencore Goldcorp Barrick Lundin Eldorado Hudbay Pan American Primero Capstone Alexco Sandspring Panoro 6 Corporate Offices (2)
- 7. 69% 27% 4% 7 2016 – 2020 Avg. Forecast Production by Cost Quartile1,3 HIGH-QUALITY ASSET BASE LOW-COST, LONG-LIFE PRODUCTION 31Moz Ag and 330Koz Au Over 95% of SLW’s production comes from assets in the lowest half of the cost curve And the portfolio has over 25 years of mine life based on reserves ~26 ~10 ~8 0 10 20 30 40 50 Proven and Probable Measured & Indicated Inferred Mine Life of Operating Portfolio1,2,3 MineLife(years) Proven & Probable Mineral Reserves Measured & Indicated Mineral Resources Inferred Mineral Resources
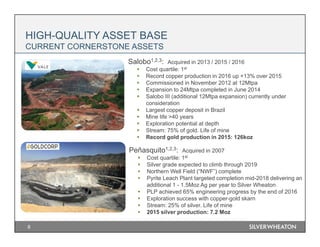
- 8. 8 HIGH-QUALITY ASSET BASE CURRENT CORNERSTONE ASSETS Salobo1,2,3: Acquired in 2013 / 2015 / 2016 Cost quartile: 1st Record copper production in 2016 up +13% over 2015 Commissioned in November 2012 at 12Mtpa Expansion to 24Mtpa completed in June 2014 Salobo III (additional 12Mtpa expansion) currently under consideration Largest copper deposit in Brazil Mine life >40 years Exploration potential at depth Stream: 75% of gold. Life of mine Record gold production in 2015: 126koz Peñasquito1,2,3: Acquired in 2007 Cost quartile: 1st Silver grade expected to climb through 2019 Northern Well Field (“NWF”) complete Pyrite Leach Plant targeted completion mid-2018 delivering an additional 1 - 1.5Moz Ag per year to Silver Wheaton PLP achieved 65% engineering progress by the end of 2016 Exploration success with copper-gold skarn Stream: 25% of silver. Life of mine 2015 silver production: 7.2 Moz
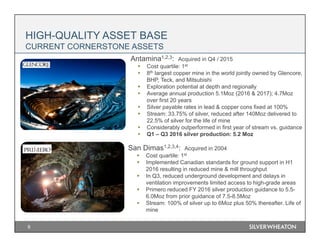
- 9. 9 HIGH-QUALITY ASSET BASE CURRENT CORNERSTONE ASSETS Antamina1,2,3: Acquired in Q4 / 2015 Cost quartile: 1st 8th largest copper mine in the world jointly owned by Glencore, BHP, Teck, and Mitsubishi Exploration potential at depth and regionally Average annual production 5.1Moz (2016 & 2017); 4.7Moz over first 20 years Silver payable rates in lead & copper cons fixed at 100% Stream: 33.75% of silver, reduced after 140Moz delivered to 22.5% of silver for the life of mine Considerably outperformed in first year of stream vs. guidance Q1 – Q3 2016 silver production: 5.2 Moz San Dimas1,2,3,4: Acquired in 2004 Cost quartile: 1st Implemented Canadian standards for ground support in H1 2016 resulting in reduced mine & mill throughput In Q3, reduced underground development and delays in ventilation improvements limited access to high-grade areas Primero reduced FY 2016 silver production guidance to 5.5- 6.0Moz from prior guidance of 7.5-8.5Moz Stream: 100% of silver up to 6Moz plus 50% thereafter. Life of mine
- 10. 10 Pascua Lama1,2,3: Acquired in 2009 Cost quartile: 1st Initiation of prefeas study for underground mine on Lama side Appointed experienced mine builder, George Bee, on Sept 1 2016 as SVP with a mandate to review a staged development of the Argentinian side of the project Chilean team to continue to focus on optimizing Chilean components of the project while addressing legal, regulatory, and permitting matters Average production ~9Moz Ag for the first 5 years of full production under the existing mine plan Stream: 25% of silver. Life of mine HIGH-QUALITY ASSET BASE GROWTH AND DEVELOPMENT ASSETS Constancia1,2,3: Acquired in 2012 / 2013 Cost quartile: 2nd YTD production of copper, gold and silver increased by 46%, 73% and 51% respectively compared to same period in 2015 YTD growth reflects the ramp up to full production and the improvements in recoveries made in the last year Processing ore at 30% above reserve grade for first 5 years of operation 22 year mine life Stream: 100% of silver. 50% of gold. Life of mine 2015 production: 14 koz gold, 2.0 Moz silver
- 11. 0 10 20 30 40 50 60 70 80 2012A 2013A 2014A 2015A 2016E 2016-2020E Optiona SilverEquivalentProduction("SEO")(Moz) Navidad Toroparu Cotabambas Rosemont Pascua Lama Other San Dimas Peñasquito Constancia Sudbury Salobo Antamina FIVE YEAR PRODUCTION GROWTH FORECAST ADDING TO OUR INDUSTRY-LEADING GROWTH PROFILE 11 Production over the next 5 years is forecast to be 55% silver and 45% gold Production Profile1,5 Not included in forecast 0 200 400 600 800 1,000 Optionality GoldEquivalentProduction("GEO")(Koz)
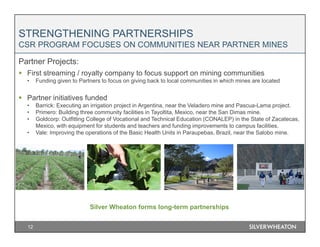
- 12. Partner Projects: First streaming / royalty company to focus support on mining communities • Funding given to Partners to focus on giving back to local communities in which mines are located Partner initiatives funded • Barrick: Executing an irrigation project in Argentina, near the Veladero mine and Pascua-Lama project. • Primero: Building three community facilities in Tayoltita, Mexico, near the San Dimas mine. • Goldcorp: Outfitting College of Vocational and Technical Education (CONALEP) in the State of Zacatecas, Mexico, with equipment for students and teachers and funding improvements to campus facilities. • Vale: Improving the operations of the Basic Health Units in Paraupebas, Brazil, near the Salobo mine. 12 STRENGTHENING PARTNERSHIPS CSR PROGRAM FOCUSES ON COMMUNITIES NEAR PARTNER MINES Silver Wheaton forms long-term partnerships
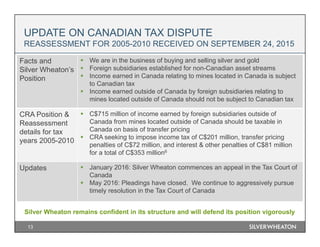
- 13. UPDATE ON CANADIAN TAX DISPUTE REASSESSMENT FOR 2005-2010 RECEIVED ON SEPTEMBER 24, 2015 Silver Wheaton remains confident in its structure and will defend its position vigorously 13 Facts and Silver Wheaton’s Position We are in the business of buying and selling silver and gold Foreign subsidiaries established for non-Canadian asset streams Income earned in Canada relating to mines located in Canada is subject to Canadian tax Income earned outside of Canada by foreign subsidiaries relating to mines located outside of Canada should not be subject to Canadian tax CRA Position & Reassessment details for tax years 2005-2010 C$715 million of income earned by foreign subsidiaries outside of Canada from mines located outside of Canada should be taxable in Canada on basis of transfer pricing CRA seeking to impose income tax of C$201 million, transfer pricing penalties of C$72 million, and interest & other penalties of C$81 million for a total of C$353 million6 Updates January 2016: Silver Wheaton commences an appeal in the Tax Court of Canada May 2016: Pleadings have closed. We continue to aggressively pursue timely resolution in the Tax Court of Canada
- 14. WHY INVEST IN SILVER WHEATON?
- 15. 15 Silver Wheaton Traditional Miners 100% Precious metals exposure Predictable costs7 No exploration costs but exploration upside Highly diverse asset base Sustainable dividend at all commodity prices Strong upside with downside protection SILVER WHEATON VERSUS TRADITIONAL MINERS
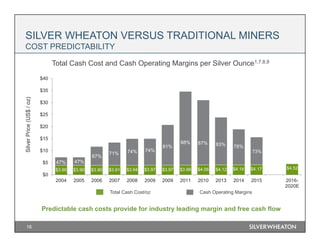
- 16. $3.90 $3.90 $3.90 $3.91 $3.94 $3.97 $3.97 $3.99 $4.06 $4.12 $4.14 $4.17 $4.52 $0 $5 $10 $15 $20 $25 $30 $35 $40 2004 2005 2006 2007 2008 2009 2009 2011 2010 2013 2014 2015 2016- 2020E 47% 47% 67% 71% 74% 74% 81% 88% 87% 83% 78% 16 Cash Operating MarginsTotal Cash Cost/oz Predictable cash costs provide for industry leading margin and free cash flow Total Cash Cost and Cash Operating Margins per Silver Ounce1,7,8,9 SILVER WHEATON VERSUS TRADITIONAL MINERS COST PREDICTABILITY SilverPrice(US$/oz) 73%
- 17. $300 $300 $300 $362 $386 $386 $393 $403 $0 $200 $400 $600 $800 $1,000 $1,200 $1,400 $1,600 $1,800 2009 2010 2011 2012 2013 2014 2015 2016-2020E GoldPrice(US$/oz) 71% 75% 81% 79% 72% 66% 78% 17 Cash Operating MarginsTotal Cash Cost/oz Predictable cash costs provide for industry leading margin and free cash flow Total Cash Cost and Cash Operating Margins per Gold Ounce1,7,8,9 SILVER WHEATON VERSUS TRADITIONAL MINERS COST PREDICTABILITY 69%
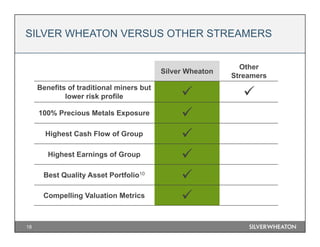
- 18. 18 SILVER WHEATON VERSUS OTHER STREAMERS Silver Wheaton Other Streamers Benefits of traditional miners but lower risk profile 100% Precious Metals Exposure Highest Cash Flow of Group Highest Earnings of Group Best Quality Asset Portfolio10 Compelling Valuation Metrics
- 19. 19 SLW represents ~50% of the operating cash flow generated by the senior streamers Percentage of Market by Streamer 8,11 SILVER WHEATON VERSUS OTHER STREAMERS INDUSTRY LEADERS 17% 19% 17% 32% 34% 46% 51% 47% 37% 0% 10% 20% 30% 40% 50% 60% Net Earnings Operating Cash Flow Market Capitalization Royal Gold Franco Nevada Silver Wheaton
- 20. 20 Silver Wheaton trades at a significant discount SILVER WHEATON VERSUS OTHER STREAMERS COMPELLING VALUATION Royal Gold Franco Nevada Silver Wheaton Key Valuation Metrics12 59.2 21.0 81.3 31.2 37.1 18.1 0 10 20 30 40 50 60 70 80 90 Price / Net Earnings Price / Op. Cash Flow 1.8 1.8 1.5 Price / Net Asset Value - 0.5 1.0 1.5 2.0 2.5
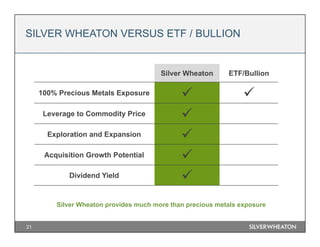
- 21. 21 Silver Wheaton ETF/Bullion 100% Precious Metals Exposure Leverage to Commodity Price Exploration and Expansion Acquisition Growth Potential Dividend Yield Silver Wheaton provides much more than precious metals exposure SILVER WHEATON VERSUS ETF / BULLION
- 22. 22 Silver Equivalent Reserves and Resources (in Moz)2,13 Silver Wheaton’s production has been replaced through successful exploration by our partners SILVER WHEATON VERSUS ETF / BULLION EXPLORATION AND EXPANSION - GROWING R&R Total Acquired Total Mined Total Exploration & Inferred Conversion R&R 1,733 (P&P) 949 (M&I) 811 484641 (M&I) 1,714 (P&P)
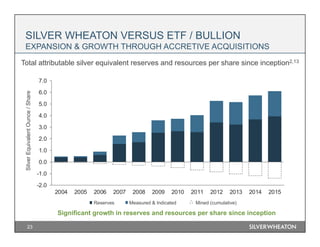
- 23. 23 Total attributable silver equivalent reserves and resources per share since inception2,13 Significant growth in reserves and resources per share since inception SILVER WHEATON VERSUS ETF / BULLION EXPANSION & GROWTH THROUGH ACCRETIVE ACQUISITIONS -2.0 -1.0 0.0 1.0 2.0 3.0 4.0 5.0 6.0 7.0 2004 2005 2006 2007 2008 2009 2010 2011 2012 2013 2014 2015 SilverEquivalentOunce/Share Reserves Measured & Indicated Mined (cumulative)
- 24. 0 100 200 300 400 500 600 700 800 900 1000 2015A 2016E 2017E 2018E 2019E 2020E SLW 2016E 24 Silver Wheaton vs. Global Silver Production1,14 ForecastGlobalSilverProduction(Moz) Silver Wheaton’s Potential Target Market 5% Traditional Silver Companies Silver Wheaton’s Forecast Production (% of potential target market) Over 100Moz of annual silver supply is expected to be lost over the next 4-5 years Roughly equal to average annual worldwide demand for silver coins Primary Silver Mines Gold Mines Base Metal Mines SILVER WHEATON VERSUS ETF / BULLION ACQUISITION GROWTH POTENTIAL - LARGE TARGET MARKET 57% 56% 58% 58% 59% 59% 14% 14% 15% 15% 16% 17% 29% 29% 27% 27% 25% 24% 890 870 840 800 780 770
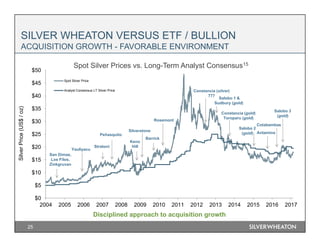
- 25. 25 Spot Silver Prices vs. Long-Term Analyst Consensus15 San Dimas, Los Filos, Zinkgruvan Yauliyacu Peñasquito Stratoni Barrick Keno Hill Rosemont Silverstone Constancia (silver) 777 Disciplined approach to acquisition growth Salobo 1 & Sudbury (gold) Constancia (gold) Toroparu (gold) SILVER WHEATON VERSUS ETF / BULLION ACQUISITION GROWTH - FAVORABLE ENVIRONMENT Salobo 2 (gold) Antamina Cotabambas Salobo 3 (gold) $0 $5 $10 $15 $20 $25 $30 $35 $40 $45 $50 2004 2005 2006 2007 2008 2009 2010 2011 2012 2013 2014 2015 2016 2017 SilverPrice(US$/oz) Spot Silver Price Analyst Consensus LT Silver Price
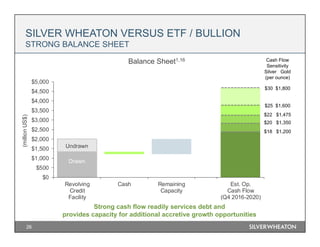
- 26. Est. Op. Cash Flow (Q4 2016-2020) $0 $500 $1,000 $1,500 $2,000 $2,500 $3,000 $3,500 $4,000 $4,500 $5,000 Revolving Credit Facility Cash Remaining Capacity (millionUS$) 26 Strong cash flow readily services debt and provides capacity for additional accretive growth opportunities SILVER WHEATON VERSUS ETF / BULLION STRONG BALANCE SHEET Drawn Undrawn Cash Flow Sensitivity Silver Gold (per ounce) $30 $1,800 $22 $1,475 $20 $1,350 $18 $1,200 $25 $1,600 Balance Sheet1,16
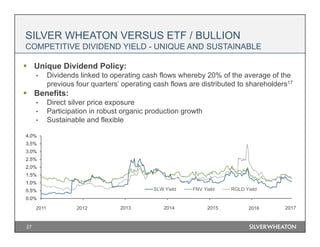
- 27. 27 Unique Dividend Policy: • Dividends linked to operating cash flows whereby 20% of the average of the previous four quarters’ operating cash flows are distributed to shareholders17 Benefits: • Direct silver price exposure • Participation in robust organic production growth • Sustainable and flexible SILVER WHEATON VERSUS ETF / BULLION COMPETITIVE DIVIDEND YIELD - UNIQUE AND SUSTAINABLE 2011 2012 2013 2014 2015 2016 0.0% 0.5% 1.0% 1.5% 2.0% 2.5% 3.0% 3.5% 4.0% 2011 2012 2013 2014 2015 2016 SLW Yield FNV Yield RGLD Yield 2017
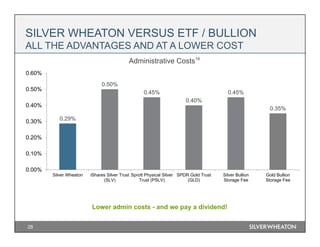
- 28. 28 Administrative Costs Lower admin costs - and we pay a dividend! 18 SILVER WHEATON VERSUS ETF / BULLION ALL THE ADVANTAGES AND AT A LOWER COST 0.29% 0.50% 0.45% 0.40% 0.45% 0.35% 0.00% 0.10% 0.20% 0.30% 0.40% 0.50% 0.60% Silver Wheaton iShares Silver Trust (SLV) Sprott Physical Silver Trust (PSLV) SPDR Gold Trust (GLD) Silver Bullion Storage Fee Gold Bullion Storage Fee
- 29. 29 SILVER WHEATON PROVIDES: Cost predictability Leverage to increasing precious metals prices High quality asset base Optionality in ounces, not acres Dividend yield AND REMAINS STRATEGICALLY POSITIONED FOR FURTHER GROWTH. IF YOU LIKE PRECIOUS METALS…
- 30. 30 INVESTOR RELATIONS Tel: 604-684-9648 Toll Free: 1-844-288-9878 Email: info@silverwheaton.com TRANSFER AGENT CST Trust Company Toll Free: 1-800-387-0825 International: 1-416-682-3860 Email: inquiries@canstockta.com
- 31. APPENDIX
- 32. 32 Shares Outstanding 441.2 million Warrants Outstanding (in-the-money) 0.0 million Options Outstanding (in-the-money) 4.2 million Diluted Shares Outstanding19 445.4 million 3 Month Average Daily Trading Volume: TSX: 1.6 million shares NYSE: 4.9 million shares LIQUID STOCK CAPITAL STRUCTURE AS OF SEPT 30, 2016
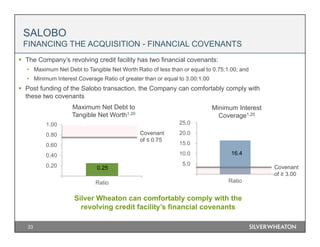
- 33. 16.4 - 5.0 10.0 15.0 20.0 25.0 Ratio SALOBO FINANCING THE ACQUISITION - FINANCIAL COVENANTS 33 Silver Wheaton can comfortably comply with the revolving credit facility’s financial covenants The Company’s revolving credit facility has two financial covenants: • Maximum Net Debt to Tangible Net Worth Ratio of less than or equal to 0.75:1.00; and • Minimum Interest Coverage Ratio of greater than or equal to 3.00:1.00 Post funding of the Salobo transaction, the Company can comfortably comply with these two covenants Maximum Net Debt to Tangible Net Worth1,20 Minimum Interest Coverage1,20 Covenant of ≤ 0.75 Covenant of ≥ 3.00 0.25 0.00 0.20 0.40 0.60 0.80 1.00 Ratio
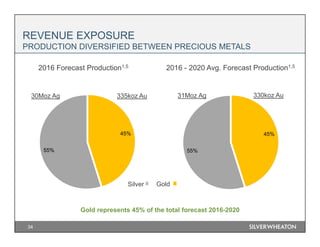
- 34. 45% 55% REVENUE EXPOSURE PRODUCTION DIVERSIFIED BETWEEN PRECIOUS METALS 34 Gold represents 45% of the total forecast 2016-2020 2016 Forecast Production1,5 2016 - 2020 Avg. Forecast Production1,5 GoldSilver 335koz Au 330koz Au30Moz Ag 45% 55% 31Moz Ag
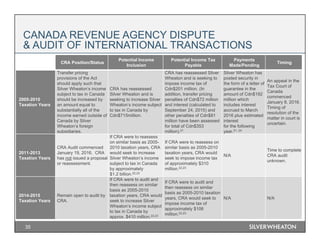
- 35. 35 CANADA REVENUE AGENCY DISPUTE & AUDIT OF INTERNATIONAL TRANSACTIONS CRA Position/Status Potential Income Inclusion Potential Income Tax Payable Payments Made/Pending Timing 2005-2010 Taxation Years Transfer pricing provisions of the Act should apply such that Silver Wheaton’s income subject to tax in Canada should be increased by an amount equal to substantially all of the income earned outside of Canada by Silver Wheaton’s foreign subsidiaries. CRA has reassessed Silver Wheaton and is seeking to increase Silver Wheaton’s income subject to tax in Canada by Cdn$715million. CRA has reassessed Silver Wheaton and is seeking to impose income tax of Cdn$201 million. (In addition, transfer pricing penalties of Cdn$72 million and interest (calculated to September 24, 2015) and other penalties of Cdn$81 million have been assessed for total of Cdn$353 million).21 Silver Wheaton has posted security in the form of a letter of guarantee in the amount of Cdn$192 million which includes interest accrued to March 2016 plus estimated interest for the following year.21, 24 An appeal in the Tax Court of Canada commenced January 8, 2016. Timing of resolution of the matter in court is uncertain. 2011-2013 Taxation Years CRA Audit commenced January 19, 2016. CRA has not issued a proposal or reassessment. If CRA were to reassess on similar basis as 2005- 2010 taxation years, CRA would seek to increase Silver Wheaton’s income subject to tax in Canada by approximately $1.2 billion.22,23 If CRA were to reassess on similar basis as 2005-2010 taxation years, CRA would seek to impose income tax of approximately $310 million.22,23 N/A Time to complete CRA audit unknown. 2014-2015 Taxation Years Remain open to audit by CRA. If CRA were to audit and then reassess on similar basis as 2005-2010 taxation years, CRA would seek to increase Silver Wheaton’s income subject to tax in Canada by approx. $410 million.22,23 If CRA were to audit and then reassess on similar basis as 2005-2010 taxation years, CRA would seek to impose income tax of approximately $106 million.22,23 N/A N/A
- 36. 36 2004 2005 2006 2007 2008 2009 2010 2011 2012 Date of Contract: 10/15/2004 Current Owner: Primero Mining Upfront Payment: $190 million Term of Agreement: LOM Attr. Production: 100% Silver San Dimas (Mexico) Date of Contract: 12/8/2004 Current Owner: Lundin Mining Upfront Payment: $78 million Term of Agreement: LOM Attr. Production: 100% Silver Zinkgruvan (Sweden) Date of Contract: 3/23/2006 Current Owner: Glencore Upfront Payment: $285 million Term of Agreement: 20 years Attr. Production: 100% Silver Yauliyacu (Peru) Date of Contract: 4/23/2007 Current Owner: Eldorado Gold Upfront Payment: $58 million Term of Agreement: LOM Attr. Production: 100% Silver Stratoni (Greece) Date of Contract: 7/24/2007 Current Owner: Goldcorp Upfront Payment: $485 million Term of Agreement: LOM Attr. Production: 25% Silver Peñasquito (Mexico) Date of Contract: 10/2/2008 Current Owner: Alexco Upfront Payment: $50 million Term of Agreement: LOM Attr. Production: 25% Silver Keno Hill (Canada) Date of Contract: 10/15/2004 Current Owner: Goldcorp Upfront Payment: $4 million Term of Agreement: 25 years Attr. Production: 100% Silver Los Filos (Mexico) Date of Contract: 2/11/2010 Current Owner: Hudbay Upfront Payment: $230 million Term of Agreement: LOM Attr. Production: 100% Silver 100% Gold Rosemont (United States) Date of Contract: 8/8/2012&11/4/2013 Current Owner: Hudbay Upfront Payment: $430 million $135 million (shares) Term of Agreement: LOM Attr. Production: 100% Silver 50% Gold Constancia (Peru) Date of Contract: 8/8/2012 Current Owner: Hudbay Upfront Payment: $455 million Term of Agreement: LOM Attr. Production: 100% Silver 100% / 50% Gold* 777 (Canada) Date of Transaction: 5/21/2009 Interests Acquired: (mine / owner / location) Minto Capstone Mining Canada Cozamin Capstone Mining Mexico Neves-Corvo Lundin Mining Portugal Aljustrel I’M SGPA Portugal Silverstone Resources Date of Contract: 9/8/2009 Current Owner: Barrick Upfront Payment: $625 million Term of Agreement: LOM Attr. Production: 25% Silver Additional Consideration: (mine / location) Lagunas Norte Peru Pierina Peru Veladero Argentina Pascua-Lama (Chile / Argentina) 10/22/2004: Silver Wheaton began trading on the TSX under the symbol SLW. In December, the Company’s name was changed from Chap Mercantile Inc. to Silver Wheaton Corp. and the outstanding shares were consolidated on a 5 for 1 basis. Date of Contract: 2/28/2013 Current Owner: Vale Upfront Payment: $1.33 billion Term of Agreement: LOM Attr. Production: 25% Gold Salobo I (Brazil) Date of Contract: 2/28/2013 Current Owner: Vale Upfront Payment: $570 million Term of Agreement: 20 years Attr. Production: 70% Gold Additional Consideration: 10 million SLW warrants w/$65 strike & 10yr term Sudbury (Canada) 2013 2014 Date of Contract: 11/11/2013 Current Owner: Sandspring Resources Upfront Payment: $153.5 million Term of Agreement: LOM Attr. Production: 10% Gold & 50% silver Early Deposit: $15.5 million Toroparu (Guyana)** COMPANY ACQUISITION HISTORY 2015 Date of Contract: 3/2/2015 Current Owner: Vale Upfront Payment: $900 million Term of Agreement: LOM Attr. Production: 25% Gold Total Attr. Prod: 50% Gold Salobo II (Brazil) Date of Contract: 11/2015 Current Owner: Glencore Upfront Payment: $900 million Term of Agreement / Attr. Production 33.75% Silver until 140mmoz accrues 22.5% Silver LOM after first 140mmoz Antamina (Peru) 2016 Date of Contract: 3/21/2016 Current Owner: Panoro Minerals Upfront Payment: $140 million Early Deposit $14 million Term of Agreement / Attr. Production 25% Gold & 100% Silver until 90Moz Ag Eq. 16.67% Gold and 66.67% Silver Thereafter Cotabambas (Peru)** Date of Contract: 8/2/2016 Current Owner: Vale Upfront Payment: $800 million Term of Agreement: LOM Attr. Production: 25% Gold Total Attr. Prod: 75% Gold Additional Consideration: 10 million SLW warrants re-priced to $43.75 from $65.00 Salobo III (Brazil) Timeline Since Inception25
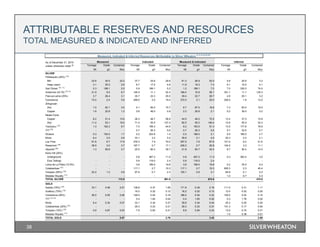
- 37. ATTRIBUTABLE RESERVES AND RESOURCES TOTAL PROVEN & PROBABLE 37 Tonnage Grade Contained Tonnage Grade Contained Tonnage Grade Contained Mt g/t Moz Mt g/t Moz Mt g/t Moz SILVER Peñasquito (25%) (10) Mill 99.6 32.6 104.5 47.1 24.5 37.2 146.7 30.0 141.6 75-80% Heap Leach 4.1 22.7 3.0 1.4 19.9 0.9 5.4 22.0 3.9 22-28% San Dimas (10, 11) 1.5 325.8 15.2 3.8 330.0 40.0 5.2 328.8 55.2 94% Antamina (33.75%) (12,13) 64.5 11.0 22.7 137.4 10.5 46.2 201.8 10.6 68.9 71% Pascua-Lama (25%) 8.0 69.8 17.9 73.2 64.1 150.8 81.2 64.7 168.7 82% Veladero (12) 3.7 12.8 1.5 66.1 12.8 27.3 69.8 12.8 28.8 8% Lagunas Norte (12) 7.0 4.1 0.9 25.2 4.1 3.3 32.2 4.1 4.2 34% Constancia 500.0 3.0 47.8 114.0 2.9 10.8 614.0 3.0 58.6 71% Zinkgruvan Zinc 8.1 80.0 20.7 3.7 51.0 6.0 11.7 70.9 26.7 87% Copper 3.5 35.0 3.9 - - - 3.5 35.0 3.9 65% Neves-Corvo Copper 6.3 39.0 7.9 19.7 36.0 22.8 25.9 36.7 30.6 35% Zinc 11.5 71.5 26.4 13.9 62.0 27.6 25.3 66.3 54.0 20% Yauliyacu (14) 0.7 136.6 3.1 3.2 137.9 14.1 3.9 137.6 17.1 85% 777 (15) 3.3 26.7 2.8 3.0 27.8 2.7 6.3 27.2 5.5 50% Stratoni 0.4 172.0 2.4 0.2 184.0 1.3 0.7 176.2 3.7 84% Cozamin (12) - - - 1.6 42.1 2.2 1.6 42.1 2.2 72% Minto 1.7 8.3 0.5 3.8 5.2 0.6 5.5 6.1 1.1 78% Los Filos 20.0 7.1 4.6 20.5 9.1 6.0 40.5 8.1 10.5 5% Rosemont (16) 279.5 4.1 37.0 325.8 4.1 43.1 605.3 4.1 80.1 76% Metates Royalty (17) 4.1 18.0 2.3 13.2 13.1 5.5 17.2 14.2 7.9 76% TOTAL SILVER 325.0 448.3 773.3 GOLD Salobo (75%) (18) 490.8 0.38 6.03 376.7 0.31 3.72 867.6 0.35 9.75 66% Sudbury (70%) (12) - - - 47.4 0.43 0.66 47.4 0.43 0.66 72% Constancia (50%) 250.0 0.05 0.40 57.0 0.07 0.14 307.0 0.05 0.54 61% 777 (12,15) 2.0 1.80 0.12 1.8 1.80 0.11 3.9 1.80 0.22 55% Minto 1.7 1.19 0.06 3.8 0.64 0.08 5.5 0.81 0.14 74% Toroparu (10%) (19) 3.0 1.10 0.10 9.7 0.98 0.31 12.7 1.01 0.41 89% Metates Royalty (17) 4.1 0.68 0.09 13.2 0.44 0.19 17.2 0.50 0.28 89% TOTAL GOLD 6.80 5.19 11.99 Proven & Probable Reserves Attributable to Silver Wheaton (1,2,3,8,22) As of December 31, 2015 unless otherwise noted (6) Proven Probable Proven & Probable Process Recovery (7)
- 38. ATTRIBUTABLE RESERVES AND RESOURCES TOTAL MEASURED & INDICATED AND INFERRED 38 Tonnage Grade Contained Tonnage Grade Contained Tonnage Grade Contained Tonnage Grade Contained Mt g/t Moz Mt g/t Moz Mt g/t Moz Mt g/t Moz SILVER Peñasquito (25%) (10) Mill 23.6 30.5 23.2 37.7 24.6 29.9 61.3 26.9 53.0 4.9 20.6 3.2 Heap Leach 3.1 25.5 2.6 8.7 17.0 4.8 11.9 19.3 7.4 0.1 15.5 0.1 San Dimas (10, 11) 0.3 189.1 2.0 0.9 189.1 5.2 1.2 189.1 7.2 7.0 330.0 74.0 Antamina (33.75) (12,13) 21.9 9.5 6.7 146.5 11.1 52.3 168.4 10.9 59.1 351.1 11.1 125.3 Pascua-Lama (25%) 3.7 26.4 3.1 35.7 22.3 25.5 39.4 22.7 28.7 4.9 20.1 3.2 Constancia 73.0 2.4 5.6 299.0 2.0 19.4 372.0 2.1 25.0 200.0 1.9 12.0 Zinkgruvan Zinc 1.5 62.1 3.0 5.1 95.0 15.7 6.7 87.5 18.8 7.3 83.0 19.4 Copper 1.6 22.8 1.2 0.6 49.0 0.9 2.2 29.8 2.1 0.2 39.0 0.2 Neves-Corvo Copper 8.2 51.4 13.6 36.3 48.7 56.9 44.5 49.2 70.5 13.4 37.0 15.9 Zinc 11.2 53.1 19.0 71.4 55.5 127.4 82.5 55.2 146.4 12.6 55.0 22.3 Yauliyacu (14) 1.3 162.2 6.7 7.0 199.3 44.6 8.2 193.5 51.3 13.5 177.6 76.9 777 (15) - - - 0.7 26.3 0.6 0.7 26.3 0.6 0.7 32.6 0.7 Stratoni 0.3 193.5 1.7 0.2 203.8 1.4 0.5 198.0 3.1 0.5 169.0 2.7 Minto 6.4 3.0 0.6 33.1 3.2 3.4 39.6 3.1 4.0 25.3 2.5 2.1 Los Filos 81.6 6.7 17.6 276.3 7.9 70.0 357.9 7.6 87.6 141.0 9.2 41.6 Rosemont (16) 38.5 3.0 3.7 197.7 2.7 17.1 236.2 2.7 20.8 104.5 3.3 11.1 Aljustrel (20) 1.3 65.6 2.7 20.5 60.3 39.7 21.8 60.7 42.4 8.7 50.4 14.0 Keno Hill (25%) Underground - - - 0.8 467.2 11.5 0.8 467.2 11.5 0.3 363.4 3.0 Elsa Tailings - - - 0.6 119.0 2.4 0.6 119.0 2.4 - - - Loma de La Plata (12.5%) - - - 3.6 169.0 19.8 3.6 169.0 19.8 0.2 76.0 0.4 Cotabambas (21) - - - 117.1 2.7 10.3 117.1 2.7 10.3 605.3 2.3 45.4 Toroparu (50%) (19) 22.2 1.2 0.8 97.9 0.7 2.3 120.1 0.8 3.1 64.8 0.1 0.2 Metates Royalty (17) - - - - - - - - - 1.0 9.7 0.3 TOTAL SILVER 113.9 561.0 674.9 474.0 GOLD Salobo (75%) (18) 33.1 0.48 0.51 138.8 0.37 1.65 171.8 0.39 2.16 111.5 0.31 1.11 Sudbury (70%) (12) - - - 16.2 0.22 0.12 16.2 0.22 0.12 12.0 0.52 0.20 Constancia (50%) 36.5 0.05 0.06 149.5 0.04 0.18 186.0 0.04 0.23 100.0 0.03 0.10 777 (12,15) - - - 0.4 1.83 0.02 0.4 1.83 0.02 0.3 1.76 0.02 Minto 6.4 0.34 0.07 33.1 0.34 0.37 39.6 0.34 0.44 25.3 0.25 0.20 Cotabambas (25%) (21) - - - 29.3 0.23 0.21 29.3 0.23 0.21 151.3 0.17 0.84 Toroparu (10%) (19) 0.9 0.87 0.03 7.9 0.83 0.21 8.8 0.84 0.24 13.0 0.74 0.31 Metates Royalty (17) - - - - - - - - - 1.0 0.38 0.01 TOTAL GOLD 0.67 2.76 3.42 2.80 Inferred Measured, Indicated & Inferred Resources Attributable to Silver Wheaton (1,2,3,4,5,9,22) As of December 31, 2015 unless otherwise noted (6) Measured Indicated Measured & Indicated
- 39. ATTRIBUTABLE RESERVES AND RESOURCES FOOTNOTES 39 1. All Mineral Reserves and Mineral Resources have been estimated in accordance with the 2014 Canadian Institute of Mining, Metallurgy and Petroleum (CIM) Standards for Mineral Resources and Mineral Reserves and National Instrument 43-101 – Standards for Disclosure for Mineral Projects (“NI 43-101”), or the 2012 Australasian Joint Ore Reserves Committee (JORC) Code for Reporting of Exploration Results, Mineral Resources and Ore Reserves. 2. Mineral Reserves and Mineral Resources are reported above in millions of metric tonnes (“Mt”), grams per metric tonne (“g/t”) and millions of ounces (“Moz”). 3. Individual qualified persons (“QPs”), as defined by the NI 43-101, for the technical information contained in this document (including the Mineral Reserve and Mineral Resource estimates) for the following operations are as follows: a. Salobo mine –Gerrit Vos, P.Eng., Technical Director, Mining, Dr Georges Verly, P.Eng., Chief Geostatistician, Dr Armando Simon, P.Geo., Principal Geologist, Pierre Lacombe, P.Eng., Consulting Metallurgist, Donald Hickson, P.Eng., Division Manager, Earth and Infrastructure, Vikram Khera, P.Eng., Senior Financial Analyst, and Stella Searston, RM SME, Principal Geologist, all of whom are now, or were at the time of the preparation of the Salobo Report, employees of Amec Foster Wheeler Americas Limited (Amec Foster Wheeler). b. All other operations and development projects: the Company’s QPs Neil Burns, M.Sc., P.Geo. (Vice President, Technical Services); Samuel Mah, M.A.Sc., P.Eng. (Senior Director, Project Evaluations), both employees of the Company (the “Company’s QPs”). 4. The Mineral Resources reported in the above tables are exclusive of Mineral Reserves. The San Dimas mine, Minto mine, Neves-Corvo mine, Zinkgruvan mine, Stratoni mine and Toroparu project (gold only) report Mineral Resources inclusive of Mineral Reserves. The Company’s QPs have made the exclusive Mineral Resource estimates for these mines based on average mine recoveries and dilution. 5. Mineral Resources which are not Mineral Reserves do not have demonstrated economic viability. 6. Other than as detailed below, Mineral Reserves and Mineral Resources are reported as of December 31, 2015 based on information available to the Company as of the date of this document, and therefore will not reflect updates, if any, after such date. a. Mineral Resources and Mineral Reserves for the Pascua-Lama project are reported as of December 31, 2013. b. Mineral Resources for the Constancia mine (including the Pampacancha deposit) are reported as of September 30, 2013 and Mineral Reserves as of December 31, 2013. c. Mineral Resources and Mineral Reserves for the Neves-Corvo and Zinkgruvan mines are reported as of June 30, 2015. d. Mineral Resources and Mineral Reserves for the Rosemont project are reported as of August 28, 2012. e. Mineral Resources for Aljustrel’s Feitais and Moinho mines are reported as of November 30, 2010. Mineral Resources for the Estaçao project are reported as of December 31, 2007. f. Mineral Resources for Keno Hill’s Elsa Tailings project are reported as of April 22, 2010, Lucky Queen project as of July 27, 2011, Onek project as of October 15, 2014, Flame and Moth and Bermingham projects as of April 28, 2015, Bellekeno mine Inferred Mineral Resources as of September 30, 2012 and Bellekeno mine Indicated Mineral Resources as of September 30, 2013. g. Mineral Resources for the Loma de La Plata project are reported as of May 20, 2009. h. Mineral Resources for the Cotabambas project are reported as of June 20, 2013. i. Mineral Resources and Mineral Reserves for gold at the Toroparu project are reported as of March 31, 2013 and Mineral Resources for silver are reported as of September 1, 2014. j. Mineral Resources for Metates royalty are reported as of February 16, 2012 and Mineral Reserves as of March 18, 2013. 7. Process recoveries are the average percentage of silver or gold in a saleable product (doré or concentrate) recovered from mined ore at the applicable site process plants as reported by the operators. 8. Mineral Reserves are estimated using appropriate process and mine recovery rates, dilution, operating costs and the following commodity prices: a. Antamina mine - $2.96 per pound copper $0.99 per pound zinc, $11.91 per pound molybdenum and $21.34 per ounce silver. b. Constancia mine - $1,250 per ounce gold, $25.00 per ounce silver, $3.00 per pound copper and $13.50 per pound molybdenum. c. Cozamin mine - $42.00 per tonne NSR cut-off assuming $20.00 per ounce silver, $2.50 per pound copper, $0.85 per pound lead and $0.80 per pound zinc. d. Lagunas Norte and Veladero mines - $1,000 per ounce gold and $15.00 per ounce silver. e. Los Filos mine - $1,100 per ounce gold and $16.50 per ounce silver. f. Metates royalty – 0.35 grams per tonne gold equivalent cut-off assuming $1,200 per ounce gold and $24.00 per ounce silver. g. Minto mine – 0.5% copper cut-off for Open Pit and $64.40 per tonne NSR cut-off for Underground assuming $300 per ounce gold, $3.90 per ounce silver and $2.50 per pound copper. h. Neves-Corvo mine – 1.6% copper cut-off for the copper Reserve and 4.8% zinc equivalent cut-off for all the zinc Reserves, both assuming $2.50 per pound copper, $1.00 per pound lead and zinc. i. Pascua-Lama project - $1,100 per ounce gold, $21.00 per ounce silver and $3.00 per pound copper. j. Peñasquito mine - $1,100 per ounce gold, $16.50 per ounce silver, $0.90 per pound lead and $0.95 per pound zinc. k. Rosemont project - $4.90 per ton NSR cut-off assuming $20.00 per ounce silver, $2.50 per pound copper and $15.00 per pound molybdenum. l. Salobo mine – 0.253% copper equivalent cut-off assuming $1,250 per ounce gold and $3.45 per pound copper. m. San Dimas mine – 2.50 grams per tonne gold equivalent cut-off assuming $1,200 per ounce gold and $18.00 per ounce silver. n. Stratoni mine – 15.54% zinc equivalent cut-off assuming $0.91 per pound lead and zinc. o. Sudbury mines - $1,250 per ounce gold, $18.50 per ounce silver, $9.07 per pound nickel, $2.95 per pound copper, $1,550 per ounce platinum, $875 per ounce palladium and $12.50 per pound cobalt. p. Toroparu project – 0.38 grams per tonne gold cut-off assuming $1,070 per ounce gold for fresh rock and 0.35 grams per tonne gold cut-off assuming $970 per ounce gold for saprolite. q. Yauliyacu mine - $17.20 per ounce silver, $2.83 per pound copper, $0.91 per pound lead and $1.02 per pound zinc. r. Zinkgruvan mine – 3.98% zinc equivalent cut-off for the zinc Reserve and 1.5% copper cut-off for the copper Reserve, both assuming $2.50 per pound copper and $1.00 per pound lead and zinc.
- 40. ATTRIBUTABLE RESERVES AND RESOURCES FOOTNOTES (CONTINUED) 40 8. (con). s. 777 mine – $1,190 per ounce gold, $16.50 per ounce silver, $2.75 per pound copper and $1.16 per pound zinc. 9. Mineral Resources are estimated using appropriate recovery rates and the following commodity prices: a. Aljustrel mine – 4.5% zinc cut-off for Feitais and Moinho mines zinc Resources and 4.0% zinc cut-off for Estação zinc Resources. b. Antamina mine - $2.96 per pound copper $0.99 per pound zinc, $11.91 per pound molybdenum and $21.34 per ounce silver. c. Constancia mine – 0.12% copper cut-off for Constancia and 0.10% copper cut-off for Pampacancha. d. Cotabambas project – 0.2% copper equivalent cut-off assuming $1,350 per ounce gold, $23,00 per ounce silver, $3.20 per pound copper and $12,50 per pound molybdenum. e. Keno Hill mines: i. Bellekeno mine - $185 per tonne NSR cut-off assuming $22.50 per ounce silver, $0.85 per pound lead and $0.95 per pound zinc. ii. Flame and Moth and Bermingham projects - $185 per tonne NSR cut-off assuming $1,300 per ounce gold, $20.00 per ounce silver, $0.94 per pound lead and $1.00 per pound zinc. iii. Lucky Queen project - $185 per tonne NSR cut-off assuming $1,100 per ounce gold, $18.50 per ounce silver, $0.90 per pound lead and $0.95 per pound zinc. iv. Onek project - $185 per tonne NSR cut-off assuming $1,250 per ounce gold, $20.00 per ounce silver, $0.90 per pound lead and $0.95 per pound zinc. v. Elsa Tailings project – 50 grams per tonne silver cut-off. f. Loma de La Plata project – 50 gram per tonne silver equivalent cut-off assuming $12.50 per ounce silver and $0.50 per pound lead. g. Los Filos mine - $1,300 per ounce gold and $19.00 per ounce silver. h. Metates royalty – 0.35 grams per tonne gold equivalent cut-off assuming $1,200 per ounce gold and $24.00 per ounce silver. i. Minto mine – 0.5% copper cut-off. j. Neves-Corvo mine – 1.0% copper cut-off for the copper Resource and 3.0% zinc cut-off for the zinc Resource, both assuming $2.50 per pound copper and $1.00 per pound lead and zinc. k. Pascua-Lama project – $1,500 per ounce gold, $24.00 per ounce silver and $3.50 per pound copper. l. Peñasquito mine - $1,300 per ounce gold, $19.00 per ounce silver, $1.00 per pound lead and zinc. m. Salobo mine – 0.286% copper equivalent cut-off assuming $1,500 per ounce gold $3.67 per pound copper. n. San Dimas mine – 2.00 grams per tonne gold equivalent cut-off assuming $1,200 per ounce gold and $18.00 per ounce silver. o. Stratoni mine – 15.54% zinc equivalent cut-off assuming $0.91 per pound lead and zinc. p. Sudbury mines - $1,250 per ounce gold, $18.50 per ounce silver, $9.07 per pound nickel, $2.95 per pound copper, $1,550 per ounce platinum, $875 per ounce palladium and $12.50 per pound cobalt. q. Rosemont project – 0.30% copper equivalent cut-off for Mixed and 0.15% copper equivalent for Sulfide assuming $20.00 per ounce silver, $2.50 per pound copper and $15.00 per pound molybdenum. r. Toroparu project – 0.30 grams per tonne gold cut-off assuming $1,350 per ounce gold. s. Yauliyacu mine – $17.20 per ounce silver, $2.83 per pound copper and $0.91 per pound lead and $1.02 per pound zinc. t. Zinkgruvan mine – 3.8% zinc equivalent cut-off for the zinc Resource and 1.0% copper cut-off for the copper Resource, both assuming $2.50 per pound copper and $1.00 per pound lead and zinc. u. 777 mine – $1,190 per ounce gold, $16.50 per ounce silver, $2.75 per pound copper and $1.16 per pound zinc. 10. The scientific and technical information in this document regarding the Peñasquito mine and the San Dimas mine was sourced by the Company from the following SEDAR (www.sedar.com) filed documents: a. Peñasquito - Goldcorp annual information form filed on March 29, 2016; and b. San Dimas - Primero annual information form filed on March 30, 2016. The Company QP’s have approved the disclosure of scientific and technical information in respect of the Peñasquito mine and San Dimas mine in this document. 11. The San Dimas silver purchase agreement provides that Primero will deliver to the Company a per annum amount equal to the first 6.0 million ounces of payable silver produced at the San Dimas mine and 50% of any excess, for the life of mine. 12. The Company’s attributable Mineral Resources and Mineral Reserves for the Lagunas Norte, Veladero, Cozamin, and Antamina silver interests, in addition to the Sudbury and 777 gold interests, have been constrained to the production expected for the various contracts. 13. The Antamina Silver Purchase Agreement in respect to the Antamina mine (November 3, 2015) provides that Glencore will deliver 33.75% of the silver production until 140 million ounces are delivered and 22.5% of silver production thereafter, for a 50 year term that can be extended in increments of 10 years at the Company’s discretion. Attributable reserves and resources have been calculated on the 33.75% / 22.5% basis. 14. On November 30, 2015, the Company amended its silver purchase agreement with Glencore in respect to the Yauliyacu mine. The term of the agreement which was set to expire in 2026, was extended to life of mine. Additionally, effective January 1, 2016, Glencore will deliver to the Company a per annum amount equal to the first 1.5 million ounces of payable silver produced at Yauliyacu and 50% of any excess. 15. The 777 precious metal purchase agreement provides that Hudbay will deliver 100% of the payable silver for the life of mine and 100% of the payable gold until completion of the Constancia mine, after which the gold stream will reduce to 50%. The gold figures in this table represent the attributable 777 mine Mineral Resources and Mineral Reserves constrained to the production expected for the 777 precious metal purchase agreement.
- 41. ATTRIBUTABLE RESERVES AND RESOURCES FOOTNOTES (CONTINUED) 41 16. The Rosemont mine Mineral Resources and Mineral Reserves do not include the SX/EW leach material since this process does not recover silver. 17. Effective August 7, 2014, the Company entered into an agreement for a 1.5% net smelter returns royalty on Chesapeake Gold Corp’s (Chesapeake) Metates property, located in Mexico. As part of the agreement, Chesapeake will have the right at any time for a period of five years to repurchase two-thirds of the royalty, with the Company retaining a 0.5% royalty interest. 18. The Company has filed an updated technical report for the Salobo mine prepared by Amec Foster Wheeler on www.sedar.com. 19. The Company’s agreement with Sandspring is an early deposit structure whereby the Company will have the option not to proceed with the 10% gold stream and 50% silver stream on the Toroparu project following the delivery of a bankable definitive feasibility study. 20. The Company only has the rights to silver contained in concentrates containing less than 15% copper at the Aljustrel mine. 21. Under the terms of the Cotabambas Early Deposit Agreement, the Company will be entitled to purchase 100% of the silver production and 25% of the gold production from the Cotabambas project until 90 million silver equivalent ounces attributable to the Company have been delivered, at which point the stream will drop to 66.67% of silver production and 16.67% of gold production for the life of mine. 22. Silver and gold are produced as by-product metal at all operations with the exception of silver at the Keno Hill mines and Loma de La Plata project and gold at the Toroparu project; therefore, the economic cut- off applied to the reporting of silver and gold Mineral Resources and Mineral Reserves will be influenced by changes in the commodity prices of other metals at the time of reporting.
- 42. 42 1. References to Silver Wheaton include Silver Wheaton Corp. and its wholly owned subsidiaries. The information contained herein contains “forward-looking statements” within the meaning of the United States Private Securities Litigation Reform Act of 1995 and “forward-looking information” within the meaning of applicable Canadian securities legislation. Forward-looking statements, which are all statements other than statements of historical fact, include, but are not limited to, statements with respect to: future payments by Silver Wheaton in accordance with precious metal purchase agreements, including any acceleration of payments, estimated throughput and exploration potential projected increases to production and cash flow profile the expansion and exploration potential at the Salobo and San Dimas mines projected changes to Silver Wheaton’s production mix anticipated increases in total throughput the effect of the SAT legal claim on Primero’s business, financial condition, results of operations and cash flows for 2010-2014 and 2015-2019 the estimated future production the future price of commodities the estimation of mineral reserves and mineral resources the realization of mineral reserve estimates the timing and amount of estimated future production (including 2016 and average attributable annual production over the next five years) the costs of future production reserve determination estimated reserve conversion rates and produced but not yet delivered ounces any statements as to future dividends, the ability to fund outstanding commitments and the ability to continue to acquire accretive precious metal stream interests confidence in the Company’s business structure the Company’s position relating to any dispute with the CRA and the Company’s intention to defend reassessments issued by the CRA the impact of potential taxes, penalties and interest payable to the CRA possible audits for taxation years subsequent to 2013 estimates as to amounts that may be reassessed by the CRA in respect of taxation years subsequent to 2010 amounts that may be payable in respect of penalties and interest the Company’s intention to file future tax returns in a manner consistent with previous filings that the CRA will continue to accept the Company posting security for amounts sought by the CRA under notices of reassessment for the 2005-2010 taxation years or will accept posting security for any other amounts that may be sought by the CRA under other notices of reassessment the length of time it would take to resolve any dispute with the CRA or an objection to a reassessment assessments of the impact and resolution of various tax matters, including outstanding audits, proceedings with the CRA and proceedings before the courts assessments of the impact and resolution of various legal and tax matters. Generally, these forward-looking statements can be identified by the use of forward-looking terminology such as “plans”, “expects” or “does not expect”, “is expected”, “budget”, “scheduled”, “estimates”, “forecasts”, “projects”, “intends”, “anticipates” or “does not anticipate”, or “believes”, “potential”, or variations of such words and phrases or statements that certain actions, events or results “may”, “could”, “would”, “might” or “will be taken”, “occur” or “be achieved”. Forward-looking statements are subject to known and unknown risks, uncertainties and other factors that may cause the actual results, level of activity, performance or achievements of Silver Wheaton to be materially different from those expressed or implied by such forward-looking statements, including but not limited to: risks related to the satisfaction of each party's obligations in accordance with the terms of the precious metal purchase agreements, including any acceleration of payments, estimated throughput and exploration potential fluctuations in the price of commodities risks related to the mining operations from which Silver Wheaton purchases silver or gold (the “Mining Operations”) and risks related to these Mining Operations including risks related to fluctuations in the price of the primary commodities mined at such operations, actual results of mining and exploration activities, environmental, economic and political risks of the jurisdictions in which the Mining Operations are located, and changes in project parameters as plans continue to be refined the absence of control over Mining Operations and having to rely on the accuracy of the public disclosure and other information Silver Wheaton receives from the owners and operators of the Mining Operations as the basis for its analyses, forecasts and assessments relating to its own business Primero is not able to defend the validity of the 2012 APA, is unable to pay taxes in Mexico based on realized silver prices or the SAT proceedings or actions otherwise have an adverse impact on the business, financial condition or results of operation of Primero differences in the END NOTES
- 43. 43 1. (con.) interpretation or application of tax laws and regulations or accounting policies and rules and Silver Wheaton’s interpretation of, or compliance with, tax laws and regulations or accounting policies and rules, is found to be incorrect or the tax impact to the Company’s business operations is materially different than currently contemplated any challenge by the CRA of the Company’s tax filings is successful and the potential negative impact to the Company’s previous and future tax filings the Company’s business or ability to enter into precious metal purchase agreements is materially impacted as a result of any CRA reassessment any reassessment of the Company’s tax filings and the continuation or timing of any such process is outside the Company’s control any requirement to pay reassessed tax the Company is not assessed taxes on its foreign subsidiary’s income on the same basis that the Company pays taxes on its Canadian income, if taxable in Canada interest and penalties associated with a CRA reassessment having an adverse impact on the Company’s financial position litigation risk associated with a challenge to the Company’s tax filings credit and liquidity risks hedging risk competition in the mining industry risks related to the entering into and completion of any Early Deposit Agreement risks related to Silver Wheaton’s acquisition strategy risks related to the market price of the common shares of Silver Wheaton (the “Common Shares”), including with respect to the market price of the Common Shares being too high to ensure that purchases under a normal course issuer bid benefit Silver Wheaton or its shareholders equity price risks related to Silver Wheaton’s holding of long-term investments in other exploration and mining companies risks related to the declaration, timing and payment of dividends the ability of Silver Wheaton and the Mining Operations to retain key management employees or procure the services of skilled and experienced personnel litigation risk associated with outstanding legal matters risks related to claims and legal proceedings against Silver Wheaton or the Mining Operations risks relating to unknown defects and impairments risks relating to security over underlying assets risks related to ensuring the security and safety of information systems, including cyber security risks risks related to the adequacy of internal control over financial reporting risks related to governmental regulations risks related to international operations of Silver Wheaton and the Mining Operations risks relating to exploration, development and operations at the Mining Operations risks related to the ability of the companies with which Silver Wheaton has precious metal purchase agreements to perform their obligations under those precious metal purchase agreements in the event of a material adverse effect on the results of operations, financial condition, cash flows or business of such companies risks related to environmental regulations and climate change the ability of Silver Wheaton and the Mining Operations to obtain and maintain necessary licenses, permits, approvals and rulings the ability of Silver Wheaton and the Mining Operations to comply with applicable laws, regulations and permitting requirements lack of suitable infrastructure and employees to support the Mining Operations uncertainty in the accuracy of mineral reserve and mineral resource estimates inability to replace and expand mineral reserves risks relating to production estimates from Mining Operations, including anticipated timing of the commencement of production by certain Mining Operations uncertainties related to title and indigenous rights with respect to the mineral properties of the Mining Operations fluctuation in the commodity prices other than silver or gold the ability of Silver Wheaton and the Mining Operations to obtain adequate financing the ability of Mining Operations to complete permitting, construction, development and expansion challenges related to global financial conditions risks relating to future sales or the issuance of equity securities other risks discussed in the section entitled “Description of the Business – Risk Factors” in Silver Wheaton’s Annual Information Form and the additional risks identified under “Risks and Uncertainties” in Management’s Discussion and Analysis for the period ended December 31, 2015, both available on SEDAR at www.sedar.com and in Silver Wheaton’s Form 40-F filed on March 30, 2016 and Form 6-K filed March 16, 2016, both on file with the U.S. Securities and Exchange Commission in Washington, D.C. (the “Disclosure”). Forward-looking statements are based on assumptions management currently believes to be reasonable, including but not limited to: the Common Shares trading below their value from time to time the satisfaction of each party's obligations in accordance with the precious metal purchase agreements no material adverse change in the market price of commodities that the Mining Operations will continue to operate and the mining projects will be END NOTES
- 44. 44 1. (con.) completed in accordance with public statements and achieve their stated production estimates the continuing ability to fund or obtain funding for outstanding commitments Silver Wheaton’s ability to source and obtain accretive precious metal stream interests expectations regarding the resolution of legal and tax matters, including the ongoing class action litigation and CRA audit involving the Company Silver Wheaton will be successful in challenging any reassessment by the CRA Silver Wheaton has properly considered the application of Canadian tax law to its structure and operations Silver Wheaton will continue to be permitted to post security for amounts sought by the CRA under notices of reassessment Silver Wheaton has filed its tax returns and paid applicable taxes in compliance with Canadian tax law Silver Wheaton will not change its business as a result of any CRA reassessment Silver Wheaton’s ability to enter into new precious metal purchase agreements will not be impacted by any CRA reassessment expectations and assumptions concerning prevailing tax laws and the potential amount that could be reassessed as additional tax, penalties and interest by the CRA any foreign subsidiary income, if taxable in Canada, would be subject to the same or similar tax calculations as Silver Wheaton’s Canadian income, including the Company’s position, in respect of precious metal purchase agreements with upfront payments paid in the form of a deposit, that the estimates of income subject to tax is based on the cost of precious metal acquired under such precious metal purchase agreements being equal to the market value of such precious metal the estimate of the carrying value of Silver Wheaton’s precious metal purchase agreements other assumptions and factors as set out in the Disclosure. Although Silver Wheaton has attempted to identify important factors that could cause actual results, level of activity, performance or achievements to differ materially from those contained in forward-looking statements, there may be other factors that cause results, level of activity, performance or achievements not to be as anticipated, estimated or intended. There can be no assurance that forward-looking statements will prove to be accurate and even if events or results described in the forward-looking statements are realized or substantially realized, there can be no assurance that they will have the expected consequences to, or effects on, Silver Wheaton. Accordingly, readers should not place undue reliance on forward-looking statements and are cautioned that actual outcomes may vary. The forward-looking statements included herein for the purpose of providing investors with information to assist them in understanding Silver Wheaton’s expected financial and operational performance and may not be appropriate for other purposes. Any forward looking statement speaks only as of the date on which it is made. Silver Wheaton does not undertake to update any forward-looking statements that are included or incorporated by reference herein, except in accordance with applicable securities laws. 2. CAUTIONARY NOTE TO UNITED STATES INVESTORS REGARDING PRESENTATION OF MINERAL RESERVE AND MINERAL RESOURCE ESTIMATES: The information contained herein has been prepared in accordance with the requirements of the securities laws in effect in Canada, which differ from the requirements of United States securities laws. The terms “mineral reserve”, “proven mineral reserve” and “probable mineral reserve” are Canadian mining terms defined in accordance with Canadian National Instrument 43-101 – Standards of Disclosure for Mineral Projects (“NI 43-101”) and the Canadian Institute of Mining, Metallurgy and Petroleum (the “CIM”) – CIM Definition Standards on Mineral Resources and Mineral Reserves, adopted by the CIM Council, as amended (the “CIM Standards”). These definitions differ from the definitions in Industry Guide 7 (“SEC Industry Guide 7”) under the U.S. Securities Act of 1933, as amended (the “U.S. Securities Act”). Under U.S. standards, mineralization may not be classified as a “reserve” unless the determination has been made that the mineralization could be economically and legally produced or extracted at the time the reserve determination is made. Also, under SEC Industry Guide 7 standards, a “final” or “bankable” feasibility study is required to report reserves, the three-year historical average price is used in any reserve or cash flow analysis to designate reserves and the primary environmental analysis or report must be filed with the appropriate governmental authority. In addition, the terms “mineral resource”, “measured mineral resource”, “indicated mineral resource” and “inferred mineral resource” END NOTES
- 45. 45 2. (con.) are defined in and required to be disclosed by NI 43-101; however, these terms are not defined terms under SEC Industry Guide 7 and are normally not permitted to be used in reports and registration statements filed with the SEC. Investors are cautioned not to assume that any part or all of the mineral deposits in these categories will ever be converted into reserves. “Inferred mineral resources” have a great amount of uncertainty as to their existence and as to their economic and legal feasibility. It cannot be assumed that all or any part of an inferred mineral resource will ever be upgraded to a higher category. Under Canadian rules, estimates of inferred mineral resources may not form the basis of feasibility or pre-feasibility studies, except in rare cases. Investors are cautioned not to assume that all or any part of an inferred mineral resource exists or is economically or legally mineable. Mineral resources that are not mineral reserves do not have demonstrated economic viability. Disclosure of “contained ounces” in a resource is permitted disclosure under Canadian regulations; however, the SEC normally only permits issuers to report mineralization that does not constitute “reserves” by SEC standards as in place tonnage and grade without reference to unit measures. Accordingly, information contained herein that describes the Company’s mineral deposits may not be comparable to similar information made public by U.S. companies subject to reporting and disclosure requirements under the United States federal securities laws and the rules and regulations thereunder. United States investors are urged to consider closely the disclosure in the Annual Information Form, a copy of which is available at www.sec.gov. 3. Company reports & Wood Mackenzie est. of Q1/16 byproduct cost curves for gold, zinc/lead, copper, nickel & silver mines. Assumes a Au:Ag ratio of 73.6:1 (based on the LBMA average gold and silver price for Q1-Q3 2016 of $1,260 and $17.12, respectively). Portfolio mine life based on reserves and resources of currently operating assets and 2016 forecast production. 4. Primero has disclosed a dispute with the Mexican tax authority (“SAT”) in regards to the San Dimas mine, which if unsuccessful could have a material adverse effect on Primero’s business, financial condition, results of operations and cash flows for 2010-2014 and 2015-2019. This may also have a material adverse effect on Silver Wheaton’s ability to purchase silver under the silver purchase agreement. 5. 2016-2020 assumes a Au:Ag ratio of 73.6:1; Production forecast includes the impact of the expiration of the Cozamin stream in 2017, Barrick Other streams in 2018, & the reduction of the 777 gold stream from 100% to 50% in 2017 as Constancia is expected to satisfy its completion test. Optionality based on 10- year averages for Rosemont, Cotabambas, Toroparu, & Navidad and 5-year average for Pascua Lama. 6. Estimates of interest given as of the date stated. Interest accrues until payment date. 7. Ongoing delivery payments are generally fixed at approximately US$4/oz for silver and US$400/oz for gold with an inflationary adjustment of approximately 1% per annum after the third year of production; Production payments at Antamina, representing 8-10% of total forecast production, fixed at 20% of spot silver prices. 8. Refer to non-IRFS measures at the end of this presentation. 9. 2016-2020E average cash costs are calculations based on existing agreements contributing to 2016-2020 production forecasts. 10. As defined by percentage of production from 1st or 2nd quartile assets according to Wood Mackenzie estimates of Q1 2016 byproduct cost curves for gold, zinc, copper, nickel and silver mines. 11. Company reports and Factset as of February 10, 2017; 2015 Q4 – 2016 Q3 Financials for Silver Wheaton and Franco Nevada and Fiscal 2016 Q2 – 2017 Q1 Financials for Royal Gold; Net earnings are used for this comparison. 12. P/E and P/OCF from company reports (rolling 4 quarters used for earnings and cash flow) and FactSet as of Febuary 10, 2017; 2015 Q4 – 2016 Q3 Financials for Silver Wheaton & Franco Nevada and Fiscal 2016 Q2 – 2017 Q1 Financials for Royal Gold; P/NAV is based on the February 10, 2017 closing share price and the average NAV from Bank of America Merrill Lynch, Canaccord Genuity, Macquarie, National Bank Financial and Royal Bank of END NOTES
- 46. 46 12. (con) Canada and is subject to the assumptions set out in those analysts’ reports. 13. From Dec. 31, 2004 to Dec. 31, 2015, Mineral Reserves and Mineral Resources are as of Dec. 31 for each year (see Silverwheaton.com); Current reserves and resources include reserves and resources updated to Dec 31 2015; Cumulative mined production based on management estimates & company reports. 14. Thomson Reuters GFMS Estimates. 15. Factset and consensus silver prices as compiled by CIBC World Markets. 16. Estimated operating cash flow calculations assume for each year between 2016 and 2020 (i) production forecasted on annual basis of 56 million silver equivalent ounces (including 330,000 gold ounces), (ii) production payments of between $4.17 and $4.68 per silver ounce and between $393 and $413 per gold ounce, (iii) 90% payable rates, (iv) indicated silver and gold prices being in place throughout the periods, (v) deduction of general & administrative expenses of approximately $30 million on an annual basis, (vi) calculation before dividends, interest expense and taxes, and (vii) successful resolution of the CRA dispute. Cash flow estimates are made as of August 10, 2016, are presented to show impact of silver and gold prices on cash flow and are not guaranteed. Excludes C$192 letter of guarantee posted in connection with the CRA dispute. Revolving Credit Facility of $2 billion with term to February 2021. Cash balance of $124 million and approx. $706 million drawn on the Revolving Credit Facility as of June 30, 2016. Proceeds from the equity offering completed April 14, 2016 were ~$607 million. Please see also Note 1 for material risks, assumptions, and important disclosure associated with this information, including, but not limited to, risks and assumptions associated with fluctuations in the price of commodities, the absence of control over mining operations from which Silver Wheaton purchases silver or gold, production estimates and the challenge by the CRA of Silver Wheaton’s tax filings. 17. The declaration and payment of dividends remains at the discretion of the Board and will depend on the Company’s cash requirements, future prospects and other factors deemed relevant by the Board. 18. ‘Administrative Costs’ equal Corporate G&A presented as a % of Enterprise Value for SLW; as a % of NAV for SLV, PLSV and SPDR. 2015 G&A of $32.2M and Enterprise value of $11.2B on Feb 10, 2017. Fund prospectus’ as of Aug 31, 2016. Bullion storage fee for new client relationships at ScotiaMocatta, price quoted for Toronto and NY vaults. 19. Per the treasury method. 20. As of September 30, 2016. Interest expense based on net debt as described above and interest rates applicable to the Company’s revolving credit facility. 21. Estimates of interest given as of the date stated. Interest accrues until payment date. 22. For precious metal purchase agreements with upfront payments paid in the form of a deposit, the estimates of income inclusion and tax payable are based on the cost of precious metal acquired under such precious metal purchase agreements being equal to the market value of such precious metal. 23. This amount does not include potential interest and penalties to the extent may be applicable. 24. As a consequence of the CRA’s reassessment of the 2005-2010 taxation years, CRA has denied non-capital losses of US$12 million and US$14 million that the Company had carried forward and applied to the 2011 and 2012 taxation years, respectively. Accordingly, the Company has carried back non-capital losses from subsequent taxation years to eliminate the taxable income in the 2011 and 2012 taxation years. However, interest and penalties of US$1.3 million remained owing, 50% of which has been paid as the Company plans to file Notices of Objection with respect to the reassessments of the 2011 and 2012 taxation years. The reassessments do not relate to the CRA international audit of the 2011 – 2013 taxation years. 25. Upfront payment denoted in US$ millions; excludes closing costs and capitalized interest, where applicable. Silver Wheaton is entitled to acquire 100% of the life of mine gold production from Hudbay’s 777 mine until the end of 2016, whichever is later. At that point, Silver Wheaton’s share of gold production from 777 will be reduced to 50% for the life of the mine. Toroparu & Cotabambas are Early Deposit structure. END NOTES
- 47. 47 Silver Wheaton has included, throughout this document, certain non-IFRS performance measures, including (i) adjusted net earnings and adjusted net earnings per share; (ii) operating cash flow per share (basic and diluted); (iii) average cash costs of silver and gold on a per ounce basis and; (iv) cash operating margin. i. Adjusted net earnings and adjusted net earnings per share are calculated by removing the effects of the non-cash impairment charges. The Company believes that, in addition to conventional measures prepared in accordance with IFRS, management and certain investors use this information to evaluate the Company’s performance. ii. Operating cash flow per share (basic and diluted) is calculated by dividing cash generated by operating activities by the weighted average number of shares outstanding (basic and diluted). The Company presents operating cash flow per share as management and certain investors use this information to evaluate the Company’s performance in comparison to other companies in the precious metal mining industry who present results on a similar basis. iii. Average cash cost of silver and gold on a per ounce basis is calculated by dividing the total cost of sales, less depletion, by the ounces sold. In the precious metal mining industry, this is a common performance measure but does not have any standardized meaning. In addition to conventional measures prepared in accordance with IFRS, management and certain investors use this information to evaluate the Company’s performance and ability to generate cash flow. iv. Cash operating margin is calculated by subtracting the average cash cost of silver and gold on a per ounce basis from the average realized selling price of silver and gold on a per ounce basis. The Company presents cash operating margin as management and certain investors use this information to evaluate the Company’s performance in comparison to other companies in the precious metal mining industry who present results on a similar basis. These non-IFRS measures do not have any standardized meaning prescribed by IFRS, and other companies may calculate these measures differently. The presentation of these non-IFRS measures is intended to provide additional information and should not be considered in isolation or as a substitute for measures of performance prepared in accordance with IFRS. For more detailed information, please refer to Silver Wheaton’s Management Discussion and Analysis available on the Company’s website at www.silverwheaton.com and posted on SEDAR at www.sedar.com. NON-IFRS MEASURES