Location via proxy:   [ UP ]  
[Report a bug]   [Manage cookies]                
SlideShare a Scribd company logo
2Q08 Results


 August, 2008
Highlights

2Q08
  – Generation 28% above Assured Energy
  – EBITDA of R$ 288.9 million in 2Q08, an increase of 24.2% when compared to
    same period of 2007 (R$ 232.6 million)
  – Net income of R$ 134.1 million in 2Q08, 5.6% lower than that in 2Q07 (R$ 142.1
    million)
  – On May 29th, 2008, the company paid R$ 172.8 million as Dividends regarding
    1Q08 results


Subsequent Events
  – Proposed dividends of R$ 134.1 million, corresponding to 100% of net income on
    2Q08:
      - R$ 0.34 per Common Share
      - R$ 0.37 per Preferred Share


                                                                                     2
Energy Balance

Generation – MW Average                                      Billed Energy – GWh
                                                                            7,239           7,292
                                                                             738            461
                                        121%      128%
                    115%                                                    914            1,234
109%     107%                 112%


                                                   1,635                    5,587          5,597
                                       1,543
         1,363       1,467   1,424
1,392


2003      2004       2005     2006      2007        1H08
                                                                            1H07            1H08
  Generation - MW Average      Generation / Assured Energy
                                                                    Eletropaulo     MRE     CCEE/Losses

 Increase of 29.4% on Generated Energy                         Bilateral Contract with Eletropaulo:
 (2Q08 x 2Q07)                                                    – Price until 07/03/2008 – R$ 131.98/MWh
                                                                  – Prices from July, 2008 – R$ 149.72/MWh
 Generation 28% above Assured Energy
 (1,275 MW average)                                            MRE Tariff – R$ 7.77/MWh

                                                               Average price of 2Q08 billed energy at CCEE
                                                               – R$ 59.72/MWh (R$ 68.82/MWh in 2Q07)

                                                                                                             3
Investments

Capex – 2Q08: R$ 12.9 million                                   1H08
Capex – 1H08: R$ 18.5 million

                                                                                                                Equipment
 – Equipment restoration and upgrade of operating plants -                 45.4%
   R$ 6.0 million                                                                                               Environment
                                                                                                  32.3%
 – Upgrade of the SHPP – R$ 1.7 million                                                                         IT
 – Environmental Projects – R$ 3.3 million                                                                      SHPP
 – Investments on IT – R$ 0.8 million
                                                                                       17.7%
 – SHPPs “São José” and “São Joaquim”, at São Paulo (total               4.5%
   capacity 7MW) – R$ 5.2 million
 – 3 SHPPs at Rio de Janeiro:                                   Investments – R$ million
     •   Installed Capacity of 52MW                                                                   85.9
     •   The installation license was granted in October 2007
                                                                                                      17.7
     •   Until 06/30/2008 R$ 21.0 million were invested, of
                                                                 SHPPs - RJ
         which R$ 1.0 million in 1H08                                                                 68.2
                                                                                           50.7
     •   Waiting for the Vegetation Suppression License                         46.5
         authorization in order to start the construction
                                                                  27.5
                                                                                                                     18.5
Capex 2008 – Estimate revised to R$ 85.9
million
                                                                   2005         2006       2007      2008 (E)        1H08

                                                                                                                            4
Expansion Requirement

Requirement: increase installed capacity, by at least, 15% (400 MW), until
December 2007:
  – Increase the installed capacity in São Paulo State; or
  – Purchase energy from new plants, located in São Paulo, through long term agreements (at
    least 5 years)

Restrictions to accomplish the requirement:
  – São Paulo State – insufficient hydro resources and environmental restrictions to install Thermo
    plants;
  – Insufficiency of gas supply;
  – “New Model of Electric Sector” (Law # 10,848/04)

On February 2008, AES Tietê received a report prepared by a consulting
company, regarding the evaluation of possibilities of expanding its
generation capacity in São Paulo State.
The Company has been developing discussions with different members of
the São Paulo State Government, regarding opportunities related to:
      – Hydroelectric potential
      – Opportunities for joint generation
      – Alternative energies


                                                                                                      5
Gross Revenue – R$ Million

Gross Revenue                                               Without Non-recurring Effects


          +33.1%   809                                      786               809
  608                                                                 +2.9%
                    34                                      74
                                                             74               34
                                                                               34

 (132)             775                                                        775
                                                                               775
                                                            712
                                                             712
                                   +86.8%
  740                                                                                              +1.3%
          +4.6%
                                            395                                             390            395
                            211                                      +8.8%
                                             16                                                             16
                                                                                                           16
                                                                                            37
                           (170)   -0.6%
                                                                                                   +7.4%
                            381             378                                             352
                                                                                             352           378
                                                                                                            378


  1H07             1H08     2Q07            2Q08            1H07              1H08          2Q07           2Q08

                            Net Revenue        Deductions         Reversion of Deductions

         Stable net revenue comparing to 2Q07
          – Change in PIS/Cofins Tax from Cumulative to Non-cumulative generated extraordinary impacts in
           2Q07:
             • Gross Revenue - decrease of R$ 178.2 million
             • Deductions – reversion of R$ 206.7 million
             • Net Revenue – increase of R$ 28.5 million

                                                                                                                  6
Costs and Operational Expenses
                              R$ Million

Costs and Operational Expenses                                    Without Non-recurring Effects


   253
                                                                                  + 4.9 %
              -19.0%
                     205                                                                    205
                                                                         195
                                    164
  175
                     112                      -35.6%                      83
                                                                         102                112                   + 9.3 %
                                                      106                                                               106
                                                                                                           97
                                   132
                                                       58                                                  50
                                                                                                           40               58
                                                                          60
                                                                          60
    45                 60                                                                   60
                                  16                   31                                                 31             31
    33                 33              16            16                   33                33           16            16
                                                                                                          16

  1H07               1H08          2Q07              2Q08               1H07             1H08             2Q07         2Q08
           Power Purchase and Sector Charges                Other Operational Expenses             Depreciation


    TUSDg Costs:
         – Extraordinary impact in 2Q07’s expenses, R$ 92.5 million, retroactively of 07/01/2004
         – Tariff Cycle 2007/2008, R$ 44.3 million (R$ 11 million / quarter)

    Reversal of R$ 15.3 million provision in 2Q07 due to the change of PIS/COFINS tax,
    from cumulative, to non-cumulative


                                                                                                                                 7
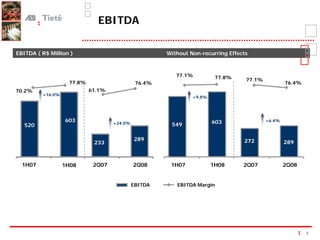
EBITDA

EBITDA ( R$ Million )                                 Without Non-recurring Effects


                                                         77.1%           77.8%    77.1%
                    77.8%                     76.4%                                               76.4%
70.2%                       61.1%
          +16.0%
                                                               +9.8%


                   603              +24.0%                             603                +6.4%
   520
    520                                                549

                                             289
                                             289                                 272
                             233                                                                  289


  1H07             1H08      2Q07            2Q08      1H07            1H08      2Q07             2Q08


                                             EBITDA      EBITDA Margin


                                                                                                          8
Financial Results – R$ Million

Financial Results - R$ Million               Without Non-recurring Effects

      1H07        1H08       2Q07     2Q08      1H07         1H08     2Q07          2Q08

                                 10


      (19)                                                            (21)

      - 431.6 %                                                         - 215.8 %
                                               (50)
                                      (65)                                          (65)
                                                 - 103.0 %


                  (101)                                      (101)


     Increase of the average IGP-M (4.34% in 2Q08 x 0.35% in 2Q07), which
     accrues the Company’s debt – amount of R$ 1.3 billion

     Positive effect in 2Q07 due to the change of PIS/COFINS taxation system,
     totaling R$ 30.8 million


                                                                                           9
Results

Net Income - R$ Million                                  Without Non-recurring Effects

                                                          42.3%                     41.9%
40.9%             39.6%                                                     39.6%
                          37.3%              35.4%
         +1.4%
                                                                                                      35.4%
                                                                   +1.8%
                                  - 5.6 %
   303           307                                        301             307
                                                                                            - 9.1%


                           142                                                      154
                                            134                                                      134
                                                                                                      134


  1H07           1H08      2Q07             2Q08            1H07            1H08    2Q07             2Q08
                                            Net Income         Net Margin

 Proposed Dividends of 100% of 2Q08’s                        Ex-Dividend date 08/14/2008
 Net Income:
    – Dividends: R$ 134.1 million;                           Payment date 08/28/2008
    – Total payment by share:
       - R$ 0.34 / common share
       - R$ 0.37 / preferred share
                                                                                                              10
Consolidated Debt

                                                                                                    in R$ million

                   Amount                 Creditor             Maturity              Cost             Collateral
                   1,287.1                Eletrobrás           May, 2013      IGP-M + 10% p.a.      Receivables
                        0.0              FunCesp III           Sep, 2027       IGP-DI + 6% p.a.     Receivables

Net Debt - R$ Million


            2.0x
                               1.4x
       1,253.5                                         0.7x            0.6x                 0.6x                    0.5x
                              1,096.3

                                                       676.5               681.9            660.9                   606.8


        2003                   2004                    2005                2006              2007                   2Q08

                                      Net Debt (R$ million)                       Net Debt / EBITDA


     Cash Availability 06/30/2008 = R$ 680.3 million
         – Marketable securities with maturities lower than 90 days
         – Average rates around 100% of CDI

                                                                                                                            11
Managerial Cash Flow


                         R$ Million                   2Q07       3Q07      4Q07      1Q08      2Q08
INITIAL CASH                                          683.5      571.2     589.0     633.7      814.6
Operating Cash Flow                                    307.9     248.9     271.2     261.5      279.3
Investments                                            (12.0)      (9.3)   (15.0)      (4.1)    (11.6)
Net Financial Expenses                                 (18.0)    (19.3)    (18.4)     (15.3)    (14.1)
Net Amortization                                       (48.3)    (50.8)    (52.0)     (46.2)    (45.6)
Income Tax                                             (16.6)      (9.8)      -       (15.1)    (16.0)
Dividends and IoE                                     (325.4)    (141.9)   (141.0)      -      (334.1)
Free Cash Flow                                        (112.3)     17.8      44.7     180.9     (142.1)
FINAL CASH OF PARENT COMPANY                          571.2      589.0     633.7     814.6      672.5
Final Cash of Subsidiaries and Associated Companies    28.3        4.2        4.6       6.5       7.8
Final Cash                                            599.4      593.2     638.3     821.0      680.3


   Investments – construction of the SHPP’s at São Paulo (R$ 4.2 million) and upgrade of
   the SHPP’s of AES PCH Minas subsidiary (R$ 1.7 million)
   Payment of dividends regarding 4Q07 and 1Q08

                                                                                                         12
Conclusion


Generation was 28% above Assured Energy in 2Q08


EBITDA of R$ 288.9 million in 2Q08, representing an increase of
24.2% when compared to 2Q07 (R$ 232.6 million)


Net income of R$ 134.1 million in 2Q08, represents a decrease of
5.6% when compared to 2Q07 (R$ 142.1 million)


Proposed dividends corresponding to 100% of 2Q08 net income


                                                                   13
2Q08 Results
The statements contained in this document with regard to the
business prospects, projected operating and financial results, and
growth potential are merely forecasts based on the expectations of
the Company’s Management in relation to its future performance.
Such estimates are highly dependent on market behavior and on
the conditions affecting Brazil’s macroeconomic performance as
well as the electric sector and international market, and they are
therefore subject to changes.

More Related Content

2 q08 earnings call presentation

  • 2. Highlights 2Q08 – Generation 28% above Assured Energy – EBITDA of R$ 288.9 million in 2Q08, an increase of 24.2% when compared to same period of 2007 (R$ 232.6 million) – Net income of R$ 134.1 million in 2Q08, 5.6% lower than that in 2Q07 (R$ 142.1 million) – On May 29th, 2008, the company paid R$ 172.8 million as Dividends regarding 1Q08 results Subsequent Events – Proposed dividends of R$ 134.1 million, corresponding to 100% of net income on 2Q08: - R$ 0.34 per Common Share - R$ 0.37 per Preferred Share 2
  • 3. Energy Balance Generation – MW Average Billed Energy – GWh 7,239 7,292 738 461 121% 128% 115% 914 1,234 109% 107% 112% 1,635 5,587 5,597 1,543 1,363 1,467 1,424 1,392 2003 2004 2005 2006 2007 1H08 1H07 1H08 Generation - MW Average Generation / Assured Energy Eletropaulo MRE CCEE/Losses Increase of 29.4% on Generated Energy Bilateral Contract with Eletropaulo: (2Q08 x 2Q07) – Price until 07/03/2008 – R$ 131.98/MWh – Prices from July, 2008 – R$ 149.72/MWh Generation 28% above Assured Energy (1,275 MW average) MRE Tariff – R$ 7.77/MWh Average price of 2Q08 billed energy at CCEE – R$ 59.72/MWh (R$ 68.82/MWh in 2Q07) 3
  • 4. Investments Capex – 2Q08: R$ 12.9 million 1H08 Capex – 1H08: R$ 18.5 million Equipment – Equipment restoration and upgrade of operating plants - 45.4% R$ 6.0 million Environment 32.3% – Upgrade of the SHPP – R$ 1.7 million IT – Environmental Projects – R$ 3.3 million SHPP – Investments on IT – R$ 0.8 million 17.7% – SHPPs “São José” and “São Joaquim”, at São Paulo (total 4.5% capacity 7MW) – R$ 5.2 million – 3 SHPPs at Rio de Janeiro: Investments – R$ million • Installed Capacity of 52MW 85.9 • The installation license was granted in October 2007 17.7 • Until 06/30/2008 R$ 21.0 million were invested, of SHPPs - RJ which R$ 1.0 million in 1H08 68.2 50.7 • Waiting for the Vegetation Suppression License 46.5 authorization in order to start the construction 27.5 18.5 Capex 2008 – Estimate revised to R$ 85.9 million 2005 2006 2007 2008 (E) 1H08 4
  • 5. Expansion Requirement Requirement: increase installed capacity, by at least, 15% (400 MW), until December 2007: – Increase the installed capacity in São Paulo State; or – Purchase energy from new plants, located in São Paulo, through long term agreements (at least 5 years) Restrictions to accomplish the requirement: – São Paulo State – insufficient hydro resources and environmental restrictions to install Thermo plants; – Insufficiency of gas supply; – “New Model of Electric Sector” (Law # 10,848/04) On February 2008, AES Tietê received a report prepared by a consulting company, regarding the evaluation of possibilities of expanding its generation capacity in São Paulo State. The Company has been developing discussions with different members of the São Paulo State Government, regarding opportunities related to: – Hydroelectric potential – Opportunities for joint generation – Alternative energies 5
  • 6. Gross Revenue – R$ Million Gross Revenue Without Non-recurring Effects +33.1% 809 786 809 608 +2.9% 34 74 74 34 34 (132) 775 775 775 712 712 +86.8% 740 +1.3% +4.6% 395 390 395 211 +8.8% 16 16 16 37 (170) -0.6% +7.4% 381 378 352 352 378 378 1H07 1H08 2Q07 2Q08 1H07 1H08 2Q07 2Q08 Net Revenue Deductions Reversion of Deductions Stable net revenue comparing to 2Q07 – Change in PIS/Cofins Tax from Cumulative to Non-cumulative generated extraordinary impacts in 2Q07: • Gross Revenue - decrease of R$ 178.2 million • Deductions – reversion of R$ 206.7 million • Net Revenue – increase of R$ 28.5 million 6
  • 7. Costs and Operational Expenses R$ Million Costs and Operational Expenses Without Non-recurring Effects 253 + 4.9 % -19.0% 205 205 195 164 175 112 -35.6% 83 102 112 + 9.3 % 106 106 97 132 58 50 40 58 60 60 45 60 60 16 31 31 31 33 33 16 16 33 33 16 16 16 1H07 1H08 2Q07 2Q08 1H07 1H08 2Q07 2Q08 Power Purchase and Sector Charges Other Operational Expenses Depreciation TUSDg Costs: – Extraordinary impact in 2Q07’s expenses, R$ 92.5 million, retroactively of 07/01/2004 – Tariff Cycle 2007/2008, R$ 44.3 million (R$ 11 million / quarter) Reversal of R$ 15.3 million provision in 2Q07 due to the change of PIS/COFINS tax, from cumulative, to non-cumulative 7
  • 8. EBITDA EBITDA ( R$ Million ) Without Non-recurring Effects 77.1% 77.8% 77.1% 77.8% 76.4% 76.4% 70.2% 61.1% +16.0% +9.8% 603 +24.0% 603 +6.4% 520 520 549 289 289 272 233 289 1H07 1H08 2Q07 2Q08 1H07 1H08 2Q07 2Q08 EBITDA EBITDA Margin 8
  • 9. Financial Results – R$ Million Financial Results - R$ Million Without Non-recurring Effects 1H07 1H08 2Q07 2Q08 1H07 1H08 2Q07 2Q08 10 (19) (21) - 431.6 % - 215.8 % (50) (65) (65) - 103.0 % (101) (101) Increase of the average IGP-M (4.34% in 2Q08 x 0.35% in 2Q07), which accrues the Company’s debt – amount of R$ 1.3 billion Positive effect in 2Q07 due to the change of PIS/COFINS taxation system, totaling R$ 30.8 million 9
  • 10. Results Net Income - R$ Million Without Non-recurring Effects 42.3% 41.9% 40.9% 39.6% 39.6% 37.3% 35.4% +1.4% 35.4% +1.8% - 5.6 % 303 307 301 307 - 9.1% 142 154 134 134 134 1H07 1H08 2Q07 2Q08 1H07 1H08 2Q07 2Q08 Net Income Net Margin Proposed Dividends of 100% of 2Q08’s Ex-Dividend date 08/14/2008 Net Income: – Dividends: R$ 134.1 million; Payment date 08/28/2008 – Total payment by share: - R$ 0.34 / common share - R$ 0.37 / preferred share 10
  • 11. Consolidated Debt in R$ million Amount Creditor Maturity Cost Collateral 1,287.1 Eletrobrás May, 2013 IGP-M + 10% p.a. Receivables 0.0 FunCesp III Sep, 2027 IGP-DI + 6% p.a. Receivables Net Debt - R$ Million 2.0x 1.4x 1,253.5 0.7x 0.6x 0.6x 0.5x 1,096.3 676.5 681.9 660.9 606.8 2003 2004 2005 2006 2007 2Q08 Net Debt (R$ million) Net Debt / EBITDA Cash Availability 06/30/2008 = R$ 680.3 million – Marketable securities with maturities lower than 90 days – Average rates around 100% of CDI 11
  • 12. Managerial Cash Flow R$ Million 2Q07 3Q07 4Q07 1Q08 2Q08 INITIAL CASH 683.5 571.2 589.0 633.7 814.6 Operating Cash Flow 307.9 248.9 271.2 261.5 279.3 Investments (12.0) (9.3) (15.0) (4.1) (11.6) Net Financial Expenses (18.0) (19.3) (18.4) (15.3) (14.1) Net Amortization (48.3) (50.8) (52.0) (46.2) (45.6) Income Tax (16.6) (9.8) - (15.1) (16.0) Dividends and IoE (325.4) (141.9) (141.0) - (334.1) Free Cash Flow (112.3) 17.8 44.7 180.9 (142.1) FINAL CASH OF PARENT COMPANY 571.2 589.0 633.7 814.6 672.5 Final Cash of Subsidiaries and Associated Companies 28.3 4.2 4.6 6.5 7.8 Final Cash 599.4 593.2 638.3 821.0 680.3 Investments – construction of the SHPP’s at São Paulo (R$ 4.2 million) and upgrade of the SHPP’s of AES PCH Minas subsidiary (R$ 1.7 million) Payment of dividends regarding 4Q07 and 1Q08 12
  • 13. Conclusion Generation was 28% above Assured Energy in 2Q08 EBITDA of R$ 288.9 million in 2Q08, representing an increase of 24.2% when compared to 2Q07 (R$ 232.6 million) Net income of R$ 134.1 million in 2Q08, represents a decrease of 5.6% when compared to 2Q07 (R$ 142.1 million) Proposed dividends corresponding to 100% of 2Q08 net income 13
  • 14. 2Q08 Results The statements contained in this document with regard to the business prospects, projected operating and financial results, and growth potential are merely forecasts based on the expectations of the Company’s Management in relation to its future performance. Such estimates are highly dependent on market behavior and on the conditions affecting Brazil’s macroeconomic performance as well as the electric sector and international market, and they are therefore subject to changes.