2011 Q4 Results
•
0 likes•337 views

- Eni reported preliminary results for Q4 and full year 2011 with highlights including exceptional progress on future growth projects sanctioned for development in locations such as the US, UK, Norway, Russia, Venezuela and Ghana. - Production ramped up quickly in Libya following the crisis, with Eni-operated volumes almost back to pre-crisis levels by the end of 2011. - Eni strengthened its position to face difficult market conditions through supply agreement negotiations, a focus on efficiency, and asset disposals totaling around €2 billion. - Q4 adjusted net profit was €1.7 billion, with adjusted operating profit of €4.7 billion supported by improved exploration and production results. - Pro
Report
Share


2011 Q4 Results
- 1. 2011 fourth quarter and full year preliminary results February 15th, 2012 eni.com
- 2. 2011 highlights: exceptional progress on future growth USA UK Norway Norway Russia Hadrian N. Culzean GLA (Ekofisk S, Skrugard Samburskoye FID Eldfisk 2) FID Havis (2012) Urengoskoye FID Venezuela Perla FID Ghana Angola Mozambique Indonesia • Gye Nyame Block 15/06 Mamba Jangkrik NE 1 Discoveries South-1 &2 Mukuvo Lira Mamba Major FIDs North-1 Cabaca SE3 (2012) 1.1bn boe of new resources FIDs taken for 140kboe/d by 2015 2
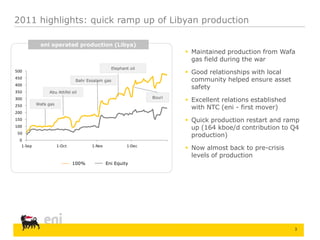
- 3. 2011 highlights: quick ramp up of Libyan production eni operated production (Libya) Maintained production from Wafa gas field during the war Elephant oil 500 Good relationships with local 450 Bahr Essalam gas community helped ensure asset 400 safety 350 Abu Attifel oil Bouri 300 Excellent relations established 250 Wafa gas with NTC (eni - first mover) 200 150 Quick production restart and ramp 100 up (164 kboe/d contribution to Q4 50 production) 0 1-Sep 1-Oct 1-Nov 1-Dec Now almost back to pre-crisis levels of production 100% Eni Equity 3
- 4. 2011 highlights: strengthened position to face difficult markets G&P: tackling worsening market conditions Progress on supply renegotiations, satisfactory agreement reached with Sonatrach Strengthened position in retail segment in Italy, Belgium and France R&M/Petchem: continued effort on efficiency Achieved cost reductions ahead of target Focus on most profitable chemicals segments and launch of bio-based project Disposals: cashed in ~€2bn from international pipelines, marginal assets sale 2011 dividend: +4% year on year 4
- 5. market environment Average European Brent €/$ exchange rate refining margin* $/bl €/bl $/bl €/bl 135 135 6 6 1,5 120 120 5 5 1,45 105 105 4 4 1,4 90 90 3 3 1,35 75 75 2 2 1,3 60 60 1 1 1,25 45 45 0 0 1,2 Q410 Q111 Q211 Q311 Q411 Q410 Q111 Q211 Q311 Q411 Q410 Q111 Q211 Q311 Q411 USD Euro * Brent/Ural FOB Mediterranean market. Eni calculations on Platt’s Oilgram data 5
- 6. Q4 consolidated results Adj. operating profit Adj. net profit Million € Million € 4,739 4,259 1,702 1,540 Q4 10 E&P G&P R&M Other Q4 11 Q4 10 Op. Profit Inv/Fin Taxes Minor Q4 11 adj charges 6
- 7. E&P performance Oil & gas production Adj. operating profit kboe/d Million € 1,954 4,028 4,120 4,200 3,826 3,931 1,684 1,678 1,489 1,473 Q410 Q1 11 Q2 11 Q3 11 Q4 11 Q4 10 Q1 11 Q2 11 Q3 11 Q4 11 Oil Gas 7
- 8. proved reserves mmboe 7,086 7,183 6,843 (7) 97 827 577 2010 production promotions portfolio 2011 price effect 2011 adj 2010 2011 2011 adj RRR Organic: 127% RRR Organic: 143% RRR Organic: 160% RRR All sources: 125% RRR All sources: 142% RRR All sources: 159% Life Index: 10.3 Life Index: 12.3 Life Index: 12.4 Brent 79 Brent 111 Brent 79 $/boe $/boe $/boe Conversion factor 8
- 9. G&P performance Gas sales Adj. operating profit Bcm Million € 31.6 958 27.2 24.7 777 20.3 17.3 385 352 251 Q4 10 Q1 11 Q2 11 Q3 11 Q4 11 Q4 10 Q1 11 Q2 11 Q3 11 Q4 11 Italy International* * Including associates 9
- 10. G&P: ebitda proforma adjusted* million € 1,432 1,051 921 825 675 623 338 550 Q1 10 Q2 10 Q3 10 Q4 10 Q1 11 Q2 11 Q3 11 Q4 11 International Regulated Marketing Transport businesses in Italy * Ebitda pro forma includes: pro-quota ebitda contribution from SRG and associates 10
- 11. R&M performance Process utilization index Adj. operating profit % Million € 26 86 82 83 76 73 -39 -114 -176 -271 Q4 10 Q1 11 Q2 11 Q3 11 Q4 11 Q4 10 Q1 11 Q2 11 Q3 11 Q4 11 11
- 12. other businesses: adjusted operating profit million € Q4 Q4 FY FY Δ% 2010 2011 2010 2011 (74) (154) Petrochemicals (113) (276) -144 378 390 Engineering & 1,326 1,443 +8.8 Construction (43) (69) Other activities (205) (226) -10.2 (86) (19) Corporate (265) (266) n.m. 12
- 13. net debt evolution billion € 28.0 0.5 26.1 13.4 14.3 4.3 2.0 Dec 2010 Operating Divestments Dividends Capex Acquisitions & Dec 2011 cashflow Others 13
- 14. 2012: guidance Exploration & Production: rapid recovery and growth ~10% growth net of PSA effects: New start ups to contribute ca. 70 kboe/d Libya ramp up (average contribution 230-240kboe/d) Gas & Power: impacted by European recession Operating result to be higher than in 2011: supported by Libya recovery, expected retroactive supply benefits pressure on underlying merchant business from worsening market conditions Refining & Marketing: continuing efficiency in complex environment Further efficiency gains and process optimisation Capex In line with 2011 14
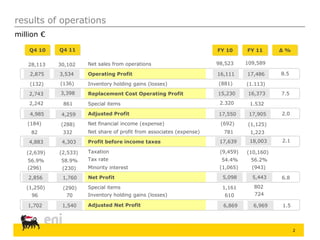
- 16. results of operations million € Q4 10 Q4 11 FY 10 FY 11 Δ% 28,113 30,102 Net sales from operations 98,523 109,589 2,875 3,534 Operating Profit 16,111 17,486 8.5 (132) (136) Inventory holding gains (losses) (881) (1.113) 2,743 3,398 Replacement Cost Operating Profit 15,230 16,373 7.5 2,242 861 Special items 2.320 1.532 4,985 4,259 Adjusted Profit 17,550 17,905 2.0 (184) (288) Net financial income (expense) (692) (1,125) 82 332 Net share of profit from associates (expense) 781 1,223 4,883 4,303 Profit before income taxes 17,639 18,003 2.1 (2,639) (2,533) Taxation (9,459) (10,160) 56.9% 58.9% Tax rate 54.4% 56.2% (296) (230) Minority interest (1,065) (943) 2,856 1,760 Net Profit 5,098 5,443 6.8 (1,250) (290) Special items 1,161 802 96 70 Inventory holding gains (losses) 610 724 1,702 1,540 Adjusted Net Profit 6,869 6,969 1.5 2
- 17. G&P: adjusted operating profit by activities million € -50.5% 777 68 385 31 International Transport 529 523 Regulated business in Italy 180 -169 Marketing Q4 10 Q4 11 3
- 18. unrealized profit in stocks (UPIS) million € Q4 10 Q4 11 FY 10 FY 11 (201) (205) E&P vs R&M (229) (150) 12 25 E&P vs G&P (4) (13) (13) (23) E&C vs Eni Group (38) (52) (202) (203) Total UPIS (271) (189) 4
- 19. eni share of profit from associates Q4 FY 2010 2011 2010 2011 93 100 Equity method accounted for 394 393 28 12 Gas transportation abroad 124 69 - 4 EnBw (GVS) 2 4 35 38 Union Fenosa 119 152 7 9 Blue Stream 36 34 23 37 Others 113 134 4 191 Dividends 264 577 0 (1) Disposals 0 1 (15) 42 Others 123 252 82 332 Net income from associates 781 1,223 5
- 20. G&P share of profit from associates million € +7.0% 100 93 12 8 28 5 80 60 Q4 10 Q4 11 Marketing Regulated business in Italy International Transport 6
- 21. main operating data Q4 10 Q4 11 FY 10 FY 11 Δ% 1,954 1,678 Hydrocarbon prod. (kboe/d) 1,815 1,581 (12.9) 173.6 143.7 Production sold* (mmboe) 638.0 548.5 (14) 10.5 9.3 Natural gas sales in Italy**(bcm) 34.3 34.7 1.1 16.2 14.0 Natural gas sales in Europe*** (bcm) 54.5 53.0 (2.8) 23.0 18.9 Natural gas transported in Italy (bcm) 83.3 78.3 (6.0) 10.2 11.4 Power production sold (TWh) 39.5 40.3 1.9 6.6 6.4 Refined product sales (mmtonnes) 25.5 25.0 (2.0) 1.1 0.9 Petrochemical sales (mmtonnes) 4.7 4.0 (1.5) * Including Eni’s share of production of joint venture accounted for with the equity method ** Including self-consumption *** Consolidated sales 7
- 22. production growth by geographical area kboe/d -14.1% 1,954 419 1,678 145 376 117 128 105 403 381 688 497 182 191 Q4 10 Q4 11 Italy North Af rica West Af rica Kazakhstan America RoW 8
- 23. oil & gas production kboe/d -14.1% 1,954 1,954 182 1,678 1,678 191 1,049 896 1,772 1,487 905 782 Q4 10 Q4 11 Q4 10 Q4 11 Abroad Italy Gas Liquids 9
- 24. capex million € (0.5)% 3,912 3,894 386 285 381 359 615 585 2,573 2,690 -43 Q4 10 Q4 11 -25 E&P G&P R&M E&C Other 10
- 25. eni consolidated results 1.4% -8.5% EPS 0.15 0.36 0.47 0.43 Euro per share* Q4 10 Q4 11 Q4 10 Q4 11 Adjusted Adjusted 23.2% -6.1% 1.22 1.15 0.99 1.08 CFPS Euro per share* Q4 10 Q4 11 Q4 10 Q4 11 Adjusted Adjusted * Average shares: Q4 10 3,622.7 million; Q4 11 3,622.7 million Note: Cash Flow calculated as net profit+amortization & depreciation 11