Location via proxy:   [ UP ]  
[Report a bug]   [Manage cookies]                
SlideShare a Scribd company logo
2012 Energy Summit
The Business of Sustainability

IHS CERA • 16 November 2012
Terms of Use
             The accompanying materials were prepared by IHS CERA Inc. (IHS CERA) and are not to be
             redistributed or reused in any manner without prior written consent, with the exception of
             client internal distribution as described below.
             IHS CERA strives to be supportive of client internal distribution of IHS CERA content but
             requires that

             •   IHS CERA content and information, including but not limited to graphs, charts, tables,
                 figures, and data, are not to be disseminated outside of a client organization to any third
                 party, including a client’s customers, financial institutions, consultants, or the public.

             •   Content distributed within the client organization must display IHS CERA’s legal notices
                 and attributions of authorship.

             Some information supplied by IHS CERA may be obtained from sources that IHS CERA
             believes to be reliable but are in no way warranted by IHS CERA as to accuracy or
             completeness. Absent a specific agreement to the contrary, IHS CERA has no obligation to
             update any content or information provided to a client.


© 2012 IHS        No portion of this presentation may be reproduced, reused, or otherwise distributed in any form without prior written consent.   2
Election 2012 and the US Power Business

   • National Election Cycles Advance the Political Debate
      around Power Issues
             • Energy independence, security and efficiency
             • Technology innovation and adoption
             • A level playing field and an “all of the above” energy policy
             • International competitiveness, jobs and clean energy


    Source: IHS CERA

© 2012 IHS     No portion of this presentation may be reproduced, reused, or otherwise distributed in any form without prior written consent.
                                                                                                                                                3
Share of US Power Generation (kWh), 1950–2011

                   100%                                                              Renewable/Other
                                                                                              Hydro
                     90%
                                                                                             Nuclear
                     80%

                     70%                                                                     Natural Gas

                     60%
                                                                                                 Oil
                     50%

                     40%

                     30%
                                                                                               Coal
                     20%

                     10%

                        0%
                          1950                    1960                  1970                  1980                 1990                  2000     2010


        Source: IHS CERA and US Energy Information Administration.


© 2012 IHS       No portion of this presentation may be reproduced, reused, or otherwise distributed in any form without prior written consent.
                                                                                                                                                         4
Historical Growth in US Major Shale Play Production

               20
               18
                                                                                                                                            Eagle Ford
               16
               14
                                                                                                                                     Marcellus
               12
  Bcf 10                                                                                                                                                 Haynesville
  per
  Day 8                                                                                                                                               Fayetteville
                 6                                                                                                                                        Woodford

                 4
                 2                                                                                                                          Barnett

                 0
                  2003                2004                2005               2006               2007                2008               2009              2010        2011

             Source: IHS CERA. Data source: Lippman Consulting. Note: Bcf = billion cubic feet.


© 2012 IHS           No portion of this presentation may be reproduced, reused, or otherwise distributed in any form without prior written consent.
                                                                                                                                                                       5
Greenhouse Gas Emissions, History, and Policy Targets

                    7                   Coal-fired Generation Carbon Footprint
                                        Natural Gas–fired Generation Carbon Footprint
                    6

                    5                           Economywide                                                              80% Reduction from
                                                  Emissions                                                                Current Levels

                    4
    Gigatons
                    3                                                                      Power Sector Share
                                                                                             of Target (40%)
                    2

                    1

                    0
                    1990                    2000                   2010                  2020                    2030                  2040   2050

                    Source: IHS CERA and US Energy Information Administration.


© 2012 IHS   No portion of this presentation may be reproduced, reused, or otherwise distributed in any form without prior written consent.
                                                                                                                                                     6
Timeline of Wind Production Tax Credit (PTC) Extensions

         2000:                    2002:                        2004:                       2005:                       2008:
                                                                                                                        PTC                       2012:
          PTC                      PTC                          PTC                         PTC                                                 PTC set
       extended                 extended                     extended                    extended                    extended
                                                                                                                      through                   to expire
        through                  through                      through                     through                                                   on
       December                 December                     December                    December                    December
                                                                                                                        2009                   December
          2001                     2003                         2005                        2007                                                   31st

1999 2000 2001 2002 2003 2004 2005 2006 2007 2008 2009 2010 2011 2012


   1999:                   2001:                      2003:                         2006:                               2009:
PTC expired                PTC                         PTC                           PTC                                 PTC
    on                   expired on                 expired on                    extended                            extended
 December                December                   December                       through                             through
    31st                    31st                       31st                       December                            December
                                                                                     2008                                2012


    Source: IHS Emerging Energy Research

© 2012 IHS    No portion of this presentation may be reproduced, reused, or otherwise distributed in any form without prior written consent.
                                                                                                                                                            7
PowerShares WilderHill Clean Energy Portfolio
   (PBW) versus S&P 500, 2005–12 Year-to-Date

                        2.0
                                                                                                                                           S&P 500
                        1.8                                                                                                                PBW
                        1.6
      Index 1.4
      Value
     (March 1.2
       2005 1.0
        = 1)
             0.8
                        0.6
                        0.4
                        0.2
                        0.0
                           2005                2006               2007              2008               2009               2010               2011             2012
Source: IHS CERA.
Data source: Yahoo! Finance.
Note: The PowerShares WilderHill Clean Energy Portfolio is based on the WilderHill Clean Energy Index . The index is designed to deliver capital appreciation through the
selection of companies that focus on greener and generally renewable sources of energy and technologies that facilitate cleaner energy.

© 2012 IHS         No portion of this presentation may be reproduced, reused, or otherwise distributed in any form without prior written consent.
                                                                                                                                                                            8
For more information about this presentation or
                IHS in general, please contact

                                                         Kyle Taylor
                                                      +1 303 466 3040
                                                     Kyle.Taylor@ihs.com


© 2012 IHS   No portion of this presentation may be reproduced, reused, or otherwise distributed in any form without prior written consent.   9

More Related Content

2012 Energy Summit: The Business of Sustainability

  • 1. 2012 Energy Summit The Business of Sustainability IHS CERA • 16 November 2012
  • 2. Terms of Use The accompanying materials were prepared by IHS CERA Inc. (IHS CERA) and are not to be redistributed or reused in any manner without prior written consent, with the exception of client internal distribution as described below. IHS CERA strives to be supportive of client internal distribution of IHS CERA content but requires that • IHS CERA content and information, including but not limited to graphs, charts, tables, figures, and data, are not to be disseminated outside of a client organization to any third party, including a client’s customers, financial institutions, consultants, or the public. • Content distributed within the client organization must display IHS CERA’s legal notices and attributions of authorship. Some information supplied by IHS CERA may be obtained from sources that IHS CERA believes to be reliable but are in no way warranted by IHS CERA as to accuracy or completeness. Absent a specific agreement to the contrary, IHS CERA has no obligation to update any content or information provided to a client. © 2012 IHS No portion of this presentation may be reproduced, reused, or otherwise distributed in any form without prior written consent. 2
  • 3. Election 2012 and the US Power Business • National Election Cycles Advance the Political Debate around Power Issues • Energy independence, security and efficiency • Technology innovation and adoption • A level playing field and an “all of the above” energy policy • International competitiveness, jobs and clean energy Source: IHS CERA © 2012 IHS No portion of this presentation may be reproduced, reused, or otherwise distributed in any form without prior written consent. 3
  • 4. Share of US Power Generation (kWh), 1950–2011 100% Renewable/Other Hydro 90% Nuclear 80% 70% Natural Gas 60% Oil 50% 40% 30% Coal 20% 10% 0% 1950 1960 1970 1980 1990 2000 2010 Source: IHS CERA and US Energy Information Administration. © 2012 IHS No portion of this presentation may be reproduced, reused, or otherwise distributed in any form without prior written consent. 4
  • 5. Historical Growth in US Major Shale Play Production 20 18 Eagle Ford 16 14 Marcellus 12 Bcf 10 Haynesville per Day 8 Fayetteville 6 Woodford 4 2 Barnett 0 2003 2004 2005 2006 2007 2008 2009 2010 2011 Source: IHS CERA. Data source: Lippman Consulting. Note: Bcf = billion cubic feet. © 2012 IHS No portion of this presentation may be reproduced, reused, or otherwise distributed in any form without prior written consent. 5
  • 6. Greenhouse Gas Emissions, History, and Policy Targets 7 Coal-fired Generation Carbon Footprint Natural Gas–fired Generation Carbon Footprint 6 5 Economywide 80% Reduction from Emissions Current Levels 4 Gigatons 3 Power Sector Share of Target (40%) 2 1 0 1990 2000 2010 2020 2030 2040 2050 Source: IHS CERA and US Energy Information Administration. © 2012 IHS No portion of this presentation may be reproduced, reused, or otherwise distributed in any form without prior written consent. 6
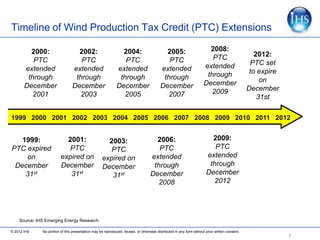
  • 7. Timeline of Wind Production Tax Credit (PTC) Extensions 2000: 2002: 2004: 2005: 2008: PTC 2012: PTC PTC PTC PTC PTC set extended extended extended extended extended through to expire through through through through on December December December December December 2009 December 2001 2003 2005 2007 31st 1999 2000 2001 2002 2003 2004 2005 2006 2007 2008 2009 2010 2011 2012 1999: 2001: 2003: 2006: 2009: PTC expired PTC PTC PTC PTC on expired on expired on extended extended December December December through through 31st 31st 31st December December 2008 2012 Source: IHS Emerging Energy Research © 2012 IHS No portion of this presentation may be reproduced, reused, or otherwise distributed in any form without prior written consent. 7
  • 8. PowerShares WilderHill Clean Energy Portfolio (PBW) versus S&P 500, 2005–12 Year-to-Date 2.0 S&P 500 1.8 PBW 1.6 Index 1.4 Value (March 1.2 2005 1.0 = 1) 0.8 0.6 0.4 0.2 0.0 2005 2006 2007 2008 2009 2010 2011 2012 Source: IHS CERA. Data source: Yahoo! Finance. Note: The PowerShares WilderHill Clean Energy Portfolio is based on the WilderHill Clean Energy Index . The index is designed to deliver capital appreciation through the selection of companies that focus on greener and generally renewable sources of energy and technologies that facilitate cleaner energy. © 2012 IHS No portion of this presentation may be reproduced, reused, or otherwise distributed in any form without prior written consent. 8
  • 9. For more information about this presentation or IHS in general, please contact Kyle Taylor +1 303 466 3040 Kyle.Taylor@ihs.com © 2012 IHS No portion of this presentation may be reproduced, reused, or otherwise distributed in any form without prior written consent. 9