2016 William Blair Case Competition, Winner
•
2 likes•3,745 views

Kona Adventures is a leading provider of travel and entertainment services that maintains its market position through organic and inorganic growth. Valuation analyses place Kona's enterprise value between $560-600 million based on 2016E revenue of $206.2 million and EBITDA of $52.6 million. Comparable analyses and precedent M&A transactions support a valuation range of $552.1-604.7 million. It is recommended that Kona pursue a near-term sale to a strategic buyer given compelling financials and historically strong market conditions.
Report
Share


2016 William Blair Case Competition, Winner
- 1. Kona Adventures Matt Bender | Jimmy Kruse | Michael Loffredo MiamiUniversity
- 2. Agenda Executive summary Industry drivers Company overview Valuation analysis Strategic options Final thoughts WilliamBlaircasecompetition 3 4 7 10 16 24
- 3. Kona presents an attractive opportunity in a peak marketExecutivesummary Sell-side advisory Valuation overview Enterprise Value ($mm) Potential buyers 3 Kona Adventures is a leading provider of travel and entertainment services with a primary focus on corporate travel Maintains its market position with a loyal customer base, strong management team, and significant organic and inorganic growth drivers Valuation analyses place Kona’s enterprise value between $560mm — $600mm 2016E revenue: $206.2mm 2016E EBITDA: $52.6mm Analysis of past transactions and the potential for synergies along with historically strong market conditions leads to a recommendation of pursing a near- term sale to a strategic buyer Compelling story & financials Source: Team projections $500 $550 $600 $650 $700 Leveraged Buyout (10.3x - 11.4x) DCF - Exit Multiple (12.0x - 12.7x) DCF - Perpetuity (10.8x - 11.8x) Comparable Analysis (10.5x - 11.5x) Precedent Analysis (11.0x - 12.0x)
- 4. Agenda Executive summary Industry drivers Company overview Valuation analysis Strategic options Final thoughts WilliamBlaircasecompetition 3 4 7 10 16 24
- 5. Continuing growth in the broad travel marketIndustrydrivers Growth in the overall travel industry will remain steady and continue to drive the need for global travel services Consumer behavior will continue to change quickly, and consumer needs will become increasingly diverse Supply-side services, (e.g. hotels and destination services) will remain fragmented, and there will always be the need for an intermediary Developing regions will experience strongest growth in demand for travel Kona’s recent expansion into Asia will allow the company to capitalize on this growth Travel services industry revenue growth 4 Projection for number of outbound trips by region Commentary $0 $10,000 $20,000 $30,000 $40,000 2009 2010 2011 2012 2013 2014 2015 2016P 2017P 0 100 200 300 400 500 600 North America Europe LATAM MEA APAC 2013 2018E ($ in millions) (in millions) Sources: Euromonitor, IBIS world, investor presentations
- 6. Positioning within the travel industryIndustrydrivers Players in the global travel service industry are providers of high value, real-time information related to travel and entertainment itineraries Companies provide value-add services to both travel providers and buyers Requires strong relationships with both vendors and customers Consumers can now bypass traditional brick-and-mortar travel agencies, conduct their own research, and purchase directly online Travelers 5 Commentary Travel buyers Value-add services Providers Airlines Cruise Car rental Hotels Airlines Leisure Business Online travel agencies Offline travel agencies Travel management companies Corporations Tour operators Meta-search Secure efficient B2B payment solutions Improved efficiency of complex/high volume operations Expanded addressable customer base and offering Efficient workflow automation and improved productivity Reduced operating costs Source: Investor presentations
- 7. Travel services have outperformed the broader marketIndustrydrivers Within the broader travel industry, travel service providers have outperformed significantly Low-barriers to entry and highly-fragmented conditions, particularly among smaller companies, are conducive to acquisition activity Further integration of travel services that are provided by these companies is making it much easier for consumers and businesses to plan trips while also providing a more dynamic experience Indexed travel industry performance (weighted by market capitalization) 6 Commentary Source: Bloomberg 70 90 110 130 150 170 190 Comparable set Dow travel & tourism index S&P500
- 8. Agenda Executive summary Industry drivers Company overview Valuation analysis Strategic options Final thoughts WilliamBlaircasecompetition 3 4 7 10 16 24
- 9. Strong positioning with room for growthCompanyoverview Kona Adventures is a leading provider of travel and entertainment services to primarily small and medium size businesses Includes airfare accommodation, hotel booking, transportation services, and entertainment planning For each transaction that Kona facilitates, it receives a percentage of the total cost The company provides “service” transactions, which are those done by Kona employees, as well as “digital” transactions, which are those made by clients using an app or online means Strong projected EBITDA growth as the company moves to expand into new markets through acquisition and grow an already large and diverse customer base 22.0% 24.0% 26.0% 28.0% 30.0% $0 $20 $40 $60 $80 $100 2015A 2016E 2017P 2018P 2019P 2020P 2021P EBITDA EBITDA Margin EBITDA growth and margins 45.0% 25.0% 20.0% 10.0% Small to medium business (SMB) Large corporations Personal (luxury) Local business 2016E sales by end market 7Sources: Team projections and company materials ($ in millions)
- 10. Customer and service diversificationCompanyoverview Recent emphasis on entertainment planning allows for diversification of revenue Complete integration from air travel to event attendance Kona creates value for its customers by removing the need for an in-house administrative travel process Strong vendor relationships provide superior access for customers The company maintains and continues to grow its global presence through its multinational customer base 25% of 2016E sales are through European markets Service / solution offerings breakdown by revenue 8 Customer concentration trends Commentary 58.5%23.8% 11.3% 6.5% Aircraft accomodation Hotel booking Transportation services Entertainment planning 54.8% 24.7% 10.0% 10.4% 44.4% 28.4% 8.4% 18.9% 2013 2016 2021 0% 10% 20% 30% 40% 50% Small to medium business Large corporations Personal (luxury) Local business 2011 2016E Sources: Company materials and team projections
- 11. Positioning analysisCompanyoverview 9 W TO S Second to market in fast growing service offerings and geographic segments Focused in business travel, which is growing slower than leisure travel Growth of direct booking that allows for greater discounts Low barriers to entry and high fragmentation lead to a very competitive landscape Cyclical nature of travel industry poses macroeconomic risk Current portfolio offering and strong vendor relationships allow customers broad access Strong and committed management team Diverse geographic presence Further expansion into Asia and other developing areas Pursuing acquisitions to expand offerings, such as education services Development of new vendor relationships Source: Company materials
- 12. Agenda Executive summary Industry drivers Company overview Valuation analysis Strategic options Final thoughts WilliamBlaircasecompetition 3 4 7 10 16 24
- 13. Valuation overviewValuationanalysis $500 $550 $600 $650 $700 Leveraged Buyout (10.3x - 11.4x) DCF - Exit Multiple (12.0x - 12.7x) DCF - Perpetuity (10.8x - 11.8x) Comparable Analysis (10.5x - 11.5x) Precedent Analysis (11.0x - 12.0x) 2016E EBITDA multiple: Enterprise Value ($ in millions): 9.5x 10.5x 11.4x 12.4x 13.3x 10 Valuation Range: $560mm — $600mm Source: Team projections
- 14. Comparable company analysisValuationanalysis ($ in millions, except for price. Data as of November 3, 2016) Company name Ticker & exchange Price % of 52 Market Cap Enterprise LTM 2016E EBITDA Enterprise Value EBITDA week high value EBITDA Revenue EBITDA Revenue margin LTM EBITDA 2016E EBITDA 2016E Revenue YOY Growth Corporate Travel Management CTD AU A$18.12 94.1% $2,346 $2,308 $90 $339 $116 $437 26.5% 25.7x 19.9x 5.3x 29.1% eDreams Odigeo SL EDR SM € 2.70 87.6% 314 674 105.2 546.0 111.6 543.7 19.3% 6.4x 6.0x 1.2x 13.3% Lastminute.com NV LMN SW CHF 13.70 87.0% 195 122 13.1 253.1 14.6 260.5 5.2% 9.3x 8.4x 0.5x NA MakeMyTrip Ltd. MMYT US $27.00 84.6% 1,140 1,125 (76) 374 (53) 224 (20.2%) NA NA 5.0x NA Sabre Corp. SABR US $23.46 78.2% 6,573 9,764 924 3,248 1,084 3,393 28.5% 10.6x 9.0x 2.9x 29.0% Smiles SA SMLE3 BZ R$54.75 91.9% 2,148 2,025 171 459 166 468 37.2% 11.9x 12.2x 4.3x 24.3% Travelport Worldwide Ltd. TVPT US $13.44 88.3% 1,667 3,976 527 2,310 608 2,491 22.8% 7.5x 6.5x 1.6x 11.8% Travelzoo Inc. TZOO US $9.15 69.0% 127 102 13 131 12 129 9.6% 8.1x 8.3x 0.8x 9.1% WebJet Ltd. WEB AU A$9.31 76.3% 1,183 1,104 48 198 72 277 24.3% 22.9x 15.4x 4.0x 56.8% Kona Adventures $52.6 $206.2 25.5% 15.4% High $6,573 $9,764 $924 $3,248 $1,084 $3,393 37.2% 25.7x 19.9x 5.3x 56.8% 3rd Quartile 2,148 2,308 171 546 166 544 26.5% 14.6x 13.0x 4.3x 29.1% Median 1,183 1,125 90 374 112 437 22.8% 10.0x 8.7x 2.9x 24.3% Mean 1,744 2,356 202 873 237 913 17.0% 12.8x 10.7x 2.8x 24.8% 1st Quartile 314 674 13 253 15 260 9.6% 7.9x 7.8x 1.2x 12.6% Low 127 102 (76) 131 (53) 129 (20.2%) 6.4x 6.0x 0.5x 9.1% Commentary Derived valuation Comparable companies are similar in size and derive revenue from around the world Much of the North American market has been consolidated into three large players Travel technology companies were chosen to represent Kona’s scalable platform Kona Adventures' 2016E EBITDA $52.6 Comparable Multiple Range 10.5x 11.5x Enterprise Value Range $552.1 $604.7 Source: Bloomberg 11
- 15. ($ in millions, except for price. Data as of November 3, 2016) Target company Acquirer Transaction Announcement Transaction Premium Transaction Value type date value Revenue EBITDA EBIT eLong Inc. China E-Dragon Holdings Ltd Strategic 2/4/2016 $75.8 27.5% 2.0x -- -- Ikyu Corp. Yahoo Japan Corp. Strategic 12/15/2015 774.2 39.1% 13.0x 35.7x 36.9x Orbitz Worldwide Inc. Expedia Inc. Strategic 2/12/2015 1,595.5 26.5% 1.7x 11.4x 19.5x Wotif.com Holdings Ltd. Expedia Inc. Strategic 7/7/2014 584.2 32.6% 4.0x 8.5x 9.6x Astaka Holdings Ltd. Corporate Travel Management Strategic 11/20/2013 49.2 40.5% 2.2x 8.1x 9.1x Qunar Cayman Islands Ltd. Ocean Management Ltd. Sponsor 6/23/2016 4,067.4 7.9% 6.0x -- -- Kuoni Reisen Holding AG EQT Partners AB Sponsor 2/2/2016 1,351.3 25.0% 0.4x 10.0x 16.6x Opodo Ltd. AXA SA Sponsor 7/1/2011 613.2 -- 4.1x 11.7x 17.2x High 13.0x 35.7x 36.9x 3rd Quartile 4.6x 11.6x 18.9x Median 3.1x 10.7x 16.9x Mean 4.2x 14.2x 18.1x 1st Quartile 2.0x 8.9x 11.3x Low 0.4x 8.1x 9.1x Precedent transaction analysisValuationanalysis Commentary Derived valuation Precedent transactions were chosen from similarly sized companies with comparable growth rates North America’s consolidation has taken place with far larger companies Recent sponsor activity has been in emerging markets as middle class develops Kona Adventures' 2016E EBITDA $52.6 Comparable Multiple Range 11.0x 12.0x Enterprise Value Range $604.7 $657.3 Source: Bloomberg 12
- 16. Discounted cash flows analysisValuationanalysis Derived valuation ($ in millions, except for price. FY ended December 31,) Estimated Projected 2016E 2017P 2018P 2019P 2020P 2021P EBITDA 52.6 60.7 66.7 73.4 84.0 91.3 Less: D&A 0.5 0.5 0.6 0.5 0.7 1.0 EBIT 52.1 60.2 66.1 72.9 83.2 90.4 Tax Effect @ 35.0% 18.2 21.1 23.1 25.5 29.1 31.6 NOPAT 33.9 39.1 43.0 47.4 54.1 58.7 Add: D&A 0.5 0.5 0.6 0.5 0.7 1.0 Less: CapEx (0.7) (0.7) (0.7) (0.8) (0.9) (1.0) Less: Acqusition Costs 0.0 0.0 0.0 0.0 0.0 0.0 Less: Changes in NWC (14.8) (2.3) (2.6) (2.6) (3.0) Free Cash Flow 24.1 40.5 44.5 51.4 55.7 PV of FCF 20.0 30.5 30.5 32.1 31.6 Assumptions Revenue growth peaks in 2019 at 10%+ Normalized margins WACC of 9.9% Comparable assumptions Comparable unlevered betas were used in determining Kona’s systematic risk Cost of debt was estimated using debt comparables Exit multiple method led to higher valuation due to double digit EBITDA growth Low capital expenditures result in higher FCF Commentary Exit Multiple Method Exit Multiple 10.0x Terminal Value 913.4 PV of Terminal Value 517.9 Plus: PV of Future FCF 144.6 Enterprise Value 662.4 Perpetuity Growth Method Perpetuity Growth Rate 2.75% Terminal Value 798.3 PV of Terminal Value 452.6 Plus: PV of Future FCF 144.6 Enterprise Value 597.2 Sources: Bloomberg and team projections 13
- 17. Leveraged buyout analysisValuationanalysis Leveraged assumptions Leverage 5.5x EBITDA consisting of term loan B at 6.5% fixed interest Consists of a 3.0% repayment rate per year Debt comprised 50% of initial sources Multiple assumptions Assumes a 10.5x exit multiple, which implies a 10.5x entry multiple Limited capital expenditures maximize cash flow available for debt repayment Asset-light base results in sizable goodwill creation CommentaryCapital structure Exit Multiple SponsorTarget IRR 9.5x 10.0x 10.5x 11.0x 11.5x 21.0% 568.2 586.2 604.2 622.3 640.3 23.0% 543.3 559.8 576.4 592.9 609.4 25.0% 520.9 536.1 551.3 566.5 581.7 27.0% 500.7 514.7 528.7 542.7 556.7 29.2% 480.7 493.5 506.3 519.1 531.9 EV sensitivity analysis Sources: Bloomberg and team projections ($ in millions) 14 $0 $200 $400 $600 $800 $1,000 $1,200 $1,400 2017P 2018P 2019P 2020P 2021P Equity Debt
- 18. Historically long bull market brings downside riskValuationanalysis Industry revenue is driven by discretionary spending, which is one of the first metrics affected during a recession Extravagant corporate travel is first to go when earnings slide In a modeled recession, revenues drop ~5% in consecutive years as travel spending is curtailed Earnings rebound in 2021P Low asset base allows for high variable costs and low overhead Projected downside beginning in 2019P results in a valuation ~20% below the current valuation range Use of debt allows for less downside in leveraged buyout scenario Valuation impact Top-line numbers hit hardest in a 2019P recession $150 $200 $250 $300 $350 2014A 2015A 2016E 2017P 2018P 2019P 2020P 2021P Base Downside $0 $200 $400 $600 $800 Base Downside DCF - Exit multiple DCF - Perpetuity Leveraged buyout $168mm of cumulative revenue lost Sources: Team projections and company materials ($ in millions) ($ in millions) 15
- 19. Agenda Executive summary Industry drivers Company overview Valuation analysis Strategic options Final thoughts WilliamBlaircasecompetition 3 4 7 10 16 24
- 20. Potential acquisition targetsStrategicoptions Source: Company websites 16 Kona Adventures Choose to enter a new, fast-growing market segment, that has seen a flurry of recent deal activity Continue to develop technology platform as a value proposition for clients through acquisition Studentuniverse.com, Inc. provides ticket booking, hotel book, and activity booking services exclusively for students BeatnPaths, Inc. is a B2B cloud platform connecting global attractions and activities with agencies, hotels, and airlines to enhance travel experience Kona’s proven acquisition history and financial capacity continue to make it an acquiror of choice
- 21. Potential acquisition financial impactStrategicoptions Proposed acquisition takes place in 2017P and has small financial impact Penetration into new market allows for further acquisitive actions in 2018+ In a levered buyout situation, initial cash outlay is mitigated by additional cash available for debt repayment in subsequent years Acquisition can result in a valuation increase that is 2.0x initial investment $12.2 million EBITDA impact $0 $20 $40 $60 $80 $100 2013A 2014A 2015A 2016E 2017P 2018P 2019P 2020P 2021P Organic Incremental Addition Commentary Sources: Team projections and company materials ($ in millions) ($ in millions) 17 Cash available for debt repayment ($15) $0 $15 $30 $45 $60 2017P 2018P 2019P 2020P 2021P Organic Incremental Source (Use)
- 22. Strategic buyer universeStrategicoptions Initial Outlay Integrated / Operators Technology platformTravel service Due to Kona’s attractive value proposition in a consolidating market, the company would be very attractive to a strategic industry player Asset-light base and tech-enabled platform provide further incentives for acquisition The company can be expected to draw interest from various players within the travel industry Sources: Travel Weekly, Bloomberg, CapIQ 18
- 23. TTS is a global leading player in the development of innovative solutions for the travel and tourism industry Targeted strategic buyersStrategicoptions RationaleMetrics Size and legacy platform motivates acquisition Current dependency on brick-and-mortar locations Stated expansion plans for online booking and research capabilities Sources: Company websites, CapIQ Privately Held $3.8B in sales in 2015 Privately Held $2.5B in sales in 2015 LTM sales of £14.6B LTM EBITDA of £1.3B Private Held $2.8B in sales in 2015 Description AAA Travel, a subsidiary of AAA, offers products and services directly to consumers via brick-and- mortar locations and online Altour is the largest independently owned travel management company in the U.S., serving luxury and mid-markets TUI Group is a leading tourism company. Based in Germany, it boasts 1,800 travel agencies, six airlines, and 300 hotels Travel and Transport is a full service travel management company headquartered in Omaha, Nebraska An American Express Travel Representative Four acquisitions in the last 12 months Concentration within corporate travel fits Kona’s current revenue concentration Provides international growth platform Fully-integrated business model creates expansion opportunity for Kona’s event segment Market-leading expertise in technology solutions for the travel and tourism industry Platform for growth in domestic and international markets Concentrates on corporate event management Looking to enter faster growing luxury tourism management Recent Gallup market study confirmed commitment to advancement in travel industry Privately Held 19
- 24. Financial sponsors universeStrategicoptions Rationale Invests in media, communications, business, and information services companies Partners with management to help build the business and allow synergies Currently maintains investments in corporate travel management companies Criteria Equity value of ~$150mm N/A but recently partnered to invest $900mm in equity Partners with company management to create long-term value Invests in the travel, transportation, hospitality, and payment sectors Current investments; American Express Global Business Travel and Travel Leaders Group Multi-stage investment firm exclusively focused on global travel private equity and venture capital investments 80% of firm investments are as private equity Supports a robust travel portfolio Equity value between $30-250mm Seeks to find high growth businesses in a variety of industries Invested in several travel companies including Reed & Mackay, CTC Aviation Group and Griffin Global Equity value of ~$120mm Source: Company websites 20
- 25. Financial sponsors universeStrategicoptions RationaleCriteria Source: Company websites Equity value of $30- 100mm but is able to partner for more equity Equity value above $250mm Equity value between $100-500mm N/A First independent private equity firm focused on Chinese travel and tourism sector Invests across all aspects of the travel industry; hotels and resorts, attractions, online and offline travel agencies and operators, transportation services, and related business solution providers. Focused on business services and technology Current investments in travel industry include Odigeo, which is the leading online travel agency in Western Europe Invests in a wide range of industries including the transport & travel sectors Recently purchased Kuoni group, a leading service provider to the global travel industry Financial capacity Involved in the middle market travel services industry Three related transactions during the past 30 months 21
- 26. Selected buyersStrategicoptions Source: Company websites Certares focuses exclusively on the travel, transportation, hospitality, and payment sectors. The management team has significant experience operating companies within the travel sector, particularly travel management companies. The firm owns American Express Global Business Travel and Travel Leaders group. Because of these portfolio companies, we believe that Kona would be a strong fit to provide new growth opportunities and product offerings, which would likely allow for a higher price to be paid. Altour is an established travel management company through its American Express Travel Representative membership. Additionally, they are one of the few asset-light travel management companies to be involved in corporate, leisure, and event management services. With over $2.5B in sales in 2015, Altour’s size would make an acquisition possible, with the potential for significant synergies as a result of the transaction. 22
- 27. Favorable time for saleStrategicoptions Recent run-up in comparable equity prices has been due to investor sentiment, not financial results Run almost solely driven by multiple expansion Spurred-on by acquisition rumors Overall M&A market has been stagnant Multiples have leveled out during the past 24 months Combination of factors make it an ideal time for Kona Adventures to go to market Middle-market multiples have stagnated… …But travel service comparables are at historic highs Commentary Sources: Team projections and Pitchbook 0.0x 4.0x 8.0x 12.0x 16.0x 1Q 2Q 3Q 4Q 1Q 2Q 3Q 4Q 1Q 2Q 2014 2015 2016 (EV/EBITDA multiples for transactions with EV>$250mm) 6.0x 10.0x 14.0x 2/10/2016 4/8/2016 6/7/2016 8/4/2016 10/3/2016 (Comparable companies EV/EBITDA multiples) 23
- 28. Agenda Executive summary Industry drivers Company overview Valuation analysis Strategic options Final thoughts WilliamBlaircasecompetition 3 4 7 10 16 24
- 29. Kona presents an attractive opportunity in a peak marketFinalthoughts Strategic vs. sponsored Alternative growth opportunities Valuation overview Enterprise Value ($mm) Final recommendation A sale to a strategic buyer offers Kona a number of advantages Larger global platform to continue to penetrate international markets and grow share in existing segments Stronger synergies from cross- selling opportunities Current management will be left on to spearhead new growth opportunities An acquisition of StudentUniverse would begin a move into the fast-growing, fragmented student travel industry BeatnPaths would build on an already solid technology platform to connect clients with travel experience opportunities We recommend that Kona Adventures engages in a sale to Altour International, Inc. Strong synergies along with the opportunity for entirely new growth channels This sale should take place in the near-term given strong current market conditions Implied valuation range of $560 — $600mm 24 $500 $550 $600 $650 $700 Leveraged Buyout (10.3x - 11.4x) DCF - Exit Multiple (12.0x - 12.7x) DCF - Perpetuity (10.8x - 11.8x) Comparable Analysis (10.5x - 11.5x) Precedent Analysis (11.0x - 12.0x)
- 31. Pro forma statement of incomeAppendix Statement of income Historical Estimated Projected 2013A 2014A 2015A 2016E 2017P 2018P 2019P 2020P 2021P Airfare accomodation $95.1 $101.0 $106.7 $113.1 $119.3 $124.1 $128.4 $132.4 $135.9 Hotel booking 38.7 42.5 46.5 50.9 57.0 64.9 72.1 80.0 86.9 Transportation services 18.3 19.0 19.8 20.7 21.6 22.5 23.5 24.5 25.6 Entertainment planning 10.5 13.2 16.7 21.5 26.9 35.5 47.9 63.0 77.7 Total revenue $162.7 $175.6 $189.7 $206.2 $224.8 $247.0 $272.0 $299.9 $326.2 Service costs (non-payroll) 63.8 68.5 75.9 85.6 94.4 106.2 119.7 131.9 143.5 Digital/apps/online costs 37.1 39.9 39.8 41.2 42.7 44.5 46.2 48.0 48.9 Payroll costs 26.0 26.3 27.5 26.8 27.0 29.7 32.6 36.0 42.4 Potential acquisition expenses - - - - - - - - - - - - - - - - - - Depreciation & amortization expense 0.3 0.4 0.6 0.5 0.5 0.6 0.5 0.7 1.0 EBIT $35.5 $40.6 $45.9 $52.1 $60.2 $66.1 $72.9 $83.2 $90.4 Interest expense 10.1 10.1 10.1 10.1 10.1 10.1 Tax provision 12.4 14.2 16.1 14.7 17.5 19.6 22.0 25.6 28.1 Net income $23.0 $26.4 $29.8 $27.3 $32.5 $36.4 $40.8 $47.5 $52.2 Depreciation & amortization 0.3 0.4 0.6 0.5 0.5 0.6 0.5 0.7 1.0 Capital expenditures 0.2 0.5 5.5 0.7 0.7 0.7 0.8 0.9 1.0 EBITDA $35.8 $40.9 $46.5 $52.6 $60.7 $66.7 $73.4 $84.0 $91.3 Margin analysis EBITDA 22.0% 23.3% 24.5% 25.5% 27.0% 27.0% 27.0% 28.0% 28.0% D&A (as a % of Total revenue) 0.2% 0.2% 0.3% 0.2% 0.2% 0.2% 0.2% 0.3% 0.3% CapEx (as a % of Total revenue) 0.1% 0.3% 2.9% 0.3% 0.3% 0.3% 0.3% 0.3% 0.3% NWC (as a % of Total revenue) 4.0% 3.3% 4.3% 10.6% 10.6% 10.5% 10.4% 10.5% EBIT 21.8% 23.1% 24.2% 25.3% 26.8% 26.8% 26.8% 27.8% 27.7% % Cost of sales Service costs (non-payroll) 39.2% 39.0% 40.0% 41.5% 42.0% 43.0% 44.0% 44.0% 44.0% Service costs (non-payroll, as a % of Service revenue) 71.9% 73.2% 78.9% 85.8% 88.0% 91.1% 92.1% 90.8% 89.7% Digital/apps/online costs 22.8% 22.7% 21.0% 20.0% 19.0% 18.0% 17.0% 16.0% 15.0% Digital/apps/online costs (as a % of Digital revenue) 50.1% 48.5% 42.6% 38.7% 36.3% 34.1% 32.5% 31.1% 29.5% Payroll costs 16.0% 15.0% 14.5% 13.0% 12.0% 12.0% 12.0% 12.0% 13.0% Tax Rate 35.0% 35.0% 35.0% 35.0% 35.0% 35.0% 35.0% 35.0% 35.0% Average interest rate 8.0% 8.0% 8.0% 8.0% 8.0% 8.0% 25
- 32. Pro forma balance sheetAppendix Balance sheet Estimated Projected 2016E 2017P 2018P 2019P 2020P 2021P Assets Cash $16.9 $34.7 $69.4 $108.3 $154.0 $203.9 Restricted cash 2.1 2.1 2.1 2.1 2.1 2.1 Accounts receivable, net 81.9 86.2 94.8 104.3 114.7 125.1 Prepaid expenses & other assets 2.4 3.4 3.7 4.1 4.5 4.9 Income tax receivable 0.7 0.7 0.7 0.7 0.7 0.7 Deferred income taxes 0.7 0.7 0.7 0.7 0.7 0.7 Total current assets $104.7 $127.8 $171.4 $220.2 $276.7 $337.4 PPE, net 10.9 11.0 11.2 11.5 11.6 11.6 Goodwill 157.6 157.6 157.6 157.6 157.6 157.6 Intangible assets, net 39.8 39.8 39.8 39.8 39.8 39.8 Acquisition assets - - - - - - - - - - - - Deferred financing fees, net 1.9 1.9 1.9 1.9 1.9 1.9 Refundable security deposits 0.4 0.4 0.4 0.4 0.4 0.4 Total other assets $210.5 $210.7 $210.8 $211.1 $211.2 $211.2 Total assets $315.3 $338.5 $382.2 $431.3 $487.9 $548.7 Liabilities & Member's Equity Accounts payable and accrued expenses $48.9 $49.5 $54.3 $59.8 $66.0 $71.8 Income taxes payable 0.9 0.9 0.9 0.9 0.9 0.9 Client deposits 16.7 16.9 18.5 20.4 22.5 24.5 Deferred revenue - - - - - - - - - - - - Contingent purchase consideration 10.3 - - - - - - - - - - Total current liabilities $76.8 $67.2 $73.8 $81.1 $89.4 $97.1 Long-term debt 126.4 126.4 126.4 126.4 126.4 126.4 Deferred rent 6.4 6.6 7.4 8.4 9.2 10.0 Deferred income tax liability 13.9 13.9 13.9 13.9 13.9 13.9 Total liabilities $223.5 $214.1 $221.5 $229.8 $238.9 $247.5 Total member's equity $91.8 $124.3 $160.7 $201.5 $249.0 $301.2 Total liabilities & member's equity $315.3 $338.5 $382.2 $431.3 $487.9 $548.7 check - - - - - - - - - - - - NWC 8.9 23.8 26.1 28.7 31.2 34.3 26
- 33. Pro forma statement of cash flowsAppendix Statement of cash flows Projected 2017P 2018P 2019P 2020P 2021P Cash from operating activities: Net income $32.5 $36.4 $40.8 $47.5 $52.2 Depreciation & amortization 0.5 0.6 0.5 0.7 1.0 ∆ in deferred rent 0.2 0.8 0.9 0.9 0.8 ∆ in restricted cash - - - - - - - - - - ∆ in accounts receivable (4.3) (8.5) (9.6) (10.4) (10.4) ∆ in prepaid expenses & other assets (0.9) (0.3) (0.4) (0.4) (0.4) ∆ in income tax receivable - - - - - - - - - - ∆ in deferred income taxes - - - - - - - - - - ∆ in accounts payable and accrued expenses 0.6 4.9 5.5 6.1 5.8 ∆ in income taxes payable - - - - - - - - - - ∆ in client deposits 0.2 1.7 1.9 2.1 2.0 ∆ in deferred revenue - - - - - - - - - - ∆ in contingent purchase consideration (10.3) - - - - - - - - Cash flows provided (used) from operating activities $18.5 $35.5 $39.7 $46.6 $50.9 Cash from investing activities: Acquisition costs - - - - - - - - - - Capital expenditures (0.7) (0.7) (0.8) (0.9) (1.0) Cash flows provided (used) from investing activities ($0.7) ($0.7) ($0.8) ($0.9) ($1.0) Cash from financing activities: ∆ in long-term debt - - - - - - - - - - Cash flows provided (used) from financing activities - - - - - - - - - - Net change in cash $17.8 $34.8 $38.9 $45.7 $49.9 27
- 34. Pro forma income statement (w/ acquisition)Appendix Statement of income Historical Estimated Projected 2013A 2014A 2015A 2016E 2017P 2018P 2019P 2020P 2021P Airfare accomodation $95.1 $101.0 $106.7 $113.1 $129.5 $134.8 $140.1 $145.2 $150.0 Hotel booking 38.7 42.5 46.5 50.9 57.0 64.9 72.1 80.0 86.9 Transportation services 18.3 19.0 19.8 20.7 21.6 22.5 23.5 24.5 25.6 Entertainment planning 10.5 13.2 16.7 21.5 26.9 35.5 47.9 63.0 77.7 Total revenue $162.7 $175.6 $189.7 $206.2 $235.0 $257.8 $283.7 $312.7 $340.3 Service costs (non-payroll) 63.8 68.5 75.9 85.6 94.4 106.2 119.7 131.9 143.5 Digital/apps/online costs 37.1 39.9 39.8 41.2 42.7 44.5 46.2 48.0 48.9 Payroll costs 26.0 26.3 27.5 26.8 27.0 29.7 32.6 36.0 42.4 Potential acquisition expenses - - - - - - - - 7.1 7.5 8.2 8.9 9.8 Depreciation & amortization expense 0.3 0.4 0.6 0.5 0.6 0.6 0.6 0.8 1.0 EBIT $35.5 $40.6 $45.9 $52.1 $63.2 $69.3 $76.4 $87.0 $94.5 Interest expense 10.1 10.4 10.8 10.8 10.8 10.8 Tax provision 12.4 14.2 16.1 14.7 18.5 20.5 23.0 26.7 29.3 Net income $23.0 $26.4 $29.8 $27.3 $34.3 $38.0 $42.7 $49.6 $54.5 Depreciation & amortization 0.3 0.4 0.6 0.5 0.6 0.6 0.6 0.8 1.0 Capital expenditures 0.2 0.5 5.5 0.7 0.7 0.8 0.9 0.9 1.0 EBITDA $35.8 $40.9 $46.5 $52.6 $63.8 $69.9 $76.9 $87.8 $95.6 Margin analysis EBITDA 22.0% 23.3% 24.5% 25.5% 27.1% 27.1% 27.1% 28.1% 28.1% D&A (as a % of Total revenue) 0.2% 0.2% 0.3% 0.2% 0.2% 0.2% 0.2% 0.3% 0.3% CapEx (as a % of Total revenue) 0.1% 0.3% 2.9% 0.3% 0.3% 0.3% 0.3% 0.3% 0.3% NWC (as a % of Total revenue) 4.0% 3.3% 4.3% 10.6% 10.6% 10.5% 10.4% 10.5% EBIT 21.8% 23.1% 24.2% 25.3% 26.9% 26.9% 26.9% 27.8% 27.8% 28
- 35. Discounted cash flow assumptions & calculationsAppendix WACC calculations Capital structure Debt 126.4 Market value of equity 442.6 Beta 0.99 Equity Risk Premium 7.5% Size Premium 2.0% Risk Free Rate 1.8% Cost of Equity 11.3% Pretax Cost of Debt* 8.0% Tax Rate 35.0% Cost of Debt 5.2% WACC 9.9% Adjusted Company name beta Equity Debt Tax rate Unleavered beta eDreams Odigeo SL 1.146 341.3 474.5 28.0% 0.57 Corporate Travel Management 1.000 1,351.5 28.3 30.0% 0.99 MakeMyTrip Ltd. 0.849 1,203.3 180.9 35.0% 0.77 Travelport Worldwide Ltd. 1.404 1,776.3 2,410.8 35.0% 0.75 WebJet Ltd. 0.868 826.1 42.2 30.0% 0.84 Sabre Corp. 0.936 7,161.6 3,256.0 35.0% 0.72 Travelzoo Inc. 1.212 166.7 - - 35.0% 1.21 Avg: 0.84 Kona Adventures' Capital Structure Unlevered Beta 0.84 Equity 442.6 Debt 126.4 Tax Rate 35.0% Levered Beta 0.99 29
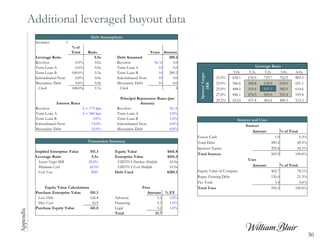
- 36. Additional leveraged buyout dataAppendix Debt Assumptions Scenario: 3 % of Total Ratio Years Amount Leverage Ratio 5.5x Debt Assumed 289.2 Revolver 0.0% 0.0x Revolver N/A 0.0 Term Loan A 0.0% 0.0x Term Loan A 10 0.0 Term Loan B 100.0% 5.5x Term Loan B 10 289.2 Subordinated Note 0.0% 0.0x Subordinated Note 10 0.0 Mezzanine Debt 0.0% 0.0x Mezzanine Debt 10 0.0 Check 100.0% 5.5x Check 0 Interest Rates Principal Repayment Rates (per Annum) Revolver L+ 175 bps Revolver N/A Term Loan A L+ 340 bps Term Loan A 5.0% Term Loan B 9.0% Term Loan B 1.0% Subordinated Note 13.0% Subordinated Note 0.0% Mezzanine Debt 15.0% Mezzanine Debt 0.0% Transaction Summary Implied Enterprise Value 551.3 Equity Value $441.8 Leverage Ratio 5.5x Enterprise Value $551.3 Sonsor Target IRR 25.0% EBITDA Purchase Multiple 10.5x Minimum Cash $15.0 EBITDA Exit Multiple 10.5x Exit Year 2021 Debt Used $289.2 Equity Value Calculations Fees Purchase Enterprise Value 551.3 Amount % EV Less: Debt 126.4 Advisory 5.2 1.0% Plus: Cash 16.9 Financing 5.2 1.0% Purchase Equity Value 441.8 Legal 5.2 1.0% Total 15.7 Leverage Ratio SponsorTarget IRR 5.0x 5.3x 5.5x 5.8x 6.0x 21.0% 634.1 676.9 719.7 762.5 805.3 23.0% 546.6 582.8 618.9 655.0 691.1 25.0% 488.0 519.6 551.3 582.9 614.6 27.0% 446.1 474.5 503.0 531.4 559.8 29.2% 412.0 437.8 463.6 489.5 515.3 Sources and Uses Sources Amount % of Total Excess Cash 1.9 0.3% Total Debt 289.2 49.5% Sponsor Equity 292.8 50.1% Total Sources 583.9 100.0% Uses Amount % of Total Equity Value of Company 462.7 78.1% Repay Existing Debt 126.4 21.3% Fee Total 3.4 0.6% Total Uses 592.5 100.0% 30