Location via proxy:   [ UP ]  
[Report a bug]   [Manage cookies]                
SlideShare a Scribd company logo
1H06 Earnings Result – Conference Call
              July, 2006
               António Martins da Costa
                        CEO

                Antonio José Sellare
      CFO and Vice President of Investor Relations

                   Vasco Barcellos
               Investor Relations Officer
Disclaimer

 This presentation may include forward-looking statements of future events or results according to
 regulations of the Brazilian and international securities and exchange commissions. These
 statements are based on certain assumptions and analysis by the company that reflect its
 experience, the economic environment and future market conditions and expected events, many
 of which are beyond the control of the company. Important factors that may lead to significant
 differences between the actual results and the statements of expectations about future events or
 results include the company’s business strategy, Brazilian and international economic conditions,
 technology, financial strategy, public service industry developments, hydrological conditions,
 financial market conditions, uncertainty of the results of future operations, plans, objectives,
 expectations and intentions, among others. Considering these factors, the actual results of the
 company may be significantly different from those shown or implicit in the statement of
 expectations about future events or results.


 The information and opinions contained in this presentation should not be understood as a
 recommendation to potential investors and no investment decision is to be based on the veracity,
 current events or completeness of this information or these opinions. No advisors to the company or
 parties related to them or their representatives shall have any responsibility for whatever losses that
 may result from the use or contents of this presentation.


 This material includes forward-looking statements subject to risks and uncertainties, which are based
 on current expectations and projections about future events and trends that may affect the
 company’s business. These statements include projections of economic growth and energy
 demand and supply, as well as information about the competitive position, the regulatory
 environment, potential opportunities for growth and other matters. Several factors may adversely
 affect the estimates and assumptions on which these statements are based.


                                                                                                           2
Operating Performance
Distribution
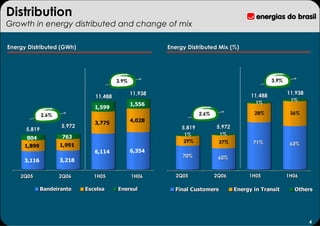
Growth in energy distributed and change of mix

Energy Distributed (GWh)                                 Energy Distributed Mix (%)


                                         3.9%                                                       3.9%

                                                11,938                                                     11,938
                                11,488                                                     11,488
                                                                                                            1%
                                                1,556                                        1%
                                1,599
              2.6%                                                    2.6%                  28%             36%
                                3,775           4,028
                     5,972                                    5,819          5,972
      5,819
                                                              1%              1%
      804             763
                                                              29%             37%           71%
     1,899           1,991                                                                                  63%
                                6,114           6,354
                                                              70%             62%
     3,116           3,218


    2Q05             2Q06       1H05            1H06        2Q05             2Q06         1H05             1H06

             Bandeirante     Escelsa     Enersul           Final Customers           Energy in Transit       Others


                                                                                                                    4
Distribution
Program to contain commercial and technical losses

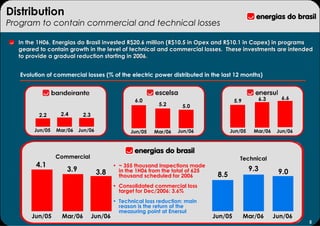
  In the 1H06, Energias do Brasil invested R$20.6 million (R$10.5 in Opex and R$10.1 in Capex) in programs
  geared to contain growth in the level of technical and commercial losses. These investments are intended
  to provide a gradual reduction starting in 2006.


   Evolution of commercial losses (% of the electric power distributed in the last 12 months)


                                                   6.0                                              6.3       6.6
                                                                                          5.9
                                                            5.2      5.0
          2.2     2.4       2.3

        Jun/05   Mar/06   Jun/06                 Jun/05   Mar/06   Jun/06               Jun/05     Mar/06    Jun/06


                 Commercial                                                                 Technical
        4.1                                • ~ 355 thousand inspections made
                    3.9            3.8       in the 1H06 from the total of 625                   9.3         9.0
                                             thousand scheduled for 2006          8.5
                                           • Consolidated commercial loss
                                             target for Dec/2006: 3.6%
                                           • Technical loss reduction: main
                                             reason is the return of the
                                             measuring point at Enersul
       Jun/05      Mar/06         Jun/06                                         Jun/05         Mar/06      Jun/06
                                                                                                                      5
Generation
Peixe Angical Starts the Operation of the 1st Turbine
                                                                100% of contracted     100% contracted
                                                                energy through PPA        in auctions
  –   Location: Rio Tocantins
  –   Installed Capacity: 452 MW               (Installed Capacity MW)                         50        1,043
                                                                                                                 1


  –   Assured annual power supply: 2,374 GWh                                     25
                                                                                              2006
  –   Reservoir area: 294 Km2                                                  2006

  –   Investment: R$1.6 Bi (96% expended)
                                                                   452                                   527


                                                                  2006


                                                      516


                                                   Current
                                                    Current     AHE Peixe
                                                                AHE Peixe   PCH São João
                                                                            PCH São João       4th
                                                                                               4th       Total
                                                                                                         Total
                                                   Capacity
                                                   Capacity      Angical
                                                                 Angical                   Mascarenhas
                                                                                           Mascarenhas
                                                                                             engine
                                                                                             engine


  –   99% of the construction concluded          New Project in Generation
  –   June 06 – start of the 1st turbine         - Santa Fé Small Power Plant (ES) – Start-up in 2009
  –   July 06 – start of the 2nd turbine         - Installed Capacity: 30 MW
  –   October 06 – start of the 3rd turbine
                                                 - Assured Energy: 16 MW (R$124.99 / MWh)
                                                                                                                     6
Commercialization
Reduction of self-dealing offset by the increase of customers

Energy Commercialized (GWh)                                    Enertrade – Number of Customers


                                             10.2%                                                 63
                                                                                     75.0%
                                                       3,503
                                    3,179
              17.2%                                     749
                                                                              36
                      1,846         1,398
    1,575
                       446                             2,754
     715                                     54.6%
                                     1,781
              62.8%   1,400
     860

   2Q05               2Q06         1H05               1H06                 2Q05                  2Q06

     Others                   Energias do Brasil's Discos


                                                                                                        7
Vanguard Project
Redundancy Plan (RP) concluded

Savings from RP (R$ million/year) *                             Productivity (Client/Employee)


                                                                                  1,143
                                                                             1,071
                                                       68.4                                         957
                                                                                                890
                                                                                                                       838
                                                                            776                                 762
                                                                                            654
                                       40.8                                                                  585
                                                                      456                 502
                            28.8                      60.0                                                462

           17.2                        35.6
                                                                            151%                91%
                            24.8                                                                                   81%
            14.8
            2.4              4.0       5.2             8.4

          Jun/06          Dec/06      Jun/07         Dec/07
                                                                       Bandeirante          Escelsa          Enersul
            Indirect Personnel Cost     Direct Personnel Cost
                                                                        1998          2001            2005          2Q06
* Current currency


   Redundancy Plan
   - Recognized cost in june/06: R$ 52 million
   - Acceptance of 651 employees
   - 19% of the current number of employees
                                                                                                                             8
Financial Performance
Net Revenues (R$ million)
Decrease reflects 2005 events and new market profile


   Net Revenues (R$MM)


                                                              Main Impacts:
                                        -0.1%
                                                              - Tariff Readjustment of -8,86% at Bandeirante in
                                  2,182          2,179         Oct/05;
                                  9%             11%          - Migration of free customers at Escelsa in 1Q06
                                  2%              5%
           -2.6%                                              - R$ 75 million recognized in 1Q05 at Enersul

     1,087                                                     (R$ 65 million prior of 2005);
                   1,059          89%            84%
      9%            12%
      2%             5%
     89%
                                                               Excluding Enersul impact, net operating revenue
                    83%
                                                              would have risen around 3.0% between the periods
    2Q05           2Q06       1H05              1H06
 Distribution        Generation           Commercialization


                                                                                                                  10
Costs and Expenses (R$ million)
Impacted by Efficiency Programs in Course


   Costs and Expenses Breakdown1 – 1H06                        Costs and Manageable Expenses Breakdown – 1H06


                                                                R$ Million                   1H06       1H05   Var.%

                                                                Personnel                        197     134   47.3%

                                                                Material                         20       19    5.6%
    Non-
     Non-
                                               Manageable costs
manageable                                                      Third-part Services              136     106   28.8%
    costs                                        R$430 million
R$1,304million
R$1,304million                                      (25%)       Provisions                       37       43   -13.9%
    (75%)
                                                                Others                           40       53   -23.8%

                                                                Total                            430     354   21.5%


                          R$1,734 million
                                                                 Third party Services (Corporate Programs)
                                                                 - Program to Contain Losses: R$ 8.7 million
                                                                 - Consultancy: R$ 5.5 million
                                                                 - RP: R$ 51.6 million


  Note:
  1   Excludes depreciation and amortization                                                                            11
EBITDA 1H06 x 1H05 (R$ million)
Variation mainly reflects 2005 events and RP

   EBITDA Variation and Analysis (R$ million)


                                                                   Excluding Enersul’s contribution and the RP
                                                                 provision, 1H06 EBITDA would have recorded a
                 518
                                                                      year-on-year increase of about 10%.
                               Enersul’s Tariff Revision
                 65                     Effect
                                                                              -10
                                                                                           -4
                         -52                                      +54


                                  -14                  +45
                                             -18

                 453                                                                               444


              June/05    RP    Efficiency   R&D*     Distribu-    Gene-     Commer-      Others   June/06
                               Program              tor Market    ration   cialization
        EBITDA Margin:                                                                               EBITDA Margin:
             23.7%                                                                                        20.4%


                                                                                                                      12
Financial Result (R$ million)
Exchange rate was favorable in 1H05

   Exchange rate variation was 12.9% in 1H05


                 Financial Result – R$ million


                                                               Accumulated
                                                         1H06    1H05    Var.%

                     Financial Revenues                  119     134     -10.9%

                     Financial Expenses                  (180)   (230)   -21.9%


                     Net Foreign Exchange Result         (26)    109     n.a.


                       SWAP - net result                 (73)    (81)     -9.1%

                       Foreign exchange gains (losses)   48      190     -74.8%

                                      TOTAL              (86)     13     n.a.


                                                                                  13
Net Profit (R$ million)
Non-recurring and exchange rate variation explain decrease


  Net profit before the participation of minority
  shareholders (R$ million )                        Net Profit (R$ million )


                            231


                                                                                229
                                                          198
        128                                138

                                                               -86.8%                       125
           -73.5%                 -40.3%                                          -45.4%

                    34
                                                                          26


      2Q05       2Q06      1H05        1H06             2Q05            2Q06   1H05        1H06


                                                                                                  14
Indebtedness
Low leverage level and low currency exposure
  Capital structure was strengthened, creating financial capacity for the company’s growth


  Indebtedness – 1H06 (R$ million)                                               Gross Debt – Index Breakdown
                                                                                 (Jun/06)


                                                       RP, CAPEX e                                         3%
                   (447)
                                                       Dividends/JSCP


                                 (752)                                                                                  31%
                                                      2.3x*
                                                      2.3x
                                                                     1.9x*

      3,122
                                                                                       61%

                                                                                                                       5%
                                                   1,923
                                                                   1,731
                                                                                            US$                 TJLP
                                                                                                                              **
                                                                                            Fixed rate          Floating rates


    Gross Debt   (-) Cash &   (-) Regulatory   Net Debt Jun.06 Net Debt Mar.06
      Jun.06     Marketable       Assets
                                                                                               ** Includes Selic, CDI, IGP-M and INPC
                                                                                                                       IGP-
                 Securities


                                        * Ratio: Net Debt / EBITDA 12 months
                                          Ratio:
                                                                                                                                   15
Indebtedness
Extending maturities at lower costs
 Debt Amortization Schedule – Jun/06 (R$ million)

    Concluded transactions                                        Benefits from the operations:
      –   Issuance of debentures:
                                                                - Reduction of short-term debt
                                                                               short-
             – Bandeirante (R$250 Million, April/2006)
             – Enersul (R$337.5 Million, June/2006)             - Extension of the average maturity
                                                                - Reduction of the debt average cost
            – Escelsa (R$264 Million, July/06)


                                                                                                 883

                                          692
                             552
               447
                                                                     372           351           28%
                                           22%            272
                             18%
                                                                     12%           11%
                                                           9%


           Cash &    Jul-Dec/06         2007             2008     2009          2010       After 2010
          Marketable
          Securities


                                                                                                        16
Investment Plan
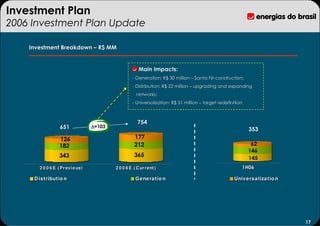
2006 Investment Plan Update

    Investment Breakdown – R$ MM


                                                      Main Impacts:
                                                  - Generation: R$ 30 million – Santa Fé construction;
                                                  - Distribution: R$ 22 million – upgrading and expanding
                                                     networks;
                                                  - Universalization: R$ 51 million – target redefinition
                                                    Universalization:


                                                     754
                  651            ∆=103
                                                                                                            353
                  126                              177
                  182                              212                                                       62
                                                                                                            146
                  343                              365                                                      145
       2 0 0 6 E ( Pr evio us)           2 0 0 6 E ( C ur r ent )                                       1H06

     D is t ribut io n                              G e ne ra t io n                                Univ e rs a liza t io n


                                                                                                                              17
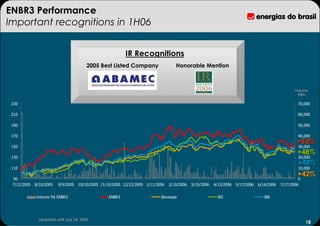
ENBR3 Performance
Important recognitions in 1H06


                                                           IR Recognitions
                                         2005 Best Listed Company                   Honorable Mention


                                                                                                                                                    Volume
                                                                                                                                                     R$th
                                                                                                                                                     R$th

 230                                                                                                                                                 70,000

 210                                                                                                                                                 60,000

 190                                                                                                                                                 50,000

 170                                                                                                                                                 40,000
                                                                                                                                                     +53%
 150                                                                                                                                                 30,000
                                                                                                                                                     +48%
 130                                                                                                                                                 20,000
                                                                                                                                                     +48%
 110                                                                                                                                                 10,000
                                                                                                                                                     +42%
 90                                                                                                                                                   0
 7/12/2005   8/10/2005   9/9/2005   10/10/2005 11/10/2005 12/12/2005 1/11/2006   2/10/2006   3/15/2006   4/13/2006   5/17/2006   6/16/2006   7/17/2006


             Volume R$ ENBR3                      ENBR3                     Ibovespa                       IEE                      IBX


               Updated until July 24, 2006
                                                                                                                                                          18
Conclusion: Important Achievements in 1H06


                                      Total Loss
                                     Reduction


                                                     Redudancy
                                                      Program
                                                     Concluded
                                    Peixe Angical
                                  Start-up and New
                                       Project in
                                     Generation
                                       Business

                                                       Market
                                                     Recognition

                                     Debentures
                                      Issuance
                                     Concluded


                                                                   19
1H06 Earnings Result – Conference Call
              July, 2006


       For further information:
     www.energiasdobrasil.com.br

More Related Content

2Q06 Results

  • 1. 1H06 Earnings Result – Conference Call July, 2006 António Martins da Costa CEO Antonio José Sellare CFO and Vice President of Investor Relations Vasco Barcellos Investor Relations Officer
  • 2. Disclaimer This presentation may include forward-looking statements of future events or results according to regulations of the Brazilian and international securities and exchange commissions. These statements are based on certain assumptions and analysis by the company that reflect its experience, the economic environment and future market conditions and expected events, many of which are beyond the control of the company. Important factors that may lead to significant differences between the actual results and the statements of expectations about future events or results include the company’s business strategy, Brazilian and international economic conditions, technology, financial strategy, public service industry developments, hydrological conditions, financial market conditions, uncertainty of the results of future operations, plans, objectives, expectations and intentions, among others. Considering these factors, the actual results of the company may be significantly different from those shown or implicit in the statement of expectations about future events or results. The information and opinions contained in this presentation should not be understood as a recommendation to potential investors and no investment decision is to be based on the veracity, current events or completeness of this information or these opinions. No advisors to the company or parties related to them or their representatives shall have any responsibility for whatever losses that may result from the use or contents of this presentation. This material includes forward-looking statements subject to risks and uncertainties, which are based on current expectations and projections about future events and trends that may affect the company’s business. These statements include projections of economic growth and energy demand and supply, as well as information about the competitive position, the regulatory environment, potential opportunities for growth and other matters. Several factors may adversely affect the estimates and assumptions on which these statements are based. 2
  • 4. Distribution Growth in energy distributed and change of mix Energy Distributed (GWh) Energy Distributed Mix (%) 3.9% 3.9% 11,938 11,938 11,488 11,488 1% 1,556 1% 1,599 2.6% 2.6% 28% 36% 3,775 4,028 5,972 5,819 5,972 5,819 1% 1% 804 763 29% 37% 71% 1,899 1,991 63% 6,114 6,354 70% 62% 3,116 3,218 2Q05 2Q06 1H05 1H06 2Q05 2Q06 1H05 1H06 Bandeirante Escelsa Enersul Final Customers Energy in Transit Others 4
  • 5. Distribution Program to contain commercial and technical losses In the 1H06, Energias do Brasil invested R$20.6 million (R$10.5 in Opex and R$10.1 in Capex) in programs geared to contain growth in the level of technical and commercial losses. These investments are intended to provide a gradual reduction starting in 2006. Evolution of commercial losses (% of the electric power distributed in the last 12 months) 6.0 6.3 6.6 5.9 5.2 5.0 2.2 2.4 2.3 Jun/05 Mar/06 Jun/06 Jun/05 Mar/06 Jun/06 Jun/05 Mar/06 Jun/06 Commercial Technical 4.1 • ~ 355 thousand inspections made 3.9 3.8 in the 1H06 from the total of 625 9.3 9.0 thousand scheduled for 2006 8.5 • Consolidated commercial loss target for Dec/2006: 3.6% • Technical loss reduction: main reason is the return of the measuring point at Enersul Jun/05 Mar/06 Jun/06 Jun/05 Mar/06 Jun/06 5
  • 6. Generation Peixe Angical Starts the Operation of the 1st Turbine 100% of contracted 100% contracted energy through PPA in auctions – Location: Rio Tocantins – Installed Capacity: 452 MW (Installed Capacity MW) 50 1,043 1 – Assured annual power supply: 2,374 GWh 25 2006 – Reservoir area: 294 Km2 2006 – Investment: R$1.6 Bi (96% expended) 452 527 2006 516 Current Current AHE Peixe AHE Peixe PCH São João PCH São João 4th 4th Total Total Capacity Capacity Angical Angical Mascarenhas Mascarenhas engine engine – 99% of the construction concluded New Project in Generation – June 06 – start of the 1st turbine - Santa Fé Small Power Plant (ES) – Start-up in 2009 – July 06 – start of the 2nd turbine - Installed Capacity: 30 MW – October 06 – start of the 3rd turbine - Assured Energy: 16 MW (R$124.99 / MWh) 6
  • 7. Commercialization Reduction of self-dealing offset by the increase of customers Energy Commercialized (GWh) Enertrade – Number of Customers 10.2% 63 75.0% 3,503 3,179 17.2% 749 36 1,846 1,398 1,575 446 2,754 715 54.6% 1,781 62.8% 1,400 860 2Q05 2Q06 1H05 1H06 2Q05 2Q06 Others Energias do Brasil's Discos 7
  • 8. Vanguard Project Redundancy Plan (RP) concluded Savings from RP (R$ million/year) * Productivity (Client/Employee) 1,143 1,071 68.4 957 890 838 776 762 654 40.8 585 456 502 28.8 60.0 462 17.2 35.6 151% 91% 24.8 81% 14.8 2.4 4.0 5.2 8.4 Jun/06 Dec/06 Jun/07 Dec/07 Bandeirante Escelsa Enersul Indirect Personnel Cost Direct Personnel Cost 1998 2001 2005 2Q06 * Current currency Redundancy Plan - Recognized cost in june/06: R$ 52 million - Acceptance of 651 employees - 19% of the current number of employees 8
  • 10. Net Revenues (R$ million) Decrease reflects 2005 events and new market profile Net Revenues (R$MM) Main Impacts: -0.1% - Tariff Readjustment of -8,86% at Bandeirante in 2,182 2,179 Oct/05; 9% 11% - Migration of free customers at Escelsa in 1Q06 2% 5% -2.6% - R$ 75 million recognized in 1Q05 at Enersul 1,087 (R$ 65 million prior of 2005); 1,059 89% 84% 9% 12% 2% 5% 89% Excluding Enersul impact, net operating revenue 83% would have risen around 3.0% between the periods 2Q05 2Q06 1H05 1H06 Distribution Generation Commercialization 10
  • 11. Costs and Expenses (R$ million) Impacted by Efficiency Programs in Course Costs and Expenses Breakdown1 – 1H06 Costs and Manageable Expenses Breakdown – 1H06 R$ Million 1H06 1H05 Var.% Personnel 197 134 47.3% Material 20 19 5.6% Non- Non- Manageable costs manageable Third-part Services 136 106 28.8% costs R$430 million R$1,304million R$1,304million (25%) Provisions 37 43 -13.9% (75%) Others 40 53 -23.8% Total 430 354 21.5% R$1,734 million Third party Services (Corporate Programs) - Program to Contain Losses: R$ 8.7 million - Consultancy: R$ 5.5 million - RP: R$ 51.6 million Note: 1 Excludes depreciation and amortization 11
  • 12. EBITDA 1H06 x 1H05 (R$ million) Variation mainly reflects 2005 events and RP EBITDA Variation and Analysis (R$ million) Excluding Enersul’s contribution and the RP provision, 1H06 EBITDA would have recorded a 518 year-on-year increase of about 10%. Enersul’s Tariff Revision 65 Effect -10 -4 -52 +54 -14 +45 -18 453 444 June/05 RP Efficiency R&D* Distribu- Gene- Commer- Others June/06 Program tor Market ration cialization EBITDA Margin: EBITDA Margin: 23.7% 20.4% 12
  • 13. Financial Result (R$ million) Exchange rate was favorable in 1H05 Exchange rate variation was 12.9% in 1H05 Financial Result – R$ million Accumulated 1H06 1H05 Var.% Financial Revenues 119 134 -10.9% Financial Expenses (180) (230) -21.9% Net Foreign Exchange Result (26) 109 n.a. SWAP - net result (73) (81) -9.1% Foreign exchange gains (losses) 48 190 -74.8% TOTAL (86) 13 n.a. 13
  • 14. Net Profit (R$ million) Non-recurring and exchange rate variation explain decrease Net profit before the participation of minority shareholders (R$ million ) Net Profit (R$ million ) 231 229 198 128 138 -86.8% 125 -73.5% -40.3% -45.4% 34 26 2Q05 2Q06 1H05 1H06 2Q05 2Q06 1H05 1H06 14
  • 15. Indebtedness Low leverage level and low currency exposure Capital structure was strengthened, creating financial capacity for the company’s growth Indebtedness – 1H06 (R$ million) Gross Debt – Index Breakdown (Jun/06) RP, CAPEX e 3% (447) Dividends/JSCP (752) 31% 2.3x* 2.3x 1.9x* 3,122 61% 5% 1,923 1,731 US$ TJLP ** Fixed rate Floating rates Gross Debt (-) Cash & (-) Regulatory Net Debt Jun.06 Net Debt Mar.06 Jun.06 Marketable Assets ** Includes Selic, CDI, IGP-M and INPC IGP- Securities * Ratio: Net Debt / EBITDA 12 months Ratio: 15
  • 16. Indebtedness Extending maturities at lower costs Debt Amortization Schedule – Jun/06 (R$ million) Concluded transactions Benefits from the operations: – Issuance of debentures: - Reduction of short-term debt short- – Bandeirante (R$250 Million, April/2006) – Enersul (R$337.5 Million, June/2006) - Extension of the average maturity - Reduction of the debt average cost – Escelsa (R$264 Million, July/06) 883 692 552 447 372 351 28% 22% 272 18% 12% 11% 9% Cash & Jul-Dec/06 2007 2008 2009 2010 After 2010 Marketable Securities 16
  • 17. Investment Plan 2006 Investment Plan Update Investment Breakdown – R$ MM Main Impacts: - Generation: R$ 30 million – Santa Fé construction; - Distribution: R$ 22 million – upgrading and expanding networks; - Universalization: R$ 51 million – target redefinition Universalization: 754 651 ∆=103 353 126 177 182 212 62 146 343 365 145 2 0 0 6 E ( Pr evio us) 2 0 0 6 E ( C ur r ent ) 1H06 D is t ribut io n G e ne ra t io n Univ e rs a liza t io n 17
  • 18. ENBR3 Performance Important recognitions in 1H06 IR Recognitions 2005 Best Listed Company Honorable Mention Volume R$th R$th 230 70,000 210 60,000 190 50,000 170 40,000 +53% 150 30,000 +48% 130 20,000 +48% 110 10,000 +42% 90 0 7/12/2005 8/10/2005 9/9/2005 10/10/2005 11/10/2005 12/12/2005 1/11/2006 2/10/2006 3/15/2006 4/13/2006 5/17/2006 6/16/2006 7/17/2006 Volume R$ ENBR3 ENBR3 Ibovespa IEE IBX Updated until July 24, 2006 18
  • 19. Conclusion: Important Achievements in 1H06 Total Loss Reduction Redudancy Program Concluded Peixe Angical Start-up and New Project in Generation Business Market Recognition Debentures Issuance Concluded 19
  • 20. 1H06 Earnings Result – Conference Call July, 2006 For further information: www.energiasdobrasil.com.br