3. descriptive study
- 1. Descriptive Epidemiology Maj Dr Naveen Phuyal MBBS, MD
- 2. Introduction • A descriptive study can be defined as one in which only one group of subjects is studied, without any comparison group, for describing the outcome in terms of its frequency and its distribution according to selected variables related to person, place and time. • It gives a tentative guess (hypothesis) about possible role of certain factors in the outcome of interest, but does not confirm the role because of absence of a comparison group.
- 3. Characteristics • No comparison group. • The main objective is to describe: Incidence or prevalence of disease Describe the natural history of disease Describe the distribution of the disease according to variables related to person, place and time. • Makes suggestion or hypothesis about certain “cause and effect” relationship which can be further tested by analytical studies.
- 4. • First phase of an epidemiological investigation. • These are concerned with observing the distribution of the disease or health-related characteristics in human population and identifying the characteristics with which the disease in question seems to be associated.
- 5. Descriptive studies answer 3 basic questions • When is the disease occurring? Time distribution • Where is it occurring? Place distribution • Who is getting the disease? Person distribution
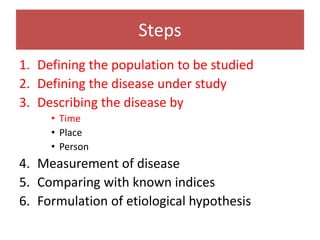
- 6. Steps 1. Defining the population to be studied 2. Defining the disease under study 3. Describing the disease by • Time • Place • Person 4. Measurement of disease 5. Comparing with known indices 6. Formulation of etiological hypothesis
- 7. 1. Defining the Population to be Studied Descriptive study is the study of populations not individuals
- 8. Defining the population to be studied • Define population base in terms of • Age • Gender • Occupation • Cultural characters etc • Defined population can also be specially selected group • Age and Sex groups • Occupational Groups • School children • Small communities
- 10. Defining the population to be studied • Defined population needs to be large enough • The community should be stable • Clear on who belong or does not • Community should not be different from others in the region • Health facility should be close enough Framingham Heart Study: All above criteria were followed
- 11. Why do we need “defined population?” • To provide denominators for calculation of rates. • Rates are required for measurement of frequency of the disease and study of distribution and determinants. Epidemiologist: Men in search for a denominator
- 12. 2. Defining the disease under study
- 13. Defining the disease under study • Needs of clinician and epidemiologist may diverge • Precise and valid definition is required by epidemiologist • Operational definition by which a disease or condition can be identified and measured in defined population with a degree of accuracy
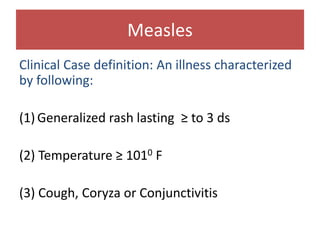
- 14. Measles Clinical Case definition: An illness characterized by following: (1) Generalized rash lasting ≥ to 3 ds (2) Temperature ≥ 1010 F (3) Cough, Coryza or Conjunctivitis
- 15. Epidemiologist definition • Suspected case: Any febrile illness accompanied by rash • Probable case: A case that meets clinical case definition, has noncontributory or no serologic or virologic testing and is not epidemiologically linked to a confirmed case. • Confirmed case: a case that is laboratory confirmed or that meets the clinical case definition and is epidemiologically linked to a confirmed case
- 16. 3. Describing the disease
- 17. Describing the disease • Time distribution – When is the disease occurring? • Place distribution – Where is it occurring? • Person distribution – Who is getting the disease?
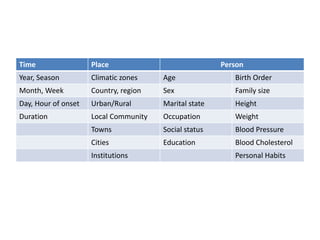
- 18. Time Place Person Year, Season Climatic zones Age Birth Order Month, Week Country, region Sex Family size Day, Hour of onset Urban/Rural Marital state Height Duration Local Community Occupation Weight Towns Social status Blood Pressure Cities Education Blood Cholesterol Institutions Personal Habits
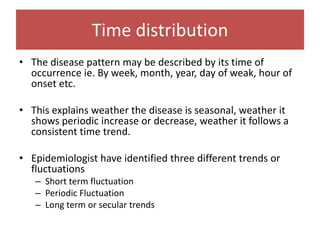
- 19. Time distribution • The disease pattern may be described by its time of occurrence ie. By week, month, year, day of weak, hour of onset etc. • This explains weather the disease is seasonal, weather it shows periodic increase or decrease, weather it follows a consistent time trend. • Epidemiologist have identified three different trends or fluctuations – Short term fluctuation – Periodic Fluctuation – Long term or secular trends
- 20. Short term fluctuations • Epidemic is the best known short term fluctuation.
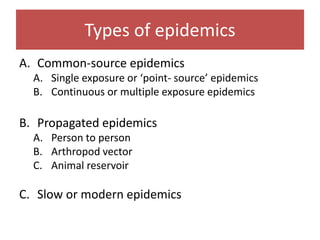
- 21. Types of epidemics A. Common-source epidemics A. Single exposure or ‘point- source’ epidemics B. Continuous or multiple exposure epidemics B. Propagated epidemics A. Person to person B. Arthropod vector C. Animal reservoir C. Slow or modern epidemics
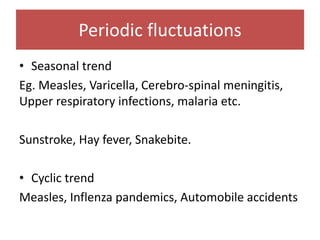
- 23. Periodic fluctuations • Seasonal trend Eg. Measles, Varicella, Cerebro-spinal meningitis, Upper respiratory infections, malaria etc. Sunstroke, Hay fever, Snakebite. • Cyclic trend Measles, Inflenza pandemics, Automobile accidents
- 25. Long term or secular trends • Secular means progressive increase or decrease over a long period of time • Consistent tendency to change in a particular direction or a definite movement in one direction • Eg CHD, Lung Cancer, DM: upward trend • Tuberculosis, typhoid fever, diptheria, polio: downward trend
- 27. Steps 1. Defining the population to be studied 2. Defining the disease under study 3. Describing the disease by • Time • Place • Person 4. Measurement of disease 5. Comparing with known indices 6. Formulation of etiological hypothesis
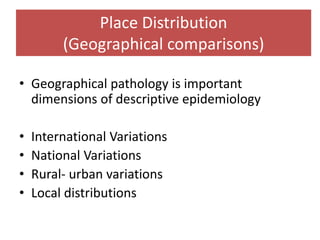
- 28. Place Distribution (Geographical comparisons) • Geographical pathology is important dimensions of descriptive epidemiology • International Variations • National Variations • Rural- urban variations • Local distributions
- 29. International Variation • Pattern of disease is not same everywhere. • Ca stomach • Oral Cancer and Ca Cervix • Breast Cancer
- 30. National variations • Endemic goitre • Lathyrism • Fluorosis • Leprosy • Malaria • Nutritional deficiency
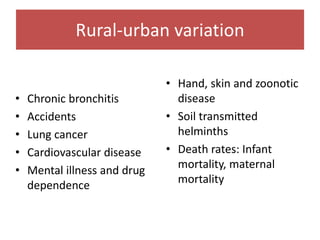
- 31. • Chronic bronchitis • Accidents • Lung cancer • Cardiovascular disease • Mental illness and drug dependence • Hand, skin and zoonotic disease • Soil transmitted helminths • Death rates: Infant mortality, maternal mortality Rural-urban variation
- 32. Local distributions • Best studied by spot maps or shaded maps • “Clustering of cases”: common source • John Snow
- 33. Migration studies • Comparison of disease and death rates of migrants with those of their kin who stayed at home • Comparison of migrants with local population of the host country
- 34. Person distribution • Age • Sex • Ethnicity • Marital Status • Occupation • Social Class • Behavior • Stress • Migration
- 35. 4. Measurement of disease
- 36. Measurement of disease • Disease load in terms of – Mortality – Morbidity • Incidence: longitudinal studies • Prevalence: Cross-sectional studies – Disability
- 37. 5. Comparing with known indices
- 38. Comparing with known indices • Making comparisons and asking questions • Making comparison between different population • Making comparison in subgroups of same population • We can arrive at clues to disease etiology • We can also identify or define groups who are at increased risk for certain disease
- 39. Formulation of a hypothesis • A hypothesis is a supposition arrived at from observation • It can be accepted or rejected using techniques of analytical epidemiology
- 40. An hypothesis should specify the following • The population • The specific cause being considered • The expected outcome • The dose-relationship • The time-response relationship
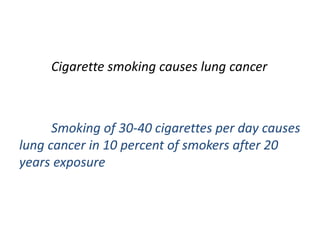
- 41. Cigarette smoking causes lung cancer Smoking of 30-40 cigarettes per day causes lung cancer in 10 percent of smokers after 20 years exposure
- 42. Uses of descriptive epidemiology • Provide date: magnitude of disease problems in community in terms of morbidity and mortality rates and ratios • Provide clues to disease etiology and help in formulation of etiological hypothesis • Provide background for planning, organizing and evaluating preventive and curative services • Contribute to research by describing variation of disease occurrence by time, place and person
- 43. Thank You
Editor's Notes
- So at first you define the population : like you define what is the age of the population? What is the age means.. What is the maximum age, minimum age, mean age, median age etc. Sex: how many or what % were boys and what % were girls. Etc. Occupation: what percentage of people belonged to this occupation. Cultural characteristics . How many hindu, christians etc. For example in your class : 130 students You all are 1st year medical students . But when I do a descriptive study I will explain this in terms of age like your min age is 17 or max age 20 , mean age 18 years, sex: male 70% ,female 30%, male : female ratio: 3:1 Cultural ma : 70% hindu, 10 % buddhist, 5% Christians, or 10% fullscholarship, 5% partial scholarship, 62% full payment
- Defined population needs to be large enough: So that age, sex and other variables are meaningful The community should be stable: without migration into and out Clear on who belong or does not Community should not be different from others in the region Health facility should be close enough Framingham heart study Population has to be defined- search for denominators
- Clinician may not require precise definition for immediate patient care, if diagnosis is wrong he can revise it. But epidemiologist whose main concern is to obtain an accurate estimate of disease in a population needs a definition that is precise and valid this will enable him as well as field workers to identify those who have the disease and those who do not.
- The population: The characteristics of the person to whom the hypothesis applies The specific cause being considered The expected outcome- the disease The dose-relationship- the time of the cause needed to lead to a started incidence of the effect The time-response relationship- the time period that will elapse between exposure to the cause and observation of the effect


