Location via proxy:   [ UP ]  
[Report a bug]   [Manage cookies]                
SlideShare a Scribd company logo
3Q10


                             Resultados
       Operating and Financial
                          Operacionais
               Results    e Financeiros
                 3Q10
                                  1T08

            November 11, 2010


                                          1
3Q10
Agenda


  ► Introduction

  ► Highlights

  ► Operating Results

  ► Financial Results

  ► Redentor


                        2
3Q10
Agenda


  ► Introduction

  ► Highlights

  ► Operating Results

  ► Financial Results

  ► Redentor


                        3
3Q10
Introduction

                          Presentation of Operating and Financial Information
  ► The financial information contained herein is presented in consolidated figures, pursuant to Brazilian
    Corporate Law, based on revised financial information. The consolidated financial information
    represents: i) 100% of CEMAR’s results, excluding 34.89% related to minority interests, ii) 25% of
    Geramar’s results and iii) 100% of Equatorial Soluções Results. In view of Equatorial’s partial spin-off, as
    of 2Q10, we no longer consolidate Light’s figures.

  ► The operating information presented herein consolidates 100% of CEMAR’s results and 25% of
    Geramar’s results. As of 2Q10, we are no longer consolidating Light’s operating results.

  ► In order to facilitate comparisons, the operating and financial information of 3Q09, 2Q10, 9M09 and
    9M10 is pro forma, so that the interest held by Equatorial in RME is not being considered.

  ► The following information was not reviewed by the independent auditors: i) non-financial information
    relating to CEMAR, Light and the PLPT (Programa Luz para Todos - Light for All Program); ii) pro forma
    information and its comparison with the results presented in the period; and iii) management
    expectations regarding the future performance of the Companies.


                                                                                                                   4
3Q10
Agenda


  ► Introduction

  ► Highlights

  ► Operating Results

  ► Financial Results

  ► Redentor


                        5
3Q10
Operating Highlights

  ► As of 2Q10, in view of Equatorial Energia’s spin-off, we have ceased to consolidate 13.03% of Light's
    figures in our operating and financial information.

  ► CEMAR’s billed energy volume amounted to 1,072 GWh in 3Q10, 10.2% greater than in 3Q09.

  ► CEMAR’s last-12-month energy losses totaled 22.2% of required energy by the end of 3Q10, 4.2 p.p.
    less than the 3Q09 ratio.

  ► CEMAR’s last-12-month 3Q10 DEC index improved 7.6%, dropping to 23.3 hours, while last-12-month
    FEC index improved 5.7%, to 14.9 times, in comparison with the 3Q09.

  ► In August 2010, CEMAR’s annual tariff adjustment was concluded, resulting in an average increase of
    0.08% for consumers.

  ► On August 25, 2010, the spin-off of Equatorial Energia (EQTL3) was concluded. On that date, the
    Company’s shareholders received 1 share of Redentor Energia (RDTR3) for each share of Equatorial
    they held.


                                                                                                            6
3Q10
Financial Highlights


 ► Net operating revenues (NOR) totaled R$393.9 million in 3Q10, 30.6% up on 3Q09, reflecting a 27.3%
   increase by CEMAR and the commercial startup of Geramar.

 ► 3Q10 EBITDA came to R$186.0 million, 27.6% higher than the adjusted amount reported in 3Q09.

 ► Net income totaled R$65.3 million in the quarter, 6.0% up on the adjusted amount reported in the same
   period last year.

 ► Equatorial’s consolidated investments amounted to R$113.3 million in 3Q10, 32.4% down year-on-year.
   CEMAR’s investments (excluding direct investments in the PLPT program) totaled R$48.0 million and
   investments in the PLPT program stood at R$65.0 million, up by 41.0%.


                                                                                                      7
3Q10
Agenda


  ► Introduction

  ► Highlights

  ► Operating Results

  ► Financial Results

  ► Redentor


                        8
3Q10
  CEMAR – Electricity Sales Volume

► CEMAR: 3Q10 energy sales moved up by 10.2%, reaching 1,072 GWh.


                                                   Electricity Consumption per Segment (GWh)

        CONSUMPTION CLASS (GWh)                            3Q09              2Q10           3Q10           Chg.        9M09          9M10       Chg.
         Residential                                      438.9             474.6          485.6          10.6%     1,185.6       1,409.6      18.9%
         Industrial                                       107.1             105.6          112.3           4.9%       278.3         315.2      13.2%
         Commercial                                       194.4             200.5          211.2           8.7%       516.1         602.1      16.7%
         Others                                           232.5             239.9          263.0          13.1%       600.8         725.7      20.8%
        TOTAL                                             972.9           1,020.5        1,072.2          10.2%     2,580.9       3,052.6      18.3%


                                                                     Energy Balance (GWh)

                ENERGY BALANCE (GWh)                          3Q09           2Q10        3Q10      Chg.       9M09      9M10        Chg.
                Required Energy                                 1,247          1,286       1,379   10.6%        3,482     3,905        12.2%
                Sales (*)                                         975          1,022       1,074   10.2%        2,585     3,056        18.2%
                Losses                                            272            264         305   11.9%          896       849        -5.3%
                (*) Includes sales to the market, own consumption and sales to CEPISA.


                                                                                                                                                       9
3Q10
Distribution – Energy Losses in CEMAR
                                              Total Losses over Required Energy
                                                       (last 12 months)


             28.7%           28.9%    28.6%     28.9%
                                                            28.5%   28.1%
                     28.1%

                                                                              26.4%


                                                                                                   24.2%            24.3%
                                                                                          25.2%
                                                                                                           22.2%    22.2%


             4Q07    1Q08    2Q08     3Q08      4Q08        1Q09    2Q09      3Q09     4Q09        1Q10    2Q10     3Q10
                                                                                 Regulatory Target
                                        Total Losses                         (from Aug-10 until Jul-11)

                                       Non-technical Losses over Low-Voltage Market
                                                      (last 12 months)

             30.4%           30.6%             30.0%
                                      29.9%
                     29.0%                                  28.7%
                                                                    27.3%


                                                                                         21.5%                       21.5%
                                                                            23.7%
                                                                                                  19.5%

                                                                                                            15.7%     15.9%


             4Q07    1Q08    2Q08     3Q08     4Q08         1Q09    2Q09      3Q09     4Q09       1Q10     2Q10     3Q10
                                                                                 Regulatory Target
                                     Non-technical Losses                    (from Aug-10 until Jul-11)

                                                                                                                              10
3Q10
Distribution – DEC and FEC (Last 12 months)


 ► CEMAR: The DEC index improved 7.6% compared with 3Q09 and the FEC index improved 5.7% in the same period.


                           DEC (hours)                                     FEC (times)

                    25.2      -7.6%
                                         23.3
                                                                              -5.7%
                                                                    15.8                 14.9


                    3Q09                 3Q10                       3Q09                 3Q10


                                                                                                               11
3Q10
Agenda


  ► Introduction

  ► Highlights

  ► Operating Results

  ► Financial Results

  ► Redentor


                        12
3Q10
    Consolidated Performance
                         Net Operating Revenues*                                                                            EBITDA*

                                    3 0 .6 %       3 9 3 .9        2.3%
                                                                                                                                      18 6 .0
                                                                   0.4%                                                     3 7.1%               3.3%
                      3 0 1.6
                                                                                                            13 5.7


                                                     97.3%
                                                                                                                                        96.7%
                       100.0%
                                                                                                            100.0%


                       3Q09                          3Q10                                                   3Q09                       3Q10

                         CEM A R      EQTL So luçõ es         Geramar                                                CEM A R           Geramar


                                                                                      Net Income*

                                                                                                    65.3
                                                                                        16 . 5 %                     2.9%
                                                                        56.0


                                                                                                    97.1%
                                                                          100.0%


                                                                          3Q09                      3Q10

                                                                                   CEM A R          Geramar


*Only operating companies and showing positive figures are being considered in these graphs.
                                                                                                                                                        13
3Q10
 Pro-forma EBITDA
                                                 Pro-forma EBITDA


                                                                                          27.6%
                                                                                                   186.0


                                                                   6.2
                                                    3.9                           145.8
                                   135.7


                                   3Q09         RTD Adjust.    Reg. Losses         3Q09            3Q10
                                  EBITDA                         Adjust.     Adjusted EBITDA      EBITDA


►   RTD Adjustment: In the 3Q09, R$3.9 million arising from the negative adjustment of the RTD (Delta PB) negatively affected
    the Company’s EBITDA.
►   Regulatory Losses Adjustment: In the 3Q09, R$ 6.2 million negatively affected the EBITDA relating to the adjustment in the
    regulatory losses level of CEMAR’s first tariff cycle.
►   Similarly to the 3Q09, in the 3Q10, R$61.3 million were booked due to the regulatory assets (mainly Low Income Grant and
    PLPT Deficit) already net of amortization granted in the CEMAR’s 2010 Tariff Readjustment, process concluded in August,
    2010.


                                                                                                                                 14
3Q10
    CEMAR’s EBITDA: Regulatory Assets’ Accounting

                                               CEMAR’s EBITDA Evolution
                                                                                                              -13
                                                                                                               10
                                                                                                               14

                                                           -7                                                  37
                                                                       -10
                                                           32
                                                                                                 -11
                                                                                     -10
                                                                                                              125
                                107           96          105
                                                                       130           89          107


                               1Q09         2Q09         3Q09         4Q09         1Q10         2Q10         3Q10


                               Reported EBITDA                  Low Income Accrual            PLPT Accrual

                               Other Assets Accrual             Asset Amortization
►    We highlight the accounting procedures related to the Low Income Subsidy and the PLPT Deficit Regulatory Assets. Despite being
     considered Financial Components in the Tariff Review/Adjustment process, the amounts are calculated and granted to the Company
     annually, always in August and valid through the following 12 months, in which they are amortized.


►    In the 3Q10, R$46.6 million arising from the Low Income Subsidy and R$17.6 million from the PLPT Deficit were booked in the Company’s
     Revenue (not considering the amortization). Regarding the latter, until the next Tariff Review (Aug-13), both the cost of capital and the opex
     relating to investment made in PLPT after 2009 Tariff Review should be compensated as Financial Components in the next Tariff
     Readjustments.


                                                                                                                                              15
3Q10
    Consolidated Performance

                                                    Adjusted Net Income


                                                                                         6.0%


                                                                   3.5                             65.3
                                                   2.1                            61.6

                                   56.0


                                  3Q09         RTD Adjust.     Reg. Losses       3Q09             3Q10
                                Net Income                       Adjust.        Adjusted        Net Income
                                                                               Net Income

►    RTD Adjustment: In the 3Q09, R$2.1 million arising from the negative adjustment of the RTD (Delta PB) negatively affected the Company’s
     results.


►    Regulatory Losses Adjustment: In the 3Q09, R$3.5 million relating to the adjustment in the regulatory losses level of CEMAR’s first tariff
     cycle negatively affected the results.


                                                                                                                                          16
3Q10
Debt: Schedule of Gross Debt Maturities

                                 Consolidated Gross Debt
                              (100% CEMAR + 25% Geramar)


                   109.6        65.3
       Geramar
                                179.1
                                           -       -
                                           29.0   171.5
                                                           -
                                                          283.8
                  1,150.5
                                                                   -
                                                                  107.4     44.3
       CEMAR


                                                                            379.6


                 Gross Debt   Short Term   2011   2012    2013    2014    After 2014


                                                                                       17
3Q10
Net Debt - Consolidated

                                      100% CEMAR + 25% Geramar


          Net Debt (R$MM)(*) and Net Debt/ EBITDA                 Net Debt Reconciliation (R$MM)
                      (Last 12 months)


    1.9
                 1.7
                            1.7         1.7                               82.0
                                                     1.4
 804.7         768.7                                                                444.7
                           754.3       775.7        733.4
                                                             1,260.0
                                                                                                   733.4


  3Q09         4Q09        1Q10        2Q10         3Q10    Gross Debt   Net Reg.    Cash      Net Debt
                                                                          Assets


                                                                                                           18
3Q10
Net Debt – Pro-Rata

                                     65.11% CEMAR + 25% Geramar

          Net Debt (R$MM)(*) and Net Debt/ EBITDA              Net Debt Reconciliation (R$MM)
                      (Last 12 months)


   1.9
                 1.7        1.7          1.7
                                                     1.4                   53.4

  519.6        500.7       494.7       512.7                                         321.9
                                                    483.3
                                                              858.6
                                                                                                 483.3


  3Q09          4Q09        1Q10        2Q10        3Q10    Gross Debt   Net Reg.    Cash       Net Debt
                                                                          Assets


                                                                                                           19
3Q10
   Capex - Equatorial
► CEMAR: In the 3Q10, total capex reached R$113.3 million, of which R$48.0 million are own capex and R$65.0 million regarding
  the Light for All Program (PLPT).


► Ever since the conclusion of the construction of its plants, Geramar has only maintenance capex.


        INVESTMENTS (R$MM)                                3Q09     2Q10   3Q10     Chg.    9M09       9M10          Chg.
        CEMAR
            Own (*)                                        62.2    43.4    48.0   -22.8%   175.6      129.7       -26.1%
            Light For All Program                          46.1    45.7    65.0    41.0%   110.6      143.8        30.1%
            Total                                         108.4    89.1   113.1     4.3%   286.2      273.5        -4.4%
        Geramar
            Generation                                    59.3      8.5     0.3   -99.6%    89.0      15.9        -82.2%
        TOTAL                                            167.7     97.6   113.3   -32.4%   375.2     289.4        -22.9%
        (*) Including indirect Light For All Program investments


                                                                                                                            20
3Q10
Agenda


  ► Introduction

  ► Highlights

  ► Operating Results

  ► Financial Results

  ► Redentor


                        21
3Q10
Redentor
 ► In August 25, Redentor Energia’s (RDTR3) shares started being traded in the BM&FBOVESPA’s Novo
   Mercado segment separately from the shares issued by Equatorial Energia (EQTL3), concluding the
   Company’s spin off process.

                               PCP                      Minorities
                                     54.1%    45.9%


                 Redentor                                      Equatorial
                Energia S.A.                                  Energia S.A.


                       100%                     65.1%                25%     100%

                    RME                                                       Equatorial
                                             CEMAR              Geramar
             Rio Minas Energia                                                Soluções


                       13.03%

                 Light S.A.


                                                                                                22
3Q10
   Contacts


                             Eduardo Haiama
                              CFO and IRO

                            Thomas Newlands
                             Investor Relations

                     Telephone 1: +0 55 (21) 3206-6635
                     Telephone 2: +0 55 (21) 3217-6607

                    Email: ir@equatorialenergia.com.br

              Website: http://www.equatorialenergia.com.br/ir


                                                                23
3Q10
     Disclaimer


 •    This presentation may contain forward-looking statements, which are subject to risks and uncertainties, as they were based on the
      expectations of Company’s management and on available information. These prospects include statements concerning the Company’s
      current intentions or expectations for our clients; this presentation will also be available at our website www.equatorialenergia.com.br/ir and
      in the IPE system of the Brazilian Securities and Exchange Commission (CVM).

 •    Forward-looking statements refer to future events which may or may not occur. Our future financial situation, operating results, market share
      and competitive positioning may differ substantially from those expressed or suggested by said forward-looking statements. Many factors
      and values that can establish these results are outside Company’s control or expectation. The reader/investor is advised not to completely
      rely on the information above.

 •    The words “believe", “can", “predict", “estimate", “continue", “anticipate", “intend", “forecast" and similar words, are intended to identify
      estimates, which refer only to the date on which they were expressed. Hence, the Company has no obligation to update said statements.

 •    This presentation does not constitute any offering, invitation or request of subscription offer or purchase of any marketable securities. And,
      this statement or any other information herein, does not constitute the basis for any contract or commitment of any kind.


                                                                                                                                                        24

More Related Content

3 q10 presentation

  • 1. 3Q10 Resultados Operating and Financial Operacionais Results e Financeiros 3Q10 1T08 November 11, 2010 1
  • 2. 3Q10 Agenda ► Introduction ► Highlights ► Operating Results ► Financial Results ► Redentor 2
  • 3. 3Q10 Agenda ► Introduction ► Highlights ► Operating Results ► Financial Results ► Redentor 3
  • 4. 3Q10 Introduction Presentation of Operating and Financial Information ► The financial information contained herein is presented in consolidated figures, pursuant to Brazilian Corporate Law, based on revised financial information. The consolidated financial information represents: i) 100% of CEMAR’s results, excluding 34.89% related to minority interests, ii) 25% of Geramar’s results and iii) 100% of Equatorial Soluções Results. In view of Equatorial’s partial spin-off, as of 2Q10, we no longer consolidate Light’s figures. ► The operating information presented herein consolidates 100% of CEMAR’s results and 25% of Geramar’s results. As of 2Q10, we are no longer consolidating Light’s operating results. ► In order to facilitate comparisons, the operating and financial information of 3Q09, 2Q10, 9M09 and 9M10 is pro forma, so that the interest held by Equatorial in RME is not being considered. ► The following information was not reviewed by the independent auditors: i) non-financial information relating to CEMAR, Light and the PLPT (Programa Luz para Todos - Light for All Program); ii) pro forma information and its comparison with the results presented in the period; and iii) management expectations regarding the future performance of the Companies. 4
  • 5. 3Q10 Agenda ► Introduction ► Highlights ► Operating Results ► Financial Results ► Redentor 5
  • 6. 3Q10 Operating Highlights ► As of 2Q10, in view of Equatorial Energia’s spin-off, we have ceased to consolidate 13.03% of Light's figures in our operating and financial information. ► CEMAR’s billed energy volume amounted to 1,072 GWh in 3Q10, 10.2% greater than in 3Q09. ► CEMAR’s last-12-month energy losses totaled 22.2% of required energy by the end of 3Q10, 4.2 p.p. less than the 3Q09 ratio. ► CEMAR’s last-12-month 3Q10 DEC index improved 7.6%, dropping to 23.3 hours, while last-12-month FEC index improved 5.7%, to 14.9 times, in comparison with the 3Q09. ► In August 2010, CEMAR’s annual tariff adjustment was concluded, resulting in an average increase of 0.08% for consumers. ► On August 25, 2010, the spin-off of Equatorial Energia (EQTL3) was concluded. On that date, the Company’s shareholders received 1 share of Redentor Energia (RDTR3) for each share of Equatorial they held. 6
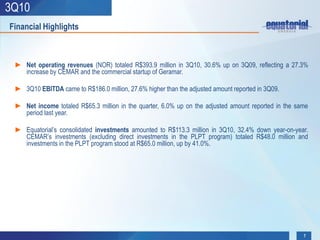
  • 7. 3Q10 Financial Highlights ► Net operating revenues (NOR) totaled R$393.9 million in 3Q10, 30.6% up on 3Q09, reflecting a 27.3% increase by CEMAR and the commercial startup of Geramar. ► 3Q10 EBITDA came to R$186.0 million, 27.6% higher than the adjusted amount reported in 3Q09. ► Net income totaled R$65.3 million in the quarter, 6.0% up on the adjusted amount reported in the same period last year. ► Equatorial’s consolidated investments amounted to R$113.3 million in 3Q10, 32.4% down year-on-year. CEMAR’s investments (excluding direct investments in the PLPT program) totaled R$48.0 million and investments in the PLPT program stood at R$65.0 million, up by 41.0%. 7
  • 8. 3Q10 Agenda ► Introduction ► Highlights ► Operating Results ► Financial Results ► Redentor 8
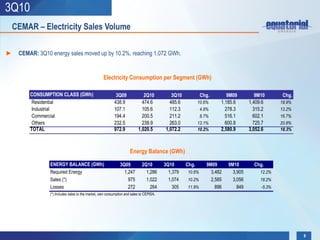
  • 9. 3Q10 CEMAR – Electricity Sales Volume ► CEMAR: 3Q10 energy sales moved up by 10.2%, reaching 1,072 GWh. Electricity Consumption per Segment (GWh) CONSUMPTION CLASS (GWh) 3Q09 2Q10 3Q10 Chg. 9M09 9M10 Chg. Residential 438.9 474.6 485.6 10.6% 1,185.6 1,409.6 18.9% Industrial 107.1 105.6 112.3 4.9% 278.3 315.2 13.2% Commercial 194.4 200.5 211.2 8.7% 516.1 602.1 16.7% Others 232.5 239.9 263.0 13.1% 600.8 725.7 20.8% TOTAL 972.9 1,020.5 1,072.2 10.2% 2,580.9 3,052.6 18.3% Energy Balance (GWh) ENERGY BALANCE (GWh) 3Q09 2Q10 3Q10 Chg. 9M09 9M10 Chg. Required Energy 1,247 1,286 1,379 10.6% 3,482 3,905 12.2% Sales (*) 975 1,022 1,074 10.2% 2,585 3,056 18.2% Losses 272 264 305 11.9% 896 849 -5.3% (*) Includes sales to the market, own consumption and sales to CEPISA. 9
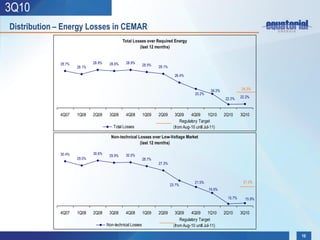
  • 10. 3Q10 Distribution – Energy Losses in CEMAR Total Losses over Required Energy (last 12 months) 28.7% 28.9% 28.6% 28.9% 28.5% 28.1% 28.1% 26.4% 24.2% 24.3% 25.2% 22.2% 22.2% 4Q07 1Q08 2Q08 3Q08 4Q08 1Q09 2Q09 3Q09 4Q09 1Q10 2Q10 3Q10 Regulatory Target Total Losses (from Aug-10 until Jul-11) Non-technical Losses over Low-Voltage Market (last 12 months) 30.4% 30.6% 30.0% 29.9% 29.0% 28.7% 27.3% 21.5% 21.5% 23.7% 19.5% 15.7% 15.9% 4Q07 1Q08 2Q08 3Q08 4Q08 1Q09 2Q09 3Q09 4Q09 1Q10 2Q10 3Q10 Regulatory Target Non-technical Losses (from Aug-10 until Jul-11) 10
  • 11. 3Q10 Distribution – DEC and FEC (Last 12 months) ► CEMAR: The DEC index improved 7.6% compared with 3Q09 and the FEC index improved 5.7% in the same period. DEC (hours) FEC (times) 25.2 -7.6% 23.3 -5.7% 15.8 14.9 3Q09 3Q10 3Q09 3Q10 11
  • 12. 3Q10 Agenda ► Introduction ► Highlights ► Operating Results ► Financial Results ► Redentor 12
  • 13. 3Q10 Consolidated Performance Net Operating Revenues* EBITDA* 3 0 .6 % 3 9 3 .9 2.3% 18 6 .0 0.4% 3 7.1% 3.3% 3 0 1.6 13 5.7 97.3% 96.7% 100.0% 100.0% 3Q09 3Q10 3Q09 3Q10 CEM A R EQTL So luçõ es Geramar CEM A R Geramar Net Income* 65.3 16 . 5 % 2.9% 56.0 97.1% 100.0% 3Q09 3Q10 CEM A R Geramar *Only operating companies and showing positive figures are being considered in these graphs. 13
  • 14. 3Q10 Pro-forma EBITDA Pro-forma EBITDA 27.6% 186.0 6.2 3.9 145.8 135.7 3Q09 RTD Adjust. Reg. Losses 3Q09 3Q10 EBITDA Adjust. Adjusted EBITDA EBITDA ► RTD Adjustment: In the 3Q09, R$3.9 million arising from the negative adjustment of the RTD (Delta PB) negatively affected the Company’s EBITDA. ► Regulatory Losses Adjustment: In the 3Q09, R$ 6.2 million negatively affected the EBITDA relating to the adjustment in the regulatory losses level of CEMAR’s first tariff cycle. ► Similarly to the 3Q09, in the 3Q10, R$61.3 million were booked due to the regulatory assets (mainly Low Income Grant and PLPT Deficit) already net of amortization granted in the CEMAR’s 2010 Tariff Readjustment, process concluded in August, 2010. 14
  • 15. 3Q10 CEMAR’s EBITDA: Regulatory Assets’ Accounting CEMAR’s EBITDA Evolution -13 10 14 -7 37 -10 32 -11 -10 125 107 96 105 130 89 107 1Q09 2Q09 3Q09 4Q09 1Q10 2Q10 3Q10 Reported EBITDA Low Income Accrual PLPT Accrual Other Assets Accrual Asset Amortization ► We highlight the accounting procedures related to the Low Income Subsidy and the PLPT Deficit Regulatory Assets. Despite being considered Financial Components in the Tariff Review/Adjustment process, the amounts are calculated and granted to the Company annually, always in August and valid through the following 12 months, in which they are amortized. ► In the 3Q10, R$46.6 million arising from the Low Income Subsidy and R$17.6 million from the PLPT Deficit were booked in the Company’s Revenue (not considering the amortization). Regarding the latter, until the next Tariff Review (Aug-13), both the cost of capital and the opex relating to investment made in PLPT after 2009 Tariff Review should be compensated as Financial Components in the next Tariff Readjustments. 15
  • 16. 3Q10 Consolidated Performance Adjusted Net Income 6.0% 3.5 65.3 2.1 61.6 56.0 3Q09 RTD Adjust. Reg. Losses 3Q09 3Q10 Net Income Adjust. Adjusted Net Income Net Income ► RTD Adjustment: In the 3Q09, R$2.1 million arising from the negative adjustment of the RTD (Delta PB) negatively affected the Company’s results. ► Regulatory Losses Adjustment: In the 3Q09, R$3.5 million relating to the adjustment in the regulatory losses level of CEMAR’s first tariff cycle negatively affected the results. 16
  • 17. 3Q10 Debt: Schedule of Gross Debt Maturities Consolidated Gross Debt (100% CEMAR + 25% Geramar) 109.6 65.3 Geramar 179.1 - - 29.0 171.5 - 283.8 1,150.5 - 107.4 44.3 CEMAR 379.6 Gross Debt Short Term 2011 2012 2013 2014 After 2014 17
  • 18. 3Q10 Net Debt - Consolidated 100% CEMAR + 25% Geramar Net Debt (R$MM)(*) and Net Debt/ EBITDA Net Debt Reconciliation (R$MM) (Last 12 months) 1.9 1.7 1.7 1.7 82.0 1.4 804.7 768.7 444.7 754.3 775.7 733.4 1,260.0 733.4 3Q09 4Q09 1Q10 2Q10 3Q10 Gross Debt Net Reg. Cash Net Debt Assets 18
  • 19. 3Q10 Net Debt – Pro-Rata 65.11% CEMAR + 25% Geramar Net Debt (R$MM)(*) and Net Debt/ EBITDA Net Debt Reconciliation (R$MM) (Last 12 months) 1.9 1.7 1.7 1.7 1.4 53.4 519.6 500.7 494.7 512.7 321.9 483.3 858.6 483.3 3Q09 4Q09 1Q10 2Q10 3Q10 Gross Debt Net Reg. Cash Net Debt Assets 19
  • 20. 3Q10 Capex - Equatorial ► CEMAR: In the 3Q10, total capex reached R$113.3 million, of which R$48.0 million are own capex and R$65.0 million regarding the Light for All Program (PLPT). ► Ever since the conclusion of the construction of its plants, Geramar has only maintenance capex. INVESTMENTS (R$MM) 3Q09 2Q10 3Q10 Chg. 9M09 9M10 Chg. CEMAR Own (*) 62.2 43.4 48.0 -22.8% 175.6 129.7 -26.1% Light For All Program 46.1 45.7 65.0 41.0% 110.6 143.8 30.1% Total 108.4 89.1 113.1 4.3% 286.2 273.5 -4.4% Geramar Generation 59.3 8.5 0.3 -99.6% 89.0 15.9 -82.2% TOTAL 167.7 97.6 113.3 -32.4% 375.2 289.4 -22.9% (*) Including indirect Light For All Program investments 20
  • 21. 3Q10 Agenda ► Introduction ► Highlights ► Operating Results ► Financial Results ► Redentor 21
  • 22. 3Q10 Redentor ► In August 25, Redentor Energia’s (RDTR3) shares started being traded in the BM&FBOVESPA’s Novo Mercado segment separately from the shares issued by Equatorial Energia (EQTL3), concluding the Company’s spin off process. PCP Minorities 54.1% 45.9% Redentor Equatorial Energia S.A. Energia S.A. 100% 65.1% 25% 100% RME Equatorial CEMAR Geramar Rio Minas Energia Soluções 13.03% Light S.A. 22
  • 23. 3Q10 Contacts Eduardo Haiama CFO and IRO Thomas Newlands Investor Relations Telephone 1: +0 55 (21) 3206-6635 Telephone 2: +0 55 (21) 3217-6607 Email: ir@equatorialenergia.com.br Website: http://www.equatorialenergia.com.br/ir 23
  • 24. 3Q10 Disclaimer • This presentation may contain forward-looking statements, which are subject to risks and uncertainties, as they were based on the expectations of Company’s management and on available information. These prospects include statements concerning the Company’s current intentions or expectations for our clients; this presentation will also be available at our website www.equatorialenergia.com.br/ir and in the IPE system of the Brazilian Securities and Exchange Commission (CVM). • Forward-looking statements refer to future events which may or may not occur. Our future financial situation, operating results, market share and competitive positioning may differ substantially from those expressed or suggested by said forward-looking statements. Many factors and values that can establish these results are outside Company’s control or expectation. The reader/investor is advised not to completely rely on the information above. • The words “believe", “can", “predict", “estimate", “continue", “anticipate", “intend", “forecast" and similar words, are intended to identify estimates, which refer only to the date on which they were expressed. Hence, the Company has no obligation to update said statements. • This presentation does not constitute any offering, invitation or request of subscription offer or purchase of any marketable securities. And, this statement or any other information herein, does not constitute the basis for any contract or commitment of any kind. 24