33051804 fiscal-policy-of-india-for-last-5-yr-and-analysis
- 2. Fiscal policy refers to the overall effect of the budget outcome on economic activity. The idea of using fiscal policy to combat recessions was introduced by John Maynard Keynes in the 1930s Two main instruments of fiscal policy • Revenue Budget • Expenditure Budget
- 3. Three possible stances of fiscal policy are: A neutral stance of fiscal policy implies a balanced budget where G = T (Government spending = Tax revenue). An expansionary stance of fiscal policy involves a net increase in government spending (G > T). A contractionary stance of fiscal policy (G < T)
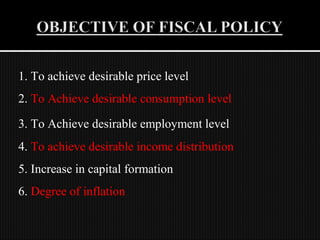
- 4. 1. To achieve desirable price level 2. To Achieve desirable consumption level 3. To Achieve desirable employment level 4. To achieve desirable income distribution 5. Increase in capital formation 6. Degree of inflation
- 5. METHODS OF FUNDING Governments spend money on a wide variety of things, from the military to services like education and healthcare, as well as transfer payments. This expenditure can be funded in a number of different ways: Taxation Seignorage, the benefit from printing money Consumption of fiscal reserves. Sale of assets (e.g., land).
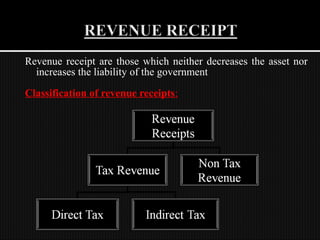
- 6. Revenue receipt are those which neither decreases the asset nor increases the liability of the government Classification of revenue receipts:
- 7. Revenue Receipts (Tax Revenue) 10 9.3 8.8 9 8.5 8 7.5 7.1 Revenue Receipts 7 6 5 4 3 2 1 0 2004-05 2005-06 2006-07 2007-08 2008-09 Year website: http//indiabudget.nic.in DEV 27/07/12
- 8. Direct Taxes 4.5 4.1 4.2 4 3.5 personal/corporation taxes 3.5 3 2.8 2.6 2.5 2.2 2.3 PersonaL Income Taxes 2 1.8 1.8 Corporation Tax 1.6 1.5 1 0.5 0 2004-05 2005-06 2006-07 2007-08 2008-09 years website: http//indiabudget.nic.in
- 9. Indirect Taxes 3.5 Custom/Excise/Service taxes 3 2.5 Customs 2 Excise 1.5 Service Taxes 1 0.5 0 2004-05 2005-06 2006-07 2007-08 2008-09 Customs 1.8 1.8 2.1 2.2 2.0 Excise 3.1 3.1 2.8 2.6 2.0 Service Taxes 0.5 0.6 0.9 1.1 1.2 Years website: http//indiabudget.nic.in
- 10. Customs duty on nonagricultural products, reduced from 20% (2003-04)to 10%(2007-08) Duty on steel melting scrap and aluminum scrap reduced to Nil (from 5 per cent earlier). Customs duty on crude and non-refined sulphur reduced to 2% from 5% to boost domestic fertilizer production. Customs duty on cigars, cheroots and cigarillos was increased from 30% to 60%.
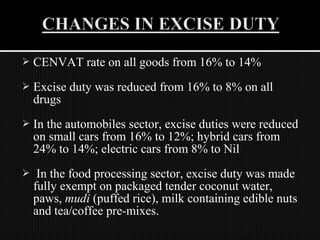
- 11. CENVAT rate on all goods from 16% to 14% Excise duty was reduced from 16% to 8% on all drugs In the automobiles sector, excise duties were reduced on small cars from 16% to 12%; hybrid cars from 24% to 14%; electric cars from 8% to Nil In the food processing sector, excise duty was made fully exempt on packaged tender coconut water, paws, mudi (puffed rice), milk containing edible nuts and tea/coffee pre-mixes.
- 12. Year Number of services Tax rate (% ) Revenue (Crores) 2004-05 75 10 14200 2005-06 84 10 23055 2006-07 99 12 37598 2007-08 106 12 51301 2008-09 NA 12 65000 website: http//indiabudget.nic.in
- 13. Comparision between Direct Tax & Indirect Tax 7 6 5 4 Direct Tax DT/IT 3 Indirect Tax 2 1 0 2004-05 2005-06 2006-07 2007-08 2008-09 Direct Tax 4.2 4.6 5.3 6.3 6.5 Indirect Tax 5.4 5.6 5.8 5.9 5.3 Years website: http//indiabudget.nic.in GAGANJEET PHOGAAT 27/07/12
- 14. Non Tax Revenue 3 2.6 2.5 2.2 2.1 Non Tax Revenue 2 2 1.8 1.5 Non Tax Revenue 1 0.5 0 2004-05 2005-06 2006-07 2007-08 2008-09 Year website: http//indiabudget.nic.in
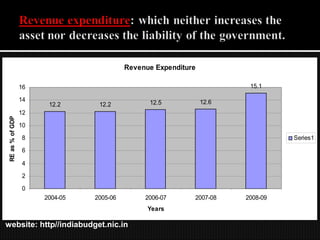
- 15. Revenue Expenditure 16 15.1 14 12.5 12.6 12.2 12.2 12 RE as % of GDP 10 8 Series1 6 4 2 0 2004-05 2005-06 2006-07 2007-08 2008-09 Years website: http//indiabudget.nic.in
- 16. Revenue expenditure 5.0 Components of RE 4.0 Interest Payment 3.0 Major Subsidies 2.0 Defense Expenditure 1.0 0.0 2004-05 2005-06 2006-07 2007-08 2008-09 Interest Payment 4.0 3.7 3.6 3.6 3.6 Major Subsidies 1.4 1.2 1.3 1.4 2.3 Defense 1.4 1.3 1.3 1.1 1.4 Expenditure Years website: http//indiabudget.nic.in
- 17. Revenue Defecit 5 4.5 Revenue Deficit (as % of GDP) 4.5 4 3.5 3 2.6 2.5 2.5 Series1 1.9 2 1.5 1.1 1 0.5 0 2004-05 2005-06 2006-07 2007-08 2008-09 Years website: http//indiabudget.nic.in GAGAN ANAND 27/07/12
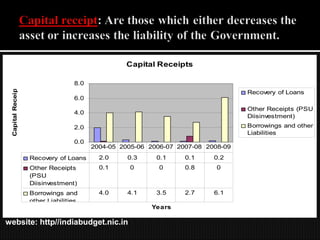
- 18. Capital Receipts 8.0 Capital Receipts Recovery of Loans 6.0 Other Receipts (PSU 4.0 Diisinvestment) 2.0 Borrowings and other Liabilities 0.0 2004-05 2005-06 2006-07 2007-08 2008-09 Recovery of Loans 2.0 0.3 0.1 0.1 0.2 Other Receipts 0.1 0 0 0.8 0 (PSU Diisinvestment) Borrowings and 4.0 4.1 3.5 2.7 6.1 other Liabilities Years website: http//indiabudget.nic.in
- 19. Capital Expenditure capital Expenditure (as % of GDP) 4 3.6 3.5 3 2.5 2.5 1.9 1.8 2 1.7 Series1 1.5 1 0.5 0 2004-05 2005-06 2006-07 2007-08 2008-09 Years website: http//indiabudget.nic.in
- 20. Comparision between RE & CE 16 14 12 10 Revenue Expenditure RE/CE 8 Capital Expenditure 6 4 2 0 2004-05 2005-06 2006-07 2007-08 2008-09 Revenue Expenditure 12.2 12.2 12.5 12.6 15.1 Capital Expenditure 3.6 1.9 1.7 2.5 1.8 Years website: http//indiabudget.nic.in
- 21. Plan Expenditure 6 Planned Expenditure (as % of 5.3 5 4.2 4.3 4.1 3.9 4 GDP) 3 Series1 2 1 0 2004-05 2005-06 2006-07 2007-08 2008-09 Years website: http//indiabudget.nic.in DEEPIKA 27/07/12
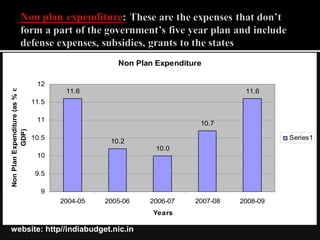
- 22. Non Plan Expenditure 12 Non Plan Expenditure (as % of 11.6 11.6 11.5 11 10.7 GDP) 10.5 Series1 10.2 10.0 10 9.5 9 2004-05 2005-06 2006-07 2007-08 2008-09 Years website: http//indiabudget.nic.in
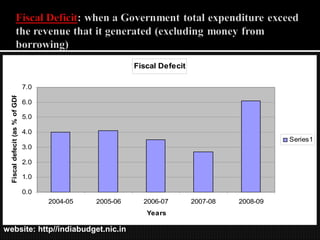
- 23. Fiscal Defecit 7.0 Fiscal defecit (as % of GDP) 6.0 5.0 4.0 Series1 3.0 2.0 1.0 0.0 2004-05 2005-06 2006-07 2007-08 2008-09 Years website: http//indiabudget.nic.in
- 25. PRESENTED BY: DEEPIKA GULATI(IB/08) DEVKANT RATH(IB/09) FATIK KHAN(IB/10) GAGAN ANAND(IB/11) GAGANJEET PHOGAAT(IB/12)


