Location via proxy:   [ UP ]  
[Report a bug]   [Manage cookies]                
SlideShare a Scribd company logo
Applying the Kano Model to User
       Experience Design


           Anthony Hand
       UPA Boston Mini-Conference
               May 2004
Outline

Background
What is the Kano Model?
The Kano Model & User Experience
Workshop
Next steps?
Q&A

                                   2
From Diversity…

IAs/UEAs/Usability Engineers: Richly
varied group of professionals
  Common thread: Analyze user and business
  needs to architect/improve an interactive product

Our Toolbox
  Big enough? No!
  Lots to learn from other disciplines
    Kano Model from Business
                                                      3
My Intro to the Kano Model

An eCare Project
  A brief recounting of that project…

MBAs use this!
  Relevance to User Experience?

But dearth of information on it...
  Let alone of relevance to UEAs
                                        4
Advantages of Kano Model

Synthesis of user research
  Better client communication
Experience = product
  User experience design is fundamentally
  (interactive) product design
  Product development prioritization
    Better trade-off decisions
  Success = implementation + differentiation
Persona targeting
                                               5
The Secret Origins

Noriaki Kano, Professor, Tokyo Rika University
  Research areas: quality   customer satisfaction
  “Voice of the Customer”

Konica
  New SLR: “Radically differentiate”?
  Sales & marketing groups stumped

Kano: find the latent needs
  Auto-focus, built-in flash, auto-film winding…

                                                    6
The Kano Model
Customer Satisfaction


                        Performance


                                      7
The Kano Model
Customer Satisfaction   Excitement
                        (Differentiation)

                                    Linear
                                    (Competitive)


                                            Performance


                                Basic
                                (Cost of Entry)


                                                          8
The Kano Model
Customer Satisfaction   Excitement
                        (Differentiation)
           Time
                                    Linear
                                    (Competitive)


                                            Performance


                                Basic
                                (Cost of Entry)


                                                          9
So Now What?

“We’ve seen what it is. But what can it do
for me?”

  A Framework

  Choices: Qualitative or Quantitative


                                             10
Kano Experience Framework


              2. Analyze &   3. Plot &   4. Strategize
1. Research                  Diagram      with Client
              Brainstorm


                                                   11
1. Research: Getting the Data
                           Customer Satisfaction   Excitement
                                                   (Differentiation)
•   Field research
•   Marketing/branding vision                                  Linear
•   Industrial design, packaging                               (Competitive)
•   Call center data
•   Site logs
                                                                       Performance

•   Competitive analysis
•   Interviews
                                                           Basic
•   Surveys                                                (Cost of Entry)
                                        • Focus groups
•   Search logs                         • Lawsuits & regulations
•   Usability testing                   • Buzz on Internet
•   Customer forums
                                                                                     12
2. Analyze & Brainstorm

Analyze all available raw
data
Brainstorm a list of
features and
functionality
  From major to minor, be
  thorough!
Decide for next step,
user-driven or
professional evaluation?        13
3. Plot & Diagram: User Driven

Part A: User Survey
      “Functional form” vs. “Dysfunctional Form”
        “How would you feel if the product had feature X?”
        “How would you feel if the product didn’t have feature X?”


      Kano Questionnaire Answers:
 1.     I like it.
 2.     I expect it.
 3.     I’m neutral.
 4.     I can tolerate it.
 5.     I dislike it.
                                                                     14
3. Plot & Diagram: User Driven

Part A (cont.)
  Best practices:
    Write questions using appropriate language
    Not too long
  Distribute: perfect for Web!
  Plot results in a matrix (next slide)
    Multiple statistical methods available
    Customer Satisfaction coefficient
Part B: Plot points on Kano Model
                                                 15
Kano Questionnaire Matrix


        E = Excitement   Q = Questionable result
        L = Linear       I = Indifferent
        B = Basic        R = Reversed
                                                   16
3. Plot & Diagram: Professional
             Evaluation

Part A: Professional Evaluation
  Consider a formalized approach for evaluating
  each feature
  Plot results in a matrix (next slide)


Part B:
  Plot points on Kano Model
                                                  17
Professional Evaluation Kano
           Matrix


                               18
Professional Evaluation Kano
           Matrix


                               19
4. Strategize with Client

Discuss findings with client

Agree on features to
include in product

Continue with project
lifecycle

                                  20
A Quick Workshop

“Granola Books & Cafe”
  Alternative books & local music, small-batch
  gourmet roasted coffee, poetry readings,
  performances
We are on the IA team of a larger project
team
  Our focus: The shopping cart
  Let’s start brainstorming…
                                                 21
Extending the Kano Model

Kano Model + Personas
  Especially for widely divergent user populations
  Add the dimension of Market Analysis
    Market Size
    Revenue Potential
  Leverage data for targeting marketing messages


Kano Model + Use Cases
                                                   22
Next Steps…

Give it a try!
  Experiment, put it through its paces
  And let us know how it worked for you


Q&A


                                          23
Thank you!

For links and to download this presentation, please
visit my web site:
         www.handaweb.com/anthony/portfolio/kano/


   Anthony Hand,
   President
   FloSpace, Inc.
   ahand@FloSpace.com
                                                      24

More Related Content

A hand kano-model-boston_upa_may-12-2004

  • 1. Applying the Kano Model to User Experience Design Anthony Hand UPA Boston Mini-Conference May 2004
  • 2. Outline Background What is the Kano Model? The Kano Model & User Experience Workshop Next steps? Q&A 2
  • 3. From Diversity… IAs/UEAs/Usability Engineers: Richly varied group of professionals Common thread: Analyze user and business needs to architect/improve an interactive product Our Toolbox Big enough? No! Lots to learn from other disciplines Kano Model from Business 3
  • 4. My Intro to the Kano Model An eCare Project A brief recounting of that project… MBAs use this! Relevance to User Experience? But dearth of information on it... Let alone of relevance to UEAs 4
  • 5. Advantages of Kano Model Synthesis of user research Better client communication Experience = product User experience design is fundamentally (interactive) product design Product development prioritization Better trade-off decisions Success = implementation + differentiation Persona targeting 5
  • 6. The Secret Origins Noriaki Kano, Professor, Tokyo Rika University Research areas: quality customer satisfaction “Voice of the Customer” Konica New SLR: “Radically differentiate”? Sales & marketing groups stumped Kano: find the latent needs Auto-focus, built-in flash, auto-film winding… 6
  • 7. The Kano Model Customer Satisfaction Performance 7
  • 8. The Kano Model Customer Satisfaction Excitement (Differentiation) Linear (Competitive) Performance Basic (Cost of Entry) 8
  • 9. The Kano Model Customer Satisfaction Excitement (Differentiation) Time Linear (Competitive) Performance Basic (Cost of Entry) 9
  • 10. So Now What? “We’ve seen what it is. But what can it do for me?” A Framework Choices: Qualitative or Quantitative 10
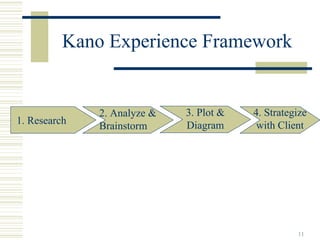
  • 11. Kano Experience Framework 2. Analyze & 3. Plot & 4. Strategize 1. Research Diagram with Client Brainstorm 11
  • 12. 1. Research: Getting the Data Customer Satisfaction Excitement (Differentiation) • Field research • Marketing/branding vision Linear • Industrial design, packaging (Competitive) • Call center data • Site logs Performance • Competitive analysis • Interviews Basic • Surveys (Cost of Entry) • Focus groups • Search logs • Lawsuits & regulations • Usability testing • Buzz on Internet • Customer forums 12
  • 13. 2. Analyze & Brainstorm Analyze all available raw data Brainstorm a list of features and functionality From major to minor, be thorough! Decide for next step, user-driven or professional evaluation? 13
  • 14. 3. Plot & Diagram: User Driven Part A: User Survey “Functional form” vs. “Dysfunctional Form” “How would you feel if the product had feature X?” “How would you feel if the product didn’t have feature X?” Kano Questionnaire Answers: 1. I like it. 2. I expect it. 3. I’m neutral. 4. I can tolerate it. 5. I dislike it. 14
  • 15. 3. Plot & Diagram: User Driven Part A (cont.) Best practices: Write questions using appropriate language Not too long Distribute: perfect for Web! Plot results in a matrix (next slide) Multiple statistical methods available Customer Satisfaction coefficient Part B: Plot points on Kano Model 15
  • 16. Kano Questionnaire Matrix E = Excitement Q = Questionable result L = Linear I = Indifferent B = Basic R = Reversed 16
  • 17. 3. Plot & Diagram: Professional Evaluation Part A: Professional Evaluation Consider a formalized approach for evaluating each feature Plot results in a matrix (next slide) Part B: Plot points on Kano Model 17
  • 20. 4. Strategize with Client Discuss findings with client Agree on features to include in product Continue with project lifecycle 20
  • 21. A Quick Workshop “Granola Books & Cafe” Alternative books & local music, small-batch gourmet roasted coffee, poetry readings, performances We are on the IA team of a larger project team Our focus: The shopping cart Let’s start brainstorming… 21
  • 22. Extending the Kano Model Kano Model + Personas Especially for widely divergent user populations Add the dimension of Market Analysis Market Size Revenue Potential Leverage data for targeting marketing messages Kano Model + Use Cases 22
  • 23. Next Steps… Give it a try! Experiment, put it through its paces And let us know how it worked for you Q&A 23
  • 24. Thank you! For links and to download this presentation, please visit my web site: www.handaweb.com/anthony/portfolio/kano/ Anthony Hand, President FloSpace, Inc. ahand@FloSpace.com 24