Location via proxy:   [ UP ]  
[Report a bug]   [Manage cookies]                
SlideShare a Scribd company logo
Logo client


    The Dashboard:
Performance at a glance
The right information to the right users at the right time


                ‘Something that FOCUSES the work of employees so everyone is
                                going in the SAME DIRECTION.’
                        Wayne W. Eckerson, director of research and services at The Data Warehousing Institute


        A       dashboard        is a tool to translate the organization's                            strategy   into
        objectives, metrics, initiatives and tasks                       customized                 to each group and
        individual in the organization.
        It provides at-a-glance views of Key Performance Indicators
        (KPIs) relevant to a particular objective or business process (e.g. Marketing,
        Sales, Production…).


Presentation1                                                     2
Why a dashboard?
       The risks you take & the benefits you miss by not using a dashboard

                     RISKS avoided                                          BENEFITS gained

      •  Monitor critical business processes and               •  Communicate your strategy efficiently by
         activities using metrics of business                     increasing visibility & giving a
         performance that trigger alerts when                    consistent view of the business
         potential problems arise  
                                                               •  Increase coordination, motivation &
      •  Analyze the root cause of problems                       empower users by delivering actionable
         by exploring relevant and timely                        information
         information from multiple perspectives and
         at various levels of detail                           •  Create organizational alignment
      •  Manage people and processes to improve                   within marketing & align marketing
         decisions, optimize performance and steer                objectives, operations and performance to
                                                                  the company’s financial objectives through
         the organization in the right                            the selection of critical metrics and sharing
         direction by a return to focus, simple                   of results
         process discipline and attention to only the
         most important goals                                  •  Create a learning organization that
                                                                  makes decisions on hard facts
      •  Integrate ROI & ROMI KPI’s to   reduce                   supplemented with experiential intuition
          costs & redundancy and save time


Presentation1                                           3
Which dashboard for me ?

                  Environment
                                                           FOCUS                                                    TYPES
     Level

     STRATEGIC                        •  Aligning company's strategic goals                    •  Balanced scorecard*
                                      •  Delivered every quarter                               •  Portfolio
                                                                                               •  Service
                                                                                               •  Sales performance
                                                                                               •  Cross channel
                                                                                               •  …

     TACTICAL                         • Measuring (against the present goal) a                 •  Profit sharing 
                                        progression of most important projects                 •  Monthly sales
                                      •  Delivered monthly                                     •  CSI
                                                                                               •  …

     OPERATIONAL                      • Monitoring & analyzing company's                       •  Calls / complaints
                                        activities in a given business area,                   •  Weekly sales funnel
                                        (comparing actual and target rates) to                 •  Campaigns
                                        help understand if performance is on                   •  Retention rate
                                        or off target, and by how much, in real                •  Satisfaction rate
                                        time                                                   •  ...
                                      •  Delivered weekly

     ANALYTICAL                       • Establish targets for tomorrow based                   •  Sales target
                                        on insights into historical data, using                •  Market share target
                                        what-if analysis and pivots to identify                •  Churn target
                                        patterns and opportunities                             •  ...
                                      •  Very complex, delivered yearly
* Balanced scorecards mesure performance in four areas: research, customer satisfaction, internal controls and finances
Presentation1                                                              4
The perfect way to go…

                         D                                                D


      •  TARGETS: Proper definition of target          •  TOO MANUAL: collection & delivery
         audiences                                        of information automatic to ensure
                                                          sustainable solution
      •  METRICS: Well-designed visual
         metrics                                       •  TOO FLAT: provide enough data/
                                                          analytical capabilities to let users
      •  SIMPLICITY: easy to create & to                  explore problems’ causes highlighted
         update & to use/understand                       in the graphical indicators
      •  MANAGEABILITY: evolving through
                                                       •  TOO ISOLATED: Some performance
         the time with the company
                                                          dashboards source data from a single
      •  LEADER: Sustained leadership                     system, appeal to a very small
         through a dashboard                              audience or have the wrong goals/
         ‘champion’ (CEO, …)                              KPI’s (misalignment, unrealistic or
                                                          poorly defined)
      •  DATA: Strong information
         infrastructure


Presentation1                                   5
Presentation1   6
Presentation1   7
Presentation1   8

More Related Content

A marketing dashboard shows you the way

  • 1. Logo client The Dashboard: Performance at a glance
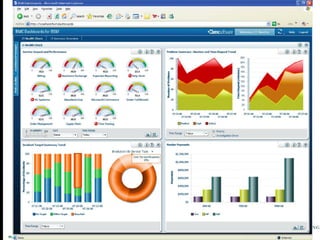
  • 2. The right information to the right users at the right time ‘Something that FOCUSES the work of employees so everyone is going in the SAME DIRECTION.’ Wayne W. Eckerson, director of research and services at The Data Warehousing Institute A dashboard is a tool to translate the organization's strategy into objectives, metrics, initiatives and tasks customized to each group and individual in the organization. It provides at-a-glance views of Key Performance Indicators (KPIs) relevant to a particular objective or business process (e.g. Marketing, Sales, Production…). Presentation1 2
  • 3. Why a dashboard? The risks you take & the benefits you miss by not using a dashboard RISKS avoided BENEFITS gained •  Monitor critical business processes and •  Communicate your strategy efficiently by activities using metrics of business increasing visibility & giving a performance that trigger alerts when consistent view of the business potential problems arise   •  Increase coordination, motivation & •  Analyze the root cause of problems empower users by delivering actionable by exploring relevant and timely information information from multiple perspectives and at various levels of detail •  Create organizational alignment •  Manage people and processes to improve within marketing & align marketing decisions, optimize performance and steer objectives, operations and performance to the company’s financial objectives through the organization in the right the selection of critical metrics and sharing direction by a return to focus, simple of results process discipline and attention to only the most important goals •  Create a learning organization that makes decisions on hard facts •  Integrate ROI & ROMI KPI’s to reduce supplemented with experiential intuition costs & redundancy and save time Presentation1 3
  • 4. Which dashboard for me ? Environment FOCUS TYPES Level STRATEGIC •  Aligning company's strategic goals •  Balanced scorecard* •  Delivered every quarter •  Portfolio •  Service •  Sales performance •  Cross channel •  … TACTICAL • Measuring (against the present goal) a •  Profit sharing  progression of most important projects •  Monthly sales •  Delivered monthly •  CSI •  … OPERATIONAL • Monitoring & analyzing company's •  Calls / complaints activities in a given business area, •  Weekly sales funnel (comparing actual and target rates) to •  Campaigns help understand if performance is on •  Retention rate or off target, and by how much, in real •  Satisfaction rate time •  ... •  Delivered weekly ANALYTICAL • Establish targets for tomorrow based •  Sales target on insights into historical data, using •  Market share target what-if analysis and pivots to identify •  Churn target patterns and opportunities •  ... •  Very complex, delivered yearly * Balanced scorecards mesure performance in four areas: research, customer satisfaction, internal controls and finances Presentation1 4
  • 5. The perfect way to go… D D •  TARGETS: Proper definition of target •  TOO MANUAL: collection & delivery audiences of information automatic to ensure sustainable solution •  METRICS: Well-designed visual metrics •  TOO FLAT: provide enough data/ analytical capabilities to let users •  SIMPLICITY: easy to create & to explore problems’ causes highlighted update & to use/understand in the graphical indicators •  MANAGEABILITY: evolving through •  TOO ISOLATED: Some performance the time with the company dashboards source data from a single •  LEADER: Sustained leadership system, appeal to a very small through a dashboard audience or have the wrong goals/ ‘champion’ (CEO, …) KPI’s (misalignment, unrealistic or poorly defined) •  DATA: Strong information infrastructure Presentation1 5