Location via proxy:   [ UP ]  
[Report a bug]   [Manage cookies]                
SlideShare a Scribd company logo
1
ASSIGNMENT ON FINANCIAL STRUCTURE
OF RENATA LTD.
2
Act201
Section: 46
Prepared for:
Hashem Mohaamad Khaiyyum
Prepared by:
Ali Arfi Shafat Chowdhury
ID: 1510376630
Submission Date: 02.12.2015
3
What is Financial Statement?
Financial statements are a collection of reports about an organization's financial
results, financial condition, and cash flows.
Firstly, a financial statement measures a company’s financial performance over a
specific accounting period. It presents the revenues and expenses and resulting
net income or net loss for a specific period of time.
Secondly, the statement of owner’s equity shows the owner’s capital at the start of
the period, the changes that affect capital, and the resulting capital at the end of
the period. In other words, the ownership claim on total assets is owner’s equity.
Thirdly, the accounting balance sheet is one of the major financial statements used
and business owners. It reports the assets, liabilities, and owner’s equity at a
specific date.
These are useful for the following reasons:
 To determine the ability of a business to generate cash, and the sources and uses
of that cash.
 To determine whether a business has the capability to pay back its debts.
 To track financial results on a trend line to spot any looming profitability issues.
 To derive financial ratios from the statements that can indicate the condition of
the business.
 To investigate the details of certain business transactions, as outlined in the
disclosures, which accompany the statements.
4
Introduction to Renata Limited
Renata Limited is one of the leading and fastest growing pharmaceutical and animal
health product companies in Bangladesh. The company started its operations in
1972 as Pfizer (Bangladesh) Limited. In 1993, Pfizer transferred the ownership of
its Bangladesh operations to local shareholders and the name of the company was
changed to Renata Limited.
Now we will observe the financial statement of the Renata Ltd. The main reason is
to know about the company, whether the company is making profit or a loss, and
what the company should do when they will be in the bad position or how they will
keep the pace when they will be in a good position.
5
Income Statement
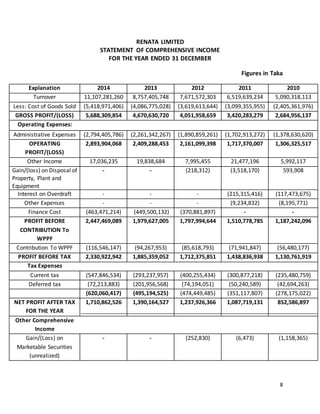
On the income statement, we can see that the sales of the company have increased in
every year. In 2010, the company’s sales were 5,090,318,113 Tk. where it has increased
to 11,107,281,260 Tk. in 2014. The sale of the inventory has also increased in every
year. As the gross profit has increased every year, the expense has also increased.
The company had some contribution to Workers’ Profit Participation Fund. The
contribution was higher than the other years. So the profit earned before tax has
been little bit lower for the company. In 2014, the profit before the contribution
to WPPF was 2,447,469,089 Tk. but after the contribution it has decreased to
2,330,922,942 Tk. The company has paid current and deferred taxes, and so the
profit of the company has decreased to 1,710,862,526 Tk. After all other gains
and losses, the total comprehensive income for the year has been 1,720,208,645
Tk. The company’s total income has been higher in 2014 than in the other years.
The main reason of this change has been the lower net profit after tax on the
other years.
Owner’s Equity
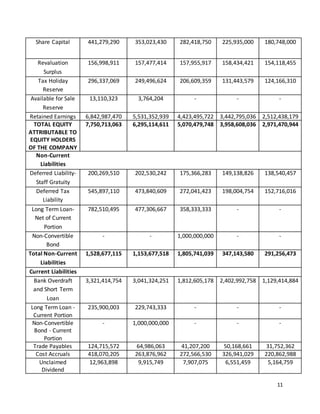
The share capital of the company in 2014 was higher than the other years. The
retained earnings of the company have been also higher in 2014 than the other
years. That’s why the equity of the year has also been higher in 2014 than the
other years. This is good for the company as the higher owner’s equity means the
higher profitability of the business. As the company’s owner’s equity is higher in
2014 than the other years, it can be said that the investors are investing their
money on this company.
6
Balance Sheet
The balance sheet of the company shows that the company’s total balance is higher
in 2014 than the other years. The non-current assets of 2014 were 9,197,198,644
Tk. which was better than the other years. The non-current assets were
8,577,464,610 Tk. in 2013; 6,442,857,255 Tk. in 2012; 5,227,476,247 Tk. in 2011
and 3,050,606,199 Tk. in 2010. This means the company has borrowed more
equipment in 2014 than the other years. And because of the more equipment, the
company’s look has been better for the year. The company’s current assets are also
better in 2014 than the other years. In 2014, the company has borrowed more
inventories and for that the company’s data looks heavier. The company has enough
accounts receivables in the year to be in a good position. As the company has more
receivables in the year, the cash balance is not heavier in the year. But that hasn’t
been a big deal for the company as the total current assets has been good for the
year of 2014. This also helps the company’s total assets to be higher in 2014 than
in the other years.
The total equity of the company has been higher in 2014 because of the higher
retained earnings. The main reason of the higher equity has been discussed before.
The non-current liabilities have been higher in 2014 than the other years. The main
reason of this is the higher deferred tax and the long term loan. The company has
taken too many loans for their improvement in the market situation in 2014. The
current liabilities are also higher in 2014. The company has to pay higher money to
the creditors as the company has taken too many loans from them. The company
has higher unclaimed dividends in 2014 and the cost of accruals has been too high
than the other years. As the company has borrowed more inventories, the cost of
accruals has also been higher. The company has more other liabilities which mean
the company has paid more vat, commission in 2014.So the total liabilities of the
company has been higher in 2014.
The higher assets, liabilities and owner’s equity in 2014 have helped to make the
company’s balance sheet healthy than the last 4 years which is good for the
company.
7
Conclusion
From the analysis, we can see that the Renata Ltd. company’s overall performance
is quite well. The total balance of 2014 has been higher than the previous years
which mean the company’s recent performance is good. If the company’s
performance carries on this way, the company will have enough profit on the coming
years. If the company makes enough profit, the investors will invest their money on
the company and the company will be in a well settled position in the current
market.
Reference
http://www.accountingtools.com/definition-financial-statemen
https://en.wikipedia.org/wiki/Renata_Limited
http://renata-ltd.com/wp-content/uploads/Annual_Report_2011.pdf
http://renata-ltd.com/wp-content/uploads/Annual_Report_2012.pdf
http://renata-ltd.com/wp-content/uploads/2015/06/Annual-Report-2014.pdf
8
RENATA LIMITED
STATEMENT OF COMPREHENSIVE INCOME
FOR THE YEAR ENDED 31 DECEMBER
Figures in Taka
Explanation 2014 2013 2012 2011 2010
Turnover 11,107,281,260 8,757,405,748 7,671,572,303 6,519,639,234 5,090,318,113
Less: Cost of Goods Sold (5,418,971,406) (4,086,775,028) (3,619,613,644) (3,099,355,955) (2,405,361,976)
GROSS PROFIT/(LOSS) 5,688,309,854 4,670,630,720 4,051,958,659 3,420,283,279 2,684,956,137
Operating Expenses:
Administrative Expenses (2,794,405,786) (2,261,342,267) (1,890,859,261) (1,702,913,272) (1,378,630,620)
OPERATING
PROFIT/(LOSS)
2,893,904,068 2,409,288,453 2,161,099,398 1,717,370,007 1,306,325,517
Other Income 17,036,235 19,838,684 7,995,455 21,477,196 5,992,117
Gain/(loss) on Disposal of
Property, Plant and
Equipment
- - (218,312) (3,518,170) 593,908
Interest on Overdraft - - - (215,315,416) (117,473,675)
Other Expenses - - - (9,234,832) (8,195,771)
Finance Cost (463,471,214) (449,500,132) (370,881,897) - -
PROFIT BEFORE
CONTRIBUTION To
WPPF
2,447,469,089 1,979,627,005 1,797,994,644 1,510,778,785 1,187,242,096
Contribution To WPPF (116,546,147) (94,267,953) (85,618,793) (71,941,847) (56,480,177)
PROFIT BEFORE TAX 2,330,922,942 1,885,359,052 1,712,375,851 1,438,836,938 1,130,761,919
Tax Expenses
Current tax (547,846,534) (293,237,957) (400,255,434) (300,877,218) (235,480,759)
Deferred tax (72,213,883) (201,956,568) (74,194,051) (50,240,589) (42,694,263)
(620,060,417) (495,194,525) (474,449,485) (351,117,807) (278,175,022)
NET PROFIT AFTER TAX
FOR THE YEAR
1,710,862,526 1,390,164,527 1,237,926,366 1,087,719,131 852,586,897
Other Comprehensive
Income
Gain/(Loss) on
Marketable Securities
(unrealized)
- - (252,830) (6,473) (1,158,365)
9
Exchange differences
arising on translation
(unrealized)
- - 9,601,794 2,921,383 -
Item that will not be
reclassified to profit or
loss
Unrealized gain on
quoted shares
9,346,119 3,764,204 - - -
TOTAL COMPREHENSIVE
INCOME FOR THE YEAR
1,720,208,645 1,393,928,731 1,247,275,330 1,090,634,041 851,428,532
Basic Earnings Per Share
(Per Value of Tk. 10)
38.77 31.50 43.83 48.14 37.74
RENATA LIMITED
STATEMENT OF CHANGES IN EQUITY
FOR THE YEAR ENDED 31 DECEMBER
Figures in Taka
Explanation 2014 2013 2012 2011 2010
Share Capital 441,279,290 353,023,430 282,418,750 225,935,000 180,748,000
Revaluation
Surplus
156,998,911 157,477,414 157,955,917 158,434,421 154,118,455
Tax Holiday
Reserve
296,337,069 249,496,624 206,609,359 131,443,579 124,166,310
Available for
Sale Reserve
13,110,323 3,764,204 - - -
Retained
Earnings
6,842,987,470 5,531,352,939 4,423,495,722 3,442,795,036 2,512,438,179
Total 7,750,713,063 6,295,114,611 5,070,479,748 3,958,608,036 2,971,470,944
10
RENATA LIMITED
STATEMENT OF FINANCIAL POSITION
AS AT 31 DECEMBER
Figures in Taka
Explanation 2014 2013 2012 2011 2010
Assets:
Non-current
assets
Property, Plant
and Equipment
8,106,692,561 6,348,183,517 4,268,926,361 3,782,849,367 2,564,572,288
Capital Work-in-
Progress
857,479,062 2,026,083,847 2,061,905,242 1,370,222,641 363,998,451
Investment in
Subsidiaries
143,069,376 143,069,376 63,070,376 63,070,376 63,070,376
Other Investment 89,957,645 60,127,870 30,592,153 11,333,863 58,965,084
Total Non-Current
Assets
9,197,198,644 8,577,464,610 6,442,857,255 5,227,476,247 3,050,606,199
Current Assets
Inventories 2,760,765,470 2,628,838,384 1,986,744,883 1,585,100,179 1,303,637,035
Trade and Other
Receivables
1,926,360,804 877,700,564 843,231,267 640,195,291 488,934,817
Advance Deposits
and Prepayments
207,268,076 250,577,165 148,951,592 97,564,211 110,721,962
Cash and Cash
Equivalents
251,975,735 240,262,887 331,292,974 141,265,972 178,384,225
Loan to Renata
Agro Industries
Limited
150,000,000 140,000,000 - - -
Total Current
Assets
5,296,370,085 4,137,379,000 3,310,220,716 2,464,125,653 2,081,678,039
Total Assets 14,493,568,729 12,714,843,610 9,753,077,971 7,691,601,900 5,132,284,238
EQUITY AND
LIABILITIES
Equity attributable
to equity holders
of the company
11
Share Capital 441,279,290 353,023,430 282,418,750 225,935,000 180,748,000
Revaluation
Surplus
156,998,911 157,477,414 157,955,917 158,434,421 154,118,455
Tax Holiday
Reserve
296,337,069 249,496,624 206,609,359 131,443,579 124,166,310
Available for Sale
Reserve
13,110,323 3,764,204 - - -
Retained Earnings 6,842,987,470 5,531,352,939 4,423,495,722 3,442,795,036 2,512,438,179
TOTAL EQUITY
ATTRIBUTABLE TO
EQUITY HOLDERS
OF THE COMPANY
7,750,713,063 6,295,114,611 5,070,479,748 3,958,608,036 2,971,470,944
Non-Current
Liabilities
Deferred Liability-
Staff Gratuity
200,269,510 202,530,242 175,366,283 149,138,826 138,540,457
Deferred Tax
Liability
545,897,110 473,840,609 272,041,423 198,004,754 152,716,016
Long Term Loan-
Net of Current
Portion
782,510,495 477,306,667 358,333,333 - -
Non-Convertible
Bond
- - 1,000,000,000 - -
Total Non-Current
Liabilities
1,528,677,115 1,153,677,518 1,805,741,039 347,143,580 291,256,473
Current Liabilities
Bank Overdraft
and Short Term
Loan
3,321,414,754 3,041,324,251 1,812,605,178 2,402,992,758 1,129,414,884
Long Term Loan -
Current Portion
235,900,003 229,743,333 - - -
Non-Convertible
Bond - Current
Portion
- 1,000,000,000 - - -
Trade Payables 124,715,572 64,986,063 41,207,200 50,168,661 31,752,362
Cost Accruals 418,070,205 263,876,962 272,566,530 326,941,029 220,862,988
Unclaimed
Dividend
12,963,898 9,915,749 7,907,075 6,551,459 5,164,759
12
Provision For
Taxation
624,740,709 370,595,092 402,110,091 255,275,989 185,076,625
Other Liabilities 476,373,410 285,610,031 340,461,110 343,920,388 297,285,203
Total Current
Liabilities
5,214,178,551 5,266,051,481 2,876,857,184 3,385,850,284 1,869,556,821
Total Liabilities 6,742,855,666 6,419,728,999 4,682,598,223 3,732,993,864 2,160,813,294
TOTAL EQUITY
AND LIABILITIES
14,493,568,729 12,714,843,610 9,753,077,971 7,691,601,900 5,132,284,238
More Related Content

Financial analysis

  • 1. 1 ASSIGNMENT ON FINANCIAL STRUCTURE OF RENATA LTD.
  • 2. 2 Act201 Section: 46 Prepared for: Hashem Mohaamad Khaiyyum Prepared by: Ali Arfi Shafat Chowdhury ID: 1510376630 Submission Date: 02.12.2015
  • 3. 3 What is Financial Statement? Financial statements are a collection of reports about an organization's financial results, financial condition, and cash flows. Firstly, a financial statement measures a company’s financial performance over a specific accounting period. It presents the revenues and expenses and resulting net income or net loss for a specific period of time. Secondly, the statement of owner’s equity shows the owner’s capital at the start of the period, the changes that affect capital, and the resulting capital at the end of the period. In other words, the ownership claim on total assets is owner’s equity. Thirdly, the accounting balance sheet is one of the major financial statements used and business owners. It reports the assets, liabilities, and owner’s equity at a specific date. These are useful for the following reasons:  To determine the ability of a business to generate cash, and the sources and uses of that cash.  To determine whether a business has the capability to pay back its debts.  To track financial results on a trend line to spot any looming profitability issues.  To derive financial ratios from the statements that can indicate the condition of the business.  To investigate the details of certain business transactions, as outlined in the disclosures, which accompany the statements.
  • 4. 4 Introduction to Renata Limited Renata Limited is one of the leading and fastest growing pharmaceutical and animal health product companies in Bangladesh. The company started its operations in 1972 as Pfizer (Bangladesh) Limited. In 1993, Pfizer transferred the ownership of its Bangladesh operations to local shareholders and the name of the company was changed to Renata Limited. Now we will observe the financial statement of the Renata Ltd. The main reason is to know about the company, whether the company is making profit or a loss, and what the company should do when they will be in the bad position or how they will keep the pace when they will be in a good position.
  • 5. 5 Income Statement On the income statement, we can see that the sales of the company have increased in every year. In 2010, the company’s sales were 5,090,318,113 Tk. where it has increased to 11,107,281,260 Tk. in 2014. The sale of the inventory has also increased in every year. As the gross profit has increased every year, the expense has also increased. The company had some contribution to Workers’ Profit Participation Fund. The contribution was higher than the other years. So the profit earned before tax has been little bit lower for the company. In 2014, the profit before the contribution to WPPF was 2,447,469,089 Tk. but after the contribution it has decreased to 2,330,922,942 Tk. The company has paid current and deferred taxes, and so the profit of the company has decreased to 1,710,862,526 Tk. After all other gains and losses, the total comprehensive income for the year has been 1,720,208,645 Tk. The company’s total income has been higher in 2014 than in the other years. The main reason of this change has been the lower net profit after tax on the other years. Owner’s Equity The share capital of the company in 2014 was higher than the other years. The retained earnings of the company have been also higher in 2014 than the other years. That’s why the equity of the year has also been higher in 2014 than the other years. This is good for the company as the higher owner’s equity means the higher profitability of the business. As the company’s owner’s equity is higher in 2014 than the other years, it can be said that the investors are investing their money on this company.
  • 6. 6 Balance Sheet The balance sheet of the company shows that the company’s total balance is higher in 2014 than the other years. The non-current assets of 2014 were 9,197,198,644 Tk. which was better than the other years. The non-current assets were 8,577,464,610 Tk. in 2013; 6,442,857,255 Tk. in 2012; 5,227,476,247 Tk. in 2011 and 3,050,606,199 Tk. in 2010. This means the company has borrowed more equipment in 2014 than the other years. And because of the more equipment, the company’s look has been better for the year. The company’s current assets are also better in 2014 than the other years. In 2014, the company has borrowed more inventories and for that the company’s data looks heavier. The company has enough accounts receivables in the year to be in a good position. As the company has more receivables in the year, the cash balance is not heavier in the year. But that hasn’t been a big deal for the company as the total current assets has been good for the year of 2014. This also helps the company’s total assets to be higher in 2014 than in the other years. The total equity of the company has been higher in 2014 because of the higher retained earnings. The main reason of the higher equity has been discussed before. The non-current liabilities have been higher in 2014 than the other years. The main reason of this is the higher deferred tax and the long term loan. The company has taken too many loans for their improvement in the market situation in 2014. The current liabilities are also higher in 2014. The company has to pay higher money to the creditors as the company has taken too many loans from them. The company has higher unclaimed dividends in 2014 and the cost of accruals has been too high than the other years. As the company has borrowed more inventories, the cost of accruals has also been higher. The company has more other liabilities which mean the company has paid more vat, commission in 2014.So the total liabilities of the company has been higher in 2014. The higher assets, liabilities and owner’s equity in 2014 have helped to make the company’s balance sheet healthy than the last 4 years which is good for the company.
  • 7. 7 Conclusion From the analysis, we can see that the Renata Ltd. company’s overall performance is quite well. The total balance of 2014 has been higher than the previous years which mean the company’s recent performance is good. If the company’s performance carries on this way, the company will have enough profit on the coming years. If the company makes enough profit, the investors will invest their money on the company and the company will be in a well settled position in the current market. Reference http://www.accountingtools.com/definition-financial-statemen https://en.wikipedia.org/wiki/Renata_Limited http://renata-ltd.com/wp-content/uploads/Annual_Report_2011.pdf http://renata-ltd.com/wp-content/uploads/Annual_Report_2012.pdf http://renata-ltd.com/wp-content/uploads/2015/06/Annual-Report-2014.pdf
  • 8. 8 RENATA LIMITED STATEMENT OF COMPREHENSIVE INCOME FOR THE YEAR ENDED 31 DECEMBER Figures in Taka Explanation 2014 2013 2012 2011 2010 Turnover 11,107,281,260 8,757,405,748 7,671,572,303 6,519,639,234 5,090,318,113 Less: Cost of Goods Sold (5,418,971,406) (4,086,775,028) (3,619,613,644) (3,099,355,955) (2,405,361,976) GROSS PROFIT/(LOSS) 5,688,309,854 4,670,630,720 4,051,958,659 3,420,283,279 2,684,956,137 Operating Expenses: Administrative Expenses (2,794,405,786) (2,261,342,267) (1,890,859,261) (1,702,913,272) (1,378,630,620) OPERATING PROFIT/(LOSS) 2,893,904,068 2,409,288,453 2,161,099,398 1,717,370,007 1,306,325,517 Other Income 17,036,235 19,838,684 7,995,455 21,477,196 5,992,117 Gain/(loss) on Disposal of Property, Plant and Equipment - - (218,312) (3,518,170) 593,908 Interest on Overdraft - - - (215,315,416) (117,473,675) Other Expenses - - - (9,234,832) (8,195,771) Finance Cost (463,471,214) (449,500,132) (370,881,897) - - PROFIT BEFORE CONTRIBUTION To WPPF 2,447,469,089 1,979,627,005 1,797,994,644 1,510,778,785 1,187,242,096 Contribution To WPPF (116,546,147) (94,267,953) (85,618,793) (71,941,847) (56,480,177) PROFIT BEFORE TAX 2,330,922,942 1,885,359,052 1,712,375,851 1,438,836,938 1,130,761,919 Tax Expenses Current tax (547,846,534) (293,237,957) (400,255,434) (300,877,218) (235,480,759) Deferred tax (72,213,883) (201,956,568) (74,194,051) (50,240,589) (42,694,263) (620,060,417) (495,194,525) (474,449,485) (351,117,807) (278,175,022) NET PROFIT AFTER TAX FOR THE YEAR 1,710,862,526 1,390,164,527 1,237,926,366 1,087,719,131 852,586,897 Other Comprehensive Income Gain/(Loss) on Marketable Securities (unrealized) - - (252,830) (6,473) (1,158,365)
  • 9. 9 Exchange differences arising on translation (unrealized) - - 9,601,794 2,921,383 - Item that will not be reclassified to profit or loss Unrealized gain on quoted shares 9,346,119 3,764,204 - - - TOTAL COMPREHENSIVE INCOME FOR THE YEAR 1,720,208,645 1,393,928,731 1,247,275,330 1,090,634,041 851,428,532 Basic Earnings Per Share (Per Value of Tk. 10) 38.77 31.50 43.83 48.14 37.74 RENATA LIMITED STATEMENT OF CHANGES IN EQUITY FOR THE YEAR ENDED 31 DECEMBER Figures in Taka Explanation 2014 2013 2012 2011 2010 Share Capital 441,279,290 353,023,430 282,418,750 225,935,000 180,748,000 Revaluation Surplus 156,998,911 157,477,414 157,955,917 158,434,421 154,118,455 Tax Holiday Reserve 296,337,069 249,496,624 206,609,359 131,443,579 124,166,310 Available for Sale Reserve 13,110,323 3,764,204 - - - Retained Earnings 6,842,987,470 5,531,352,939 4,423,495,722 3,442,795,036 2,512,438,179 Total 7,750,713,063 6,295,114,611 5,070,479,748 3,958,608,036 2,971,470,944
  • 10. 10 RENATA LIMITED STATEMENT OF FINANCIAL POSITION AS AT 31 DECEMBER Figures in Taka Explanation 2014 2013 2012 2011 2010 Assets: Non-current assets Property, Plant and Equipment 8,106,692,561 6,348,183,517 4,268,926,361 3,782,849,367 2,564,572,288 Capital Work-in- Progress 857,479,062 2,026,083,847 2,061,905,242 1,370,222,641 363,998,451 Investment in Subsidiaries 143,069,376 143,069,376 63,070,376 63,070,376 63,070,376 Other Investment 89,957,645 60,127,870 30,592,153 11,333,863 58,965,084 Total Non-Current Assets 9,197,198,644 8,577,464,610 6,442,857,255 5,227,476,247 3,050,606,199 Current Assets Inventories 2,760,765,470 2,628,838,384 1,986,744,883 1,585,100,179 1,303,637,035 Trade and Other Receivables 1,926,360,804 877,700,564 843,231,267 640,195,291 488,934,817 Advance Deposits and Prepayments 207,268,076 250,577,165 148,951,592 97,564,211 110,721,962 Cash and Cash Equivalents 251,975,735 240,262,887 331,292,974 141,265,972 178,384,225 Loan to Renata Agro Industries Limited 150,000,000 140,000,000 - - - Total Current Assets 5,296,370,085 4,137,379,000 3,310,220,716 2,464,125,653 2,081,678,039 Total Assets 14,493,568,729 12,714,843,610 9,753,077,971 7,691,601,900 5,132,284,238 EQUITY AND LIABILITIES Equity attributable to equity holders of the company
  • 11. 11 Share Capital 441,279,290 353,023,430 282,418,750 225,935,000 180,748,000 Revaluation Surplus 156,998,911 157,477,414 157,955,917 158,434,421 154,118,455 Tax Holiday Reserve 296,337,069 249,496,624 206,609,359 131,443,579 124,166,310 Available for Sale Reserve 13,110,323 3,764,204 - - - Retained Earnings 6,842,987,470 5,531,352,939 4,423,495,722 3,442,795,036 2,512,438,179 TOTAL EQUITY ATTRIBUTABLE TO EQUITY HOLDERS OF THE COMPANY 7,750,713,063 6,295,114,611 5,070,479,748 3,958,608,036 2,971,470,944 Non-Current Liabilities Deferred Liability- Staff Gratuity 200,269,510 202,530,242 175,366,283 149,138,826 138,540,457 Deferred Tax Liability 545,897,110 473,840,609 272,041,423 198,004,754 152,716,016 Long Term Loan- Net of Current Portion 782,510,495 477,306,667 358,333,333 - - Non-Convertible Bond - - 1,000,000,000 - - Total Non-Current Liabilities 1,528,677,115 1,153,677,518 1,805,741,039 347,143,580 291,256,473 Current Liabilities Bank Overdraft and Short Term Loan 3,321,414,754 3,041,324,251 1,812,605,178 2,402,992,758 1,129,414,884 Long Term Loan - Current Portion 235,900,003 229,743,333 - - - Non-Convertible Bond - Current Portion - 1,000,000,000 - - - Trade Payables 124,715,572 64,986,063 41,207,200 50,168,661 31,752,362 Cost Accruals 418,070,205 263,876,962 272,566,530 326,941,029 220,862,988 Unclaimed Dividend 12,963,898 9,915,749 7,907,075 6,551,459 5,164,759
  • 12. 12 Provision For Taxation 624,740,709 370,595,092 402,110,091 255,275,989 185,076,625 Other Liabilities 476,373,410 285,610,031 340,461,110 343,920,388 297,285,203 Total Current Liabilities 5,214,178,551 5,266,051,481 2,876,857,184 3,385,850,284 1,869,556,821 Total Liabilities 6,742,855,666 6,419,728,999 4,682,598,223 3,732,993,864 2,160,813,294 TOTAL EQUITY AND LIABILITIES 14,493,568,729 12,714,843,610 9,753,077,971 7,691,601,900 5,132,284,238