Adaptive features of animals in relation to food and environment and determination of ph of waste water and dissolve oxygen in water experimentaldesignand approach of ecological research
•
0 likes•993 views

I AM HAFIZ MUHAMMAD WASEEM from mailsi vehari BSc from science college Multan MSC university of education Lahore i love Pakistan and my teachers
Report
Share


Adaptive features of animals in relation to food and environment and determination of ph of waste water and dissolve oxygen in water experimentaldesignand approach of ecological research
- 2. HAFIZ MUHAMMAD WASEEM LAHORE PAKISTAN UNIVESITY OF EDUCATION LAHORE PAKISTAN
- 3. 2 | P a g e University of Education, LMC, Lahore. M.Sc Zoology (2nd Semester) Subject Applied Ecology (Practical Notebook) Submitted By Submitted to
- 4. 3 | P a g e Contents Determination of pH of Waste Water Sample ...................................................4 Determination Dissolved Oxygen within Water .................................................5 Adaptive Features of Animals in Relation to Food and Environment................7 Study the Plant Population Density.................................................................10 Experimental Design and Approaches to Ecological Research ......................12
- 5. 4 | P a g e Practical No.1 Determination of pH of Waste Water Sample Material Required: Waste water collected from lake Acetate buffer of pH 4 Ammonium buffer of pH 10 A pH meter. Distilled water Sample beakers Tissue papers Procedure: 1. Take the water of the dirty lake in a bottle. 2. Put the water in a sample beaker labelled as wastewater sample. 3. Put the pH meter on and the pH of the storage solution and record the pH of 7. 4. Now, put out the electrode off the storage solution and with the help of distilled water cleaned the lower portion of the electrode and cleaned with the help of tissue paper. 5. Now again took the electrode in the Acetate buffer and measuring the pH of 4. 6. Again, cleaned the lower portion of the electrode with the help of distilled water and dry it with the tissue paper. 7. Now put the electrode in in the ammonium buffer and you recorded the pH of10. 8. Now is the turn of the waste sample of the water and recorded the pH 5.50. 9. Again, rinsed the electrode with distilled water cleaned it with the paper and again put it in the storage solution and measured the pH 7.
- 6. 5 | P a g e Result: Recorded pH of waste water sample was 5.50
- 7. 6 | P a g e Practical No.2 Determination Dissolved Oxygen within Water Material Required: Micro pipette Bottle Water Manganous sulphate Aluminum foil and a rubber Sulfuric acid Sodium thiosulfate Starch indicator Dropper Procedure: 1. Collect water in a bottle from this below the surface of water using the micropipette an ad 2 ML manganous sulphate to clear 300 ml BOD bottle filled with sample water. 2. Carefully collect sample water by not adding further oxygen in it by inserting that it below the water. 3. Carefully dispense manganous sulphate this will avoid air bubble and fix the sample for the proceeding. 4. The precipitated aggregation of material with a cloudy appearance will appear. 5. Fixed the sample to prevent change in dissolved oxygen content. 6. To avoid the addition of the oxygen the sample is stored using the Aluminum foil to cover the open mouth of the bottle and fix it by using the rubber.
- 8. 7 | P a g e 7. Pipette 2 ml of sulphuric acid in the sample invert carefully several times to dissolve the floc. 8. Now, in a glass flask titrate 200 ml of sample water with a 0.025 standardize sodium thiosulphate and mixing a continuously until pale straw color forms. 9. Add 2 ml of starch indicator solution using dropper. The solution will turn blue. 10.Continue titration and point arise be careful stipend and you can hold a piece of paper against the glass beaker to clearly see the endpoint. 11.The concentration of dissolved oxygen is equal to the titrant used. Note: Each milliliter of sodium thiosulphate is equal to 1 mg/L of oxygen dissolved in water. Results: A dissolved oxygen level of 6 milligram/ L is sufficient for most affected species oxygen level below 4 milligram/L is stressful and even below 2 milligram /L will not sport aerobic aquatic life.
- 9. 8 | P a g e Practical No.3 Adaptive Features of Animals in Relation to Food and Environment Theory: In an ecosystem, organisms interact with abiotic and living environment organism. Some of the most important interactions among species in an ecosystem community involve feeding. All living things need food for energy and we know there are producers, herbivores, carnivores, top coronavirus and decomposers. Objective: Determine the place of an organism in a food chain. Explain how and what is the sequence of energy transfer to different communities of organisms. Procedure: 1. Opened the online Virtual lab. 2. Shuffle the cards on the table and then placed them on the right empty portion and clicked the icon of desired information. 3. Facts, habitat and energy source study made us able to figure out a food chain. 4. A food web was designed as shown.
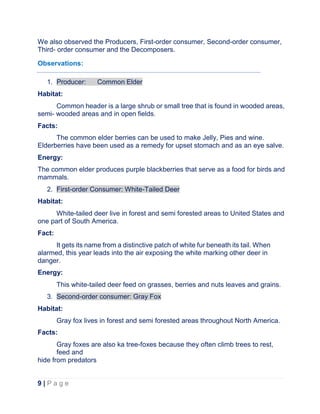
- 10. 9 | P a g e We also observed the Producers, First-order consumer, Second-order consumer, Third- order consumer and the Decomposers. Observations: 1. Producer: Common Elder Habitat: Common header is a large shrub or small tree that is found in wooded areas, semi- wooded areas and in open fields. Facts: The common elder berries can be used to make Jelly, Pies and wine. Elderberries have been used as a remedy for upset stomach and as an eye salve. Energy: The common elder produces purple blackberries that serve as a food for birds and mammals. 2. First-order Consumer: White-Tailed Deer Habitat: White-tailed deer live in forest and semi forested areas to United States and one part of South America. Fact: It gets its name from a distinctive patch of white fur beneath its tail. When alarmed, this year leads into the air exposing the white marking other deer in danger. Energy: This white-tailed deer feed on grasses, berries and nuts leaves and grains. 3. Second-order consumer: Gray Fox Habitat: Gray fox lives in forest and semi forested areas throughout North America. Facts: Gray foxes are also ka tree-foxes because they often climb trees to rest, feed and hide from predators
- 11. 10 | P a g e Energy: They get energy by feeding on small mammal, birds and vegetations. 4. Third-order Consumer: Grizzly Bear Habitat: The grizzly bear lives near the lakes, ponds and other wetlands in forests of North America. Facts: It is named from the long, silver tipped hairs on its back and shoulders that its coat a grizzled appearance. Energy: They have a varied diet that include fish, birds, mammals, turtles, frogs and fruits. 5. Decomposers: Bacillus subtillis Habitat: It is a common soil bacterium. Facts: Bacillus subtilis is found everywhere including on human skin. It often contaminates laboratory culture dishes. Energy: It breakdowns the organic material of soil.
- 12. 11 | P a g e Practical No.4 Study the Plant Population Density (Quadrant and Mark Recapture Method) Materials Required: Thread Hammer Nails Procedure: 1. Select a site for the study and hammer the nails on the site without harming the vegetation. 2. Fix four nails in the form of a square. 3. Each end of the nail is tied with the help of a thread making a 1m*1m quadrant. 4. Nine more similar quadrants are made at the site of the study. 5. The number of individuals of the species A present in the first quadrant are counted and the data is recorded in the table. 6. The number of individuals of species A in other quadrants is also counted and the data is recorded in the table. 7. Similarly, count the number of individuals of species B and C present in all the quadrants and record the data in the table. The density of the plant population is then calculated by the following equation: Density = Total number of individuals of the species in all sampling units (S) / Total number of sampling units studied (Q).
- 13. 12 | P a g e Conclusion: The population density is the highest for species A and the lowest for species C. The density value is expressed as the number of individuals per unit area. Mark Recapture Method Procedure: 1. This technique is used to simulate a population estimated by a wildlife biologist in the field. 2. The first step is to trap a random sample of animal of the species being studied. 3. These animals are then marked in some manner appropriate to the species and released. 4. In next step do another trapping. 5. Some animals capture d may have been marked from the first sample. 6. Using a simple ratio, a quick population estimated. 7. Petersen-Lincoln estimator of population size can be made as follows: N=population estimate M=number of individuals capture in 1st sample and marked N=number of individuals captured in second sample. M=number of n that were already marked Assuming that marked proportion in the sample is equal to the marked proportion inthe population suggest that N/M=n/m To solve for N we rearrange the formula N=nM/m
- 14. 13 | P a g e Practical No.5 Experimental Design and Approaches to Ecological Research (Writing a Research Project) The Summary: The major steps to write an ecological research project is 1. To select a topic 2. Ask question or enquiry 3. Conduct a preliminary research 4. Gather and evaluate sources 5. Free right to build up cited page 6. Complete draft 7. Workshop draft for structure 8. Revise and refine draft 9. Finalize project for submission Title clearly conveys the theme of the research project and the main Research question will increase the focus of the research the explanation is to explain that why our research is important and a brief literature review shows that you possess relevant knowledge to answer the Research question the proposed methodology for answering the Research question must be accurate at the time schedule for research project is also very essential. 1. Topic: The topic is assigned by the teacher or the teacher asked the student to think and discuss and then decide the topic. 2. Observation: The students gather the information by asking questions to the teachers and researchers and the best possible way to collect the observation is to study the already “published paper” of the researchers we can also call it as Review of Literature. 3. Research Work: Research work can also be classified as sampling that is the field work and the second possible way is the laboratory work. 4. Writing a Project:
- 15. 14 | P a g e All the gathered information from studying the research papers and from the experimentation the information is compiled or collected, in the form of the writing .If you are writing for an organization then the funding performer of that organization is filled. Submission: The compiling for the submission of the project also has a sequence. It includes: Abstract Introduction Review of literature Methodologies Result Discussion And References.