


Addressing Homelessness in King County
- 1. Copyright @ 2019 McKinsey & Company. All rights reserved. January 2020 Supporting exhibits https://www.mckinsey.com/industries/public-sector/our-insights/why-does- prosperous-king-county-have-a-homelessness-crisis Addressing homelessness in King County CONFIDENTIAL AND PROPRIETARY Any use of this material without specific permission of McKinsey & Company is strictly prohibited
- 2. McKinsey & Company 2 We can address homelessness in Seattle Homelessness is getting worse. Last year, 22,500 households experienced homelessness in Seattle, the most ever Prosperity is part of what is driving homelessness. Seattle’s job and population growth have been remarkable. Our housing growth has been robust, but insufficient. Additional affordable housing stock must be built. Particularly stock that is affordable for extremely-low- income households (ELI), those earning less than 30 percent of the area median income, or about $28,800 per year Building this housing will require substantial incremental public spending two to five times more than current local spending Beyond just building, we need a multi-pronged approach to the problem—including a set of projects each with short-, medium- and long-term targets and goals.
- 3. McKinsey & Company 3McKinsey & Company Though the King County point-in-time (PIT) count dropped in 2019, homelessness continues to increase 1. The annual PIT count is a physical count of people experiencing homelessness on a given night at the end of January 2. HMIS is a database of all households who accessed the homelessness response system in a given year. The data here is only households who were homeless from January through December of indicated years. 3. Households that experienced homelessness in 2018 and were not exited to permanent housing situations by the end of the year Sources: PIT counts reported to HUD (2009-2019); King County PIT count 2019 administered by All Home, HMIS The PIT count showed a decrease for the first time in January 2019. Our most comprehensive data, from the King County Homeless Management Information System (HMIS), shows a continued increase in the number of households experiencing homelessness. The number of households who experienced homeless- ness and remained without permanent housing is unchanged. King County homeless population by year Thousands of people1 Households experiencing homelessness at any time in year Thousands of households2 Permanent housing remains out of reach for thousands of families 2008 9.0 09 9.0 10 11.6 10.1 11 13 8.9 1412 15 16 17 2018 9.0 8.9 9.1 10.7 12.1 11.2 20.7 15.714.7 6.0 6.8 22.5 17 6.3 2016 15.7 2018 22.0 +4.2% Year ending: Households exited to permanent housing Households not permanently housed Measured on: Jan ‘09 Jan ‘19… … … … … … … …… Annual change
- 4. McKinsey & Company 4 1. Based on the HUD AI income thresholds for a one-person household, given that a majority of the homeless population in King County consists of individuals 2. Compared to share of King County population from U.S. Census population estimates, July 1, 2017 30-50% AMI 2% Demographics of households experiencing homelessness in 2018 $24.9 – $41.5K 17%9% 3% FamiliesVeterans People over 65 Unaccompanied youth under age 25 13% 59% Key interest groups Share of people in annual income brackets1 About 22,500 households were homeless for at least some of 2018 30% of households experiencing homelessness were chronically homeless Homeless General population Race & ethnicity %, 2018 48 27 15 3 3 3 16 60 6 10 1 17 1 6 Black or African American Asian White Hispanic or Latino American Indian or Alaska Native Native Hawaiian or Pacific Islander Multiple Races Homeless population relative to general population2 98% 50-80% AMI <1% $41.5K – $66.2K $0 – $24.9K 98% More than 22,000 households experience homelessness in Seattle each year Key group Sources: HMIS / All Home, American Community Survey Single adults under age 25 0-30% AMI Preliminary
- 5. McKinsey & Company 5 Seattle’s economy, population and incomes have grown quickly 1. Washington State Office of Financial Management population estimates for April 1 of each year 2. HUD calculated median incomes for a four-person family in King County Source: BEA, HUD, Washington State Office of Financial Management Growth is among the highest of any large US city… …with rapid increases in income GDP growth 2017-2018 for 25 largest MSAs, % King County population1, 000s King County area median income2, $000s 10.8 8.6 7.7 7.0 6.8 6.3 6.2 6.0 5.7 5.6 5.3 5.2 5.1 5.1 4.9 4.9 4.5 4.5 4.4 4.0 Dallas-Fort Worth-Arlington, TX San Jose-Sunnyvale-Santa Clara, CA Seattle-Tacoma-Bellevue, WA San Francisco-Oakland-Berkeley, CA San Diego-Chula Vista-Carlsbad, CA Phoenix-Mesa-Chandler, AZ Boston-Cambridge-Newton, MA-NH Houston-The Woodlands-Sugar Land, TX Denver-Aurora-Lakewood, CO * Riverside-San Bernardino-Ontario, CA Philadelphia-Camden-Wilmington, PA-NJ-DE-MD Los Angeles-Long Beach-Anaheim, CA Minneapolis-St. Paul-Bloomington, MN-WI Miami-Fort Lauderdale-Pompano Beach, FL Washington-Arlington-Alexandria, DC-VA-MD-WV * Baltimore-Columbia-Towson, MD Chicago-Naperville-Elgin, IL-IN-WI Atlanta-Sandy Springs-Alpharetta, GA New York-Newark-Jersey City, NY-NJ-PA Detroit-Warren-Dearborn, MI 162010 2,226 1,931 181311 12 14 15 17 2,154 2019 +1.6% p.a. +1.7% p.a. 12 201918 96 2010 11 1613 14 15 17 86 109 +1.7% p.a. +6.4% p.a.
- 6. McKinsey & Company 7 1. Puget Sound Regional Council estimates for King County 2. 2. WA State Office of Financial Management population estimates for April 1 of each year 3. September Zillow Rent Index time series data for multifamily, single family, and co-op/condo residences in King County 4. HUD Office of Policy Development and Research annual median income data for King County 15 130% 95% 2010 2017 150% 11 1412 1613 100% 105% 110% 115% 120% 125% 135% 140% 145% 155% Housing supply2Jobs1 Population2 Population, job, and housing growth in King County % of 2010 value Median rents and incomes % of 2010 value Jobs and population growing faster than housing Rents growing much faster than incomes 16142010 1511 12 130% 13 2017 95% 100% 105% 110% 115% 145% 120% 125% 135% 140% 150% 155% Median market rent4 Median Household Income5 +52% +21% +12% +8% Despite robust growth, the housing supply and average household incomes have not kept pace with job growth or rent increases Sources: Puget Sound Regional Council, WA State OFM, HUD PD&R, Zillow Rent Index +12%
- 7. McKinsey & Company 8 Rents have grown faster than incomes, exacerbating pressure on the poorest households 1.% of King County households in each AMI Band using the 2017 HUD Income thresholds for a 4-person household: <30% (<$22,800), 30-50% (<$48,000), 50-80% (<$76,800), 80-100% (<$96,000), and >100% (>$96,000) 2.Example occupational incomes for King County, US Bureau of Labor Statistics Sources: American Community Survey, HUD, Housing Choices Background Report, US Census Median Household Income 55% (479k) 80-100% <30% 12% (105k) 13% (110k) 9% (76k) >100% 11% (96k) 2017 50-80% 30-50% 2017 AMI band1 share of total households 2017 AMI band income range, $ >96,000 Example occupations in household of four2 1 software developer or 2 construction laborers 1 registered nurse or 2 administrative assistants >76,800 - <96,600 1 public school teacher or 2 retail workers >48,000 - <76,800 1 retail salesperson or 2 minimum wage earners >22,800 - <48,000 1 minimum wage earner<22,800 Income spent on rent in King County, % 45 50 40 35 30 0 55 60 2013 15 17 2019 0-30% AMI households 30-50% AMI households 50-80% AMI households Key group
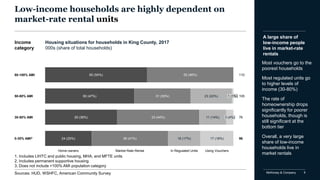
- 8. McKinsey & Company 9McKinsey & Company Low-income households are highly dependent on market-rate rental units Housing situations for households in King County, 2017 000s (share of total households) Most vouchers go to the poorest households Most regulated units go to higher levels of income (30-80%) The rate of homeownership drops significantly for poorer households, though is still significant at the bottom tier Overall, a very large share of low-income households live in market rentals A large share of low-income people live in market-rate rentals 23 (22%) 11 (14%) 50 (46%)60 (54%) 110 31 (30%) 1 (1%) 33 (44%) 50 (47%) 3 (4%)29 (38%) 17 (18%)16 (17%)39 (41%)24 (25%) 105 76 96 Using VouchersIn Regulated UnitsMarket Rate RentalHome owners Income category 0-30% AMI2 30-50% AMI 80-100% AMI 50-80% AMI 1. Includes LIHTC and public housing, MHA, and MFTE units 2. Includes permanent supportive housing 3. Does not include >100% AMI population category Sources: HUD, WSHFC, American Community Survey
- 9. McKinsey & Company 10 154 (43%) 17 81 (23%) 46 (13%) 28 (8%) 12 82 (23%) 85 (22%) 139 (39%) 24 (6%) 64 (18%) 105 (29%) 72 (20%) 100 (28%) 27 (7%) 13 48 (13%) 57 (16%) 122 (34%) 27 (8%) 341 80 (21%) 98 (26%) 44 (11%) 134 (35%) 116 (29%) 25 (7%) 122 (34%) 151 (44%) 16 90 (23%) 120 (31%) 39 (11%) 357 35 (9%) 136 (34%) 28 (8%) 18 (5%) 24 (6%) 182 381 97 (24%) 92 (27%) 52 (15%) 151 (37%) 350 123 (32%) 152010 112 (28%) <30% (<$720) 28 (8%) 29 (7%) 26 (7%) 64 (18%) 408 137 (39%) 30-50% ($720-$1,200) 23 (6%) 20192 >100% (>$2,400) 24 (6%) 50-80% ($1,200-$1,920) 94 (27%) 27 (8%) 14 28 (8%) 11 356 359 360 387 396 65 (18%) 80-100% ($1,920-$2,400) Since 2010, Seattle has lost 112,000 housing units that households earning less than 80% of AMI could afford Supply of rental units in King County by the AMI Tier who can afford them1 (thousands of units) 1. Includes units affordable at the high end of the range and unaffordable at the low end 2. Projection based on 2013-17 CAGR 3. Assumed that >100% AMI rental stock will grow at same rate as households in that income category 4. Maximum monthly affordable rent calculated using the 2017 HUD Income thresholds for a 4-person household Projected2,3AMI bands and corresponding monthly affordable rent range 112k affordable units lost since 2010 Source: American Community Survey 24k units affordable to households with <30% AMI in 2017
- 10. McKinsey & Company 11 40 100 0 10 20 30 70 60 80 90 50 24 Down-rented / vacant units2 6 Total Supply Supply gap 18 37 18 17 Households receiving vouchers 24 Homeowners 96 Total demand 96 Households renting 55 Affordable Units1 King County had a gap of 37,000 affordable homes for households earning less than 30% of AMI in 2017 1. A unit where monthly rent plus basic utilities does not exceed 30% of household monthly income 2. A unit available at a lower AMI range rented by a household in a higher AMI tier (e.g., a 0-30% unit rented by a family at 50-80% AMI 3. Households in 0-30% AMI range spending >30% of monthly income on rent 4. Households in 0-30% AMI range spending <30% of monthly income on rent 2017 supply and demand of affordable rental units for households earning 30% or less of the area median income in King County Number of units, number of households, thousands Rent-burdened households3 Households in affordable units4 Supply (housing stock) Demand (households) Source: ACS PUMS Data 2016 37k units are required to stably house all homeless and rent- burdened households
- 11. McKinsey & Company 13 Of the 37,000 rent-burdened ELI families, 16,000 are without permanent housing 16 37 Lack of permanent housing Lack of affordable housing Range of estimate Sizing the need Estimates of affordable housing units needed for 0-30% AMI households 000s of homes Homelessness is caused largely by a lack of homes. Seattle has housing gaps at all levels of affordability, so vouchers are challenging. Raising incomes, including the minimum wage, won’t solve the problem because landlords raise rents as demand rises Therefore, the only viable solution is to build more regulated homes. The homes needed can range from: The number of households currently without permanent housing (16,000) to The number of low-income households now renting unaffordable market-rate apartments (which are all unstable)
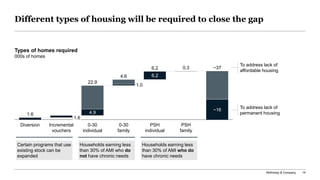
- 12. McKinsey & Company 14 Different types of housing will be required to close the gap 1.6 4.9 1.0 6.2 0.3 Diversion 0-30 family 1.6 Incremental vouchers PSH individual 0-30 individual PSH family ~16 22.9 4.6 6.2 ~37 Certain programs that use existing stock can be expanded Households earning less than 30% of AMI who do not have chronic needs Households earning less than 30% of AMI who do have chronic needs Types of homes required 000s of homes To address lack of affordable housing To address lack of permanent housing
- 13. McKinsey & Company 15 Closing this gap would require an increase of 3-5 times current non- federal spending 128 262 134 Seattle1 King County1 Total neededCurrent total1 Addressing lack of permanent housing Addressing lack of affordable housing ~700-1400 ~450 ~1,100 1. Excludes federal funding for affordable housing of about $400 million per year, through LIHTC tax credits and Housing Authority subsidies Annual spending required over next 10 years $ Millions Assumptions This conservative estimate is based on several assumptions: No increase in services spend No inflation in capex or opex per unit No increased need for affordable housing – that rents do not rise faster than median incomes
- 14. Annual spend, $ millions 70 134 169 153 392 Federally funded1 128 Seattle and King County 2019 homelessness budgets2 262 The necessary investments are large compared to current homelessness spending but in line with other public works 1. Current budgets provided by Seattle and King County Housing Authorities. LIHTC estimate based on 2018 awards of 9% tax credits for King County 2. 2019 budgets for homelessness provided by City of Seattle and King County (Note: Seattle estimate for local spending in 2017 was $196M, as cited in McKinsey’s previous report. Difference is a combination of increases in spending and potential difference in definition.) 3. Sound Transit Annual Report 2018-2023 (https://www.soundtransit.org/sites/default/files/Draft-TDP-2018-2023-and-2017-Annual-Report.pdf) 4. Port of Seattle 2019 Budget Reading & Final Adoption (https://meetings.portseattle.org/portmeetings/attachments/2018/2018_11_27_RM_8c_supp.pdf) Current spending on homelessness and ELI housing 1,181 447 Low estimate High estimate 1,950 1,001 Sound Transit 2017-2023 Capital Plan (avg per year)3 Port of Seattle 2019 Capital budget4 Needed incremental spending on ELI housing per year for the next 10 years Examples of other regional priorities King County Seattle LIHTC Approximate current spending: $655 million
- 15. 17McKinsey & CompanyMcKinsey & Company Society already incurs $24,ooo per year in direct, indirect and opportunity costs for each homeless household Sources: King County HMIS and 2019 PIT Count, 2017-2018 City/ County Homelessness Budget, Santa Clara “Home Not Found.” detailed sources and assumptions in backup Indirect3 Opportunity costDirect1 $ per household2 $ per household2 $ per household2 Shelter Emergency 1,720 1,458 262Transitional Other services 964 Tourism5Healthcare Local business6Law enforcement & criminal justice Education7Social services Poverty trap8 1,756 2,539 207 2,534Public services4 8,191 5,146 1,123 142 $7,035 per household opportunity costs $14,602 per household in indirect cost to society $2,684 per household in direct supports About $24,300 per year per household incurred on homelessness About $17,000 per year cost to provide housing