Location via proxy:   [ UP ]  
[Report a bug]   [Manage cookies]                
SlideShare a Scribd company logo
Introducing Agile Business
Intelligence Sustainably:
Implement the Right Building
Blocks in the Right Order
Workshop Excercises
Raphael Branger, IT-Logix AG
Agile Testing Days 2017 Intoducing AgileBI Sustainably - Excercises
ERP, CRM, Excel,
…
Weather data,
Demographic
data, Social
Media…
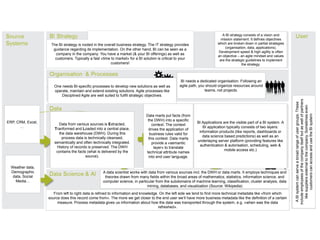
The BI strategy is rooted in the overall business strategy. The IT strategy provides
guidance regarding its implementation. On the other hand, BI can be seen as a
company in the company: You have a market (& your BI offerings) as well as
customers. Typically a fast «time to market» for a BI solution is critical to your
customers!
A BI strategy consists of a vision and
mission statement. It defines objectives
which are broken down in partial strategies
(organisation, data, applications).
Development speed & high agility is often
an objective – an agile mindset and values
are the strategic guidelines to implement
the strategy.
One needs BI-specific processes to develop new solutions as well as
operate, maintain and extend existing solutions. Agile processes like
Disciplined Agile are well suited to fullfil strategic objectives.
BI needs a dedicated organisation. Following an
agile path, you should organize resources around
teams, not projects.
Data from various sources is Extracted,
Tranformed and Loaded into a central place,
the data warehouse (DWH). During this
process data is technically cleansed,
semantically and often technically integrated.
History of records is preserved. The DWH
contains the facts (what is delivered by the
source).
Data marts put facts (from
the DWH) into a specific
context. The context
drives the application of
business rules valid for
this context. Data marts
provide a «semantic
layer» to translate
technical attribute names
into end user language.
BI Applications are the visible part of a BI system. A
BI application typically consists of two layers:
information products (like reports, dashboards or
data science based predictions) as well as an
underlaying server platform (providing features like
authentication & autorisation, scheduling, web &
mobile access etc.)
ABIsystemcanserveabroadrangeofusergroups.These
includeemployeesofthecompanyitselfbutaswellofpartners
likesuppliersexternaltothecompany.Sometimeseven
customerscanaccessandusetheBIsystem
From left to right data is refined to information and knowledge. On the left side we tend to find more technical metadata like «from which
source does this record come from». The more we get closer to the end user we’ll have more business metadata like the definition of a certain
measure. Process metadata gives us information about how the data was transported through the system, e.g. «when was the data
refreshed».
A data scientist works with data from various sources incl. the DWH or data marts. It employs techniques and
theories drawn from many fields within the broad areas of mathematics, statistics, information science, and
computer science, in particular from the subdomains of machine learning, classification, cluster analysis, data
mining, databases, and visualization (Source: Wikipedia)
Agile Testing Days 2017 Intoducing AgileBI Sustainably - Excercises
EXERCISE 2 «AGILE BI BUILDING BLOCKS»
7
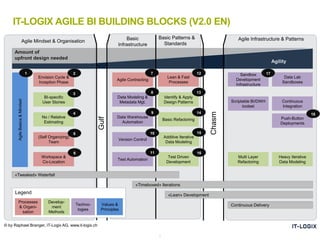
IT-LOGIX AGILE BI BUILDING BLOCKS (V2.0 EN)
Agility
Amount of
upfront design needed
Basic
Infrastructure
Basic Patterns &
Standards
Agile Mindset & Organisation
AgileBasics&Mindset
Agile Infrastructure & Patterns
BI-specific
User Stories
Envision Cycle &
Inception Phase
No / Relative
Estimating
(Self Organizing)
Team
Workspace &
Co-Location
Identify & Apply
Design Patterns
Version Control
Test Automation
Test Driven
Development
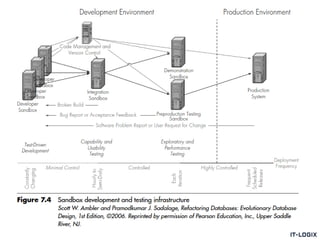
Sandbox
Development
Infrastructure
Continuous
Integration
Push-Button
Deployments
Multi Layer
Refactoring
Heavy Iterative
Data Modeling
Gulf
Chasm
Agile Contracting
Scriptable BI/DWH
toolset
«Tweaked» Waterfall
«Timeboxed» Iterations
«Lean» Development
Lean & Fast
Processes
Legend
Processes
& Organi-
sation
Develop-
ment
Methods
Techno-
logies
Values &
Principles
© by Raphael Branger, IT-Logix AG, www.it-logix.ch
Data Lab
Sandboxes
Continuous Delivery
Data Modeling &
Metadata Mgt.
Data Warehouse
Automation
Basic Refactoring
Additive Iterative
Data Modeling
10
2
3
4
5
6
71
8
9
11
12
13
14
15
16
17
18
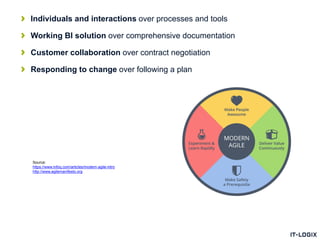
Individuals and interactions over processes and tools
Working BI solution over comprehensive documentation
Customer collaboration over contract negotiation
Responding to change over following a plan
Source:
https://www.infoq.com/articles/modern-agile-intro
http://www.agilemanifesto.org
Agile Testing Days 2017 Intoducing AgileBI Sustainably - Excercises
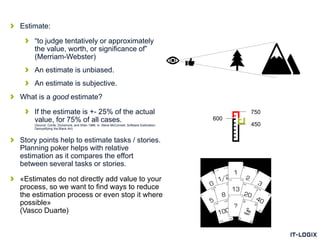
600
750
450
Estimate:
“to judge tentatively or approximately
the value, worth, or significance of”
(Merriam-Webster)
An estimate is unbiased.
An estimate is subjective.
What is a good estimate?
If the estimate is +- 25% of the actual
value, for 75% of all cases.
(Source: Conte, Dunsmore, and Shen 1986, in: Steve McConnell, Software Estimation:
Demystifying the Black Art)
Story points help to estimate tasks / stories.
Planning poker helps with relative
estimation as it compares the effort
between several tasks or stories.
«Estimates do not directly add value to your
process, so we want to find ways to reduce
the estimation process or even stop it where
possible»
(Vasco Duarte)
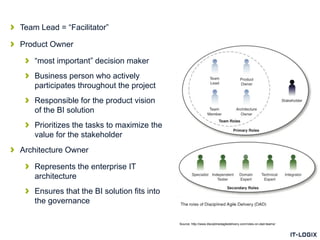
Team Lead = “Facilitator”
Product Owner
“most important” decision maker
Business person who actively
participates throughout the project
Responsible for the product vision
of the BI solution
Prioritizes the tasks to maximize the
value for the stakeholder
Architecture Owner
Represents the enterprise IT
architecture
Ensures that the BI solution fits into
the governance
Source: http://www.disciplinedagiledelivery.com/roles-on-dad-teams/
Agile Testing Days 2017 Intoducing AgileBI Sustainably - Excercises
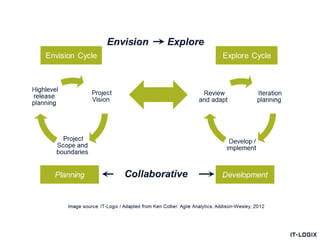
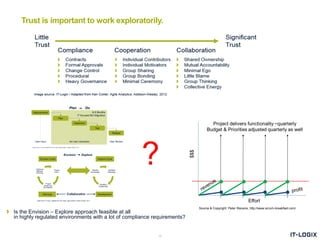
Is the Envision – Explore approach feasible at all
in highly regulated environments with a lot of compliance requirements?
Trust is important to work exploratorily.
?
15
Source & Copyright: Peter Stevens, http://www.scrum-breakfast.com/
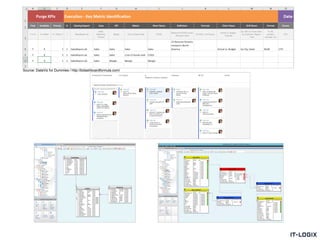
Source: DataViz for Dummies / http://bidashboardformula.com/
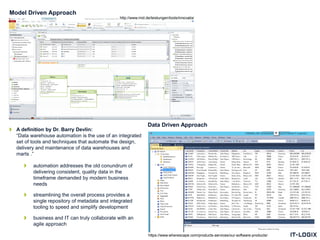
Model Driven Approach
Data Driven Approach
A definition by Dr. Barry Devlin:
“Data warehouse automation is the use of an integrated
set of tools and techniques that automate the design,
delivery and maintenance of data warehouses and
marts .”
automation addresses the old conundrum of
delivering consistent, quality data in the
timeframe demanded by modern business
needs
streamlining the overall process provides a
single repository of metadata and integrated
tooling to speed and simplify development
business and IT can truly collaborate with an
agile approach
http://www.mid.de/leistungen/tools/innovator
https://www.wherescape.com/products-services/our-software-products/
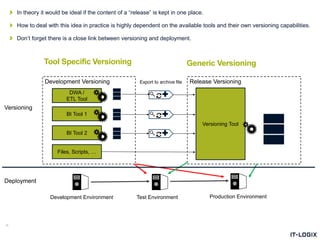
In theory it would be ideal if the content of a “release” is kept in one place.
How to deal with this idea in practice is highly dependent on the available tools and their own versioning capabilities.
Don’t forget there is a close link between versioning and deployment.
Tool Specific Versioning
18
Generic Versioning
DWA /
ETL Tool
BI Tool 1
BI Tool 2
Files, Scripts, …
Versioning Tool
Development Versioning Release VersioningExport to archive file
Development Environment Test Environment Production Environment
Versioning
Deployment
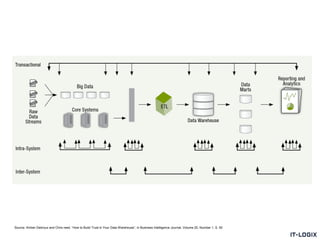
Source: Amber Debroux and Chris reed, “How to Build Trust in Your Data Warehouse”, in Business Intelligence Journal, Volume 20, Number 1, S. 50
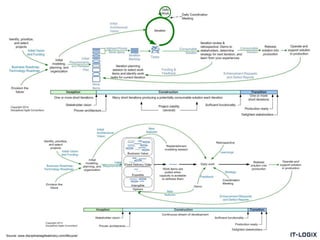
Source: www.disciplinedagiledelivery.com/lifecycle/
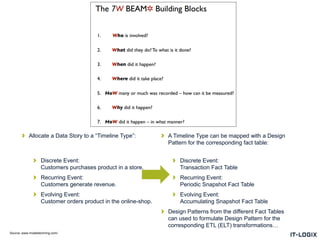
Allocate a Data Story to a “Timeline Type”:
Discrete Event:
Customers purchases product in a store.
Recurring Event:
Customers generate revenue.
Evolving Event:
Customer orders product in the online-shop.
A Timeline Type can be mapped with a Design
Pattern for the corresponding fact table:
Discrete Event:
Transaction Fact Table
Recurring Event:
Periodic Snapshot Fact Table
Evolving Event:
Accumulating Snapshot Fact Table
Design Patterns from the different Fact Tables
can used to formulate Design Pattern for the
corresponding ETL (ELT) transformations…
Source: www.modelstorming.com/
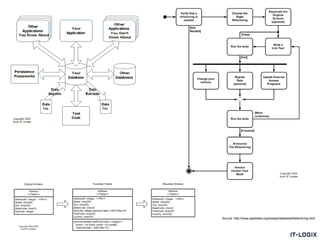
Source: http://www.agiledata.org/essays/databaseRefactoring.html
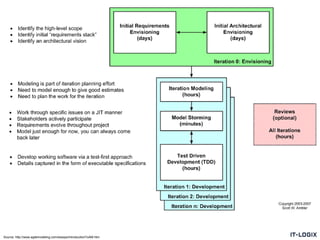
Source: http://www.agilemodeling.com/essays/introductionToAM.htm
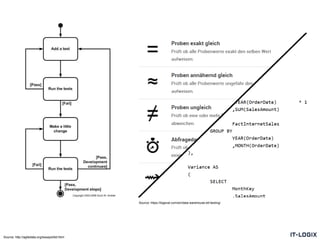
Source: http://agiledata.org/essays/tdd.html
Source: https://bigeval.com/en/data-warehouse-etl-testing/
Agile Testing Days 2017 Intoducing AgileBI Sustainably - Excercises
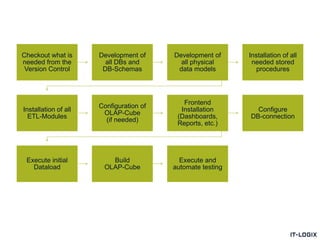
Checkout what is
needed from the
Version Control
Development of
all DBs and
DB-Schemas
Development of
all physical
data models
Installation of all
needed stored
procedures
Installation of all
ETL-Modules
Configuration of
OLAP-Cube
(if needed)
Frontend
Installation
(Dashboards,
Reports, etc.)
Configure
DB-connection
Execute initial
Dataload
Build
OLAP-Cube
Execute and
automate testing
EXERCISE 3 «BI USER STORIES»
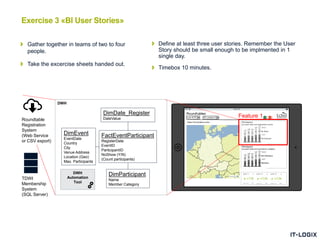
Exercise 3 «BI User Stories»
DWH
Gather together in teams of two to four
people.
Take the excercise sheets handed out.
FactEventParticipant
RegisterDate
EventID
ParticipantID
NoShow (Y/N)
(Count participants)
DimEvent
EventDate
Country
City
Venue Address
Location (Geo)
Max. Participants
DimDate_Register
DateValue
DimParticipant
Name
Member Category
Roundtable
Registration
System
(Web Service
or CSV export)
TDWI
Membership
System
(SQL Server)
Define at least three user stories. Remember the User
Story should be small enough to be implmented in 1
single day.
Timebox 10 minutes.
DWH
Automation
Tool
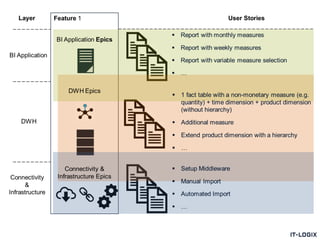
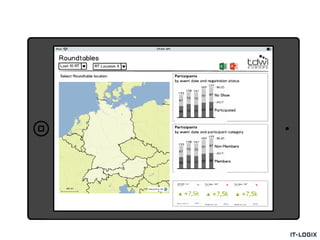
Feature 1
Agile Testing Days 2017 Intoducing AgileBI Sustainably - Excercises
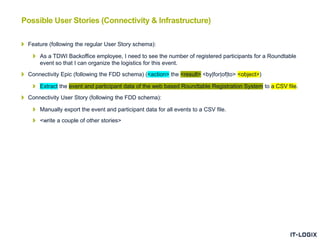
Feature (following the regular User Story schema):
As a TDWI Backoffice employee, I need to see the number of registered participants for a Roundtable
event so that I can organize the logistics for this event.
Connectivity Epic (following the FDD schema) (<action> the <result> <by|for|of|to> <object>)
Extract the event and participant data of the web based Roundtable Registration System to a CSV file.
Connectivity User Story (following the FDD schema):
Manually export the event and participant data for all events to a CSV file.
<write a couple of other stories>
Possible User Stories (Connectivity & Infrastructure)
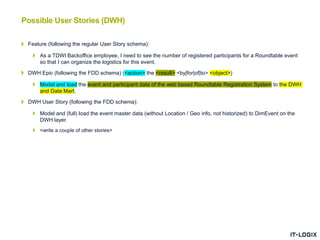
Feature (following the regular User Story schema):
As a TDWI Backoffice employee, I need to see the number of registered participants for a Roundtable event
so that I can organize the logistics for this event.
DWH Epic (following the FDD schema) (<action> the <result> <by|for|of|to> <object>)
Model and load the event and participant data of the web based Roundtable Registration System to the DWH
and Data Mart.
DWH User Story (following the FDD schema):
Model and (full) load the event master data (without Location / Geo info, not historized) to DimEvent on the
DWH layer.
<write a couple of other stories>
Possible User Stories (DWH)
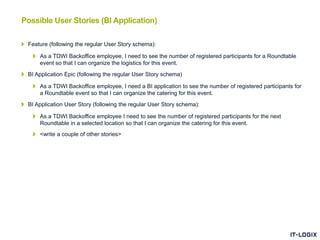
Feature (following the regular User Story schema):
As a TDWI Backoffice employee, I need to see the number of registered participants for a Roundtable
event so that I can organize the logistics for this event.
BI Application Epic (following the regular User Story schema)
As a TDWI Backoffice employee, I need a BI application to see the number of registered participants for
a Roundtable event so that I can organize the catering for this event.
BI Application User Story (following the regular User Story schema):
As a TDWI Backoffice employee I need to see the number of registered participants for the next
Roundtable in a selected location so that I can organize the catering for this event.
<write a couple of other stories>
Possible User Stories (BI Application)

More Related Content

Agile Testing Days 2017 Intoducing AgileBI Sustainably - Excercises

  • 1. Introducing Agile Business Intelligence Sustainably: Implement the Right Building Blocks in the Right Order Workshop Excercises Raphael Branger, IT-Logix AG
  • 3. ERP, CRM, Excel, … Weather data, Demographic data, Social Media… The BI strategy is rooted in the overall business strategy. The IT strategy provides guidance regarding its implementation. On the other hand, BI can be seen as a company in the company: You have a market (& your BI offerings) as well as customers. Typically a fast «time to market» for a BI solution is critical to your customers! A BI strategy consists of a vision and mission statement. It defines objectives which are broken down in partial strategies (organisation, data, applications). Development speed & high agility is often an objective – an agile mindset and values are the strategic guidelines to implement the strategy. One needs BI-specific processes to develop new solutions as well as operate, maintain and extend existing solutions. Agile processes like Disciplined Agile are well suited to fullfil strategic objectives. BI needs a dedicated organisation. Following an agile path, you should organize resources around teams, not projects. Data from various sources is Extracted, Tranformed and Loaded into a central place, the data warehouse (DWH). During this process data is technically cleansed, semantically and often technically integrated. History of records is preserved. The DWH contains the facts (what is delivered by the source). Data marts put facts (from the DWH) into a specific context. The context drives the application of business rules valid for this context. Data marts provide a «semantic layer» to translate technical attribute names into end user language. BI Applications are the visible part of a BI system. A BI application typically consists of two layers: information products (like reports, dashboards or data science based predictions) as well as an underlaying server platform (providing features like authentication & autorisation, scheduling, web & mobile access etc.) ABIsystemcanserveabroadrangeofusergroups.These includeemployeesofthecompanyitselfbutaswellofpartners likesuppliersexternaltothecompany.Sometimeseven customerscanaccessandusetheBIsystem From left to right data is refined to information and knowledge. On the left side we tend to find more technical metadata like «from which source does this record come from». The more we get closer to the end user we’ll have more business metadata like the definition of a certain measure. Process metadata gives us information about how the data was transported through the system, e.g. «when was the data refreshed». A data scientist works with data from various sources incl. the DWH or data marts. It employs techniques and theories drawn from many fields within the broad areas of mathematics, statistics, information science, and computer science, in particular from the subdomains of machine learning, classification, cluster analysis, data mining, databases, and visualization (Source: Wikipedia)
  • 5. EXERCISE 2 «AGILE BI BUILDING BLOCKS»
  • 6. 7 IT-LOGIX AGILE BI BUILDING BLOCKS (V2.0 EN) Agility Amount of upfront design needed Basic Infrastructure Basic Patterns & Standards Agile Mindset & Organisation AgileBasics&Mindset Agile Infrastructure & Patterns BI-specific User Stories Envision Cycle & Inception Phase No / Relative Estimating (Self Organizing) Team Workspace & Co-Location Identify & Apply Design Patterns Version Control Test Automation Test Driven Development Sandbox Development Infrastructure Continuous Integration Push-Button Deployments Multi Layer Refactoring Heavy Iterative Data Modeling Gulf Chasm Agile Contracting Scriptable BI/DWH toolset «Tweaked» Waterfall «Timeboxed» Iterations «Lean» Development Lean & Fast Processes Legend Processes & Organi- sation Develop- ment Methods Techno- logies Values & Principles © by Raphael Branger, IT-Logix AG, www.it-logix.ch Data Lab Sandboxes Continuous Delivery Data Modeling & Metadata Mgt. Data Warehouse Automation Basic Refactoring Additive Iterative Data Modeling 10 2 3 4 5 6 71 8 9 11 12 13 14 15 16 17 18
  • 7. Individuals and interactions over processes and tools Working BI solution over comprehensive documentation Customer collaboration over contract negotiation Responding to change over following a plan Source: https://www.infoq.com/articles/modern-agile-intro http://www.agilemanifesto.org
  • 10. 600 750 450 Estimate: “to judge tentatively or approximately the value, worth, or significance of” (Merriam-Webster) An estimate is unbiased. An estimate is subjective. What is a good estimate? If the estimate is +- 25% of the actual value, for 75% of all cases. (Source: Conte, Dunsmore, and Shen 1986, in: Steve McConnell, Software Estimation: Demystifying the Black Art) Story points help to estimate tasks / stories. Planning poker helps with relative estimation as it compares the effort between several tasks or stories. «Estimates do not directly add value to your process, so we want to find ways to reduce the estimation process or even stop it where possible» (Vasco Duarte)
  • 11. Team Lead = “Facilitator” Product Owner “most important” decision maker Business person who actively participates throughout the project Responsible for the product vision of the BI solution Prioritizes the tasks to maximize the value for the stakeholder Architecture Owner Represents the enterprise IT architecture Ensures that the BI solution fits into the governance Source: http://www.disciplinedagiledelivery.com/roles-on-dad-teams/
  • 13. Is the Envision – Explore approach feasible at all in highly regulated environments with a lot of compliance requirements? Trust is important to work exploratorily. ? 15 Source & Copyright: Peter Stevens, http://www.scrum-breakfast.com/
  • 14. Source: DataViz for Dummies / http://bidashboardformula.com/
  • 15. Model Driven Approach Data Driven Approach A definition by Dr. Barry Devlin: “Data warehouse automation is the use of an integrated set of tools and techniques that automate the design, delivery and maintenance of data warehouses and marts .” automation addresses the old conundrum of delivering consistent, quality data in the timeframe demanded by modern business needs streamlining the overall process provides a single repository of metadata and integrated tooling to speed and simplify development business and IT can truly collaborate with an agile approach http://www.mid.de/leistungen/tools/innovator https://www.wherescape.com/products-services/our-software-products/
  • 16. In theory it would be ideal if the content of a “release” is kept in one place. How to deal with this idea in practice is highly dependent on the available tools and their own versioning capabilities. Don’t forget there is a close link between versioning and deployment. Tool Specific Versioning 18 Generic Versioning DWA / ETL Tool BI Tool 1 BI Tool 2 Files, Scripts, … Versioning Tool Development Versioning Release VersioningExport to archive file Development Environment Test Environment Production Environment Versioning Deployment
  • 17. Source: Amber Debroux and Chris reed, “How to Build Trust in Your Data Warehouse”, in Business Intelligence Journal, Volume 20, Number 1, S. 50
  • 19. Allocate a Data Story to a “Timeline Type”: Discrete Event: Customers purchases product in a store. Recurring Event: Customers generate revenue. Evolving Event: Customer orders product in the online-shop. A Timeline Type can be mapped with a Design Pattern for the corresponding fact table: Discrete Event: Transaction Fact Table Recurring Event: Periodic Snapshot Fact Table Evolving Event: Accumulating Snapshot Fact Table Design Patterns from the different Fact Tables can used to formulate Design Pattern for the corresponding ETL (ELT) transformations… Source: www.modelstorming.com/
  • 24. Checkout what is needed from the Version Control Development of all DBs and DB-Schemas Development of all physical data models Installation of all needed stored procedures Installation of all ETL-Modules Configuration of OLAP-Cube (if needed) Frontend Installation (Dashboards, Reports, etc.) Configure DB-connection Execute initial Dataload Build OLAP-Cube Execute and automate testing
  • 25. EXERCISE 3 «BI USER STORIES»
  • 26. Exercise 3 «BI User Stories» DWH Gather together in teams of two to four people. Take the excercise sheets handed out. FactEventParticipant RegisterDate EventID ParticipantID NoShow (Y/N) (Count participants) DimEvent EventDate Country City Venue Address Location (Geo) Max. Participants DimDate_Register DateValue DimParticipant Name Member Category Roundtable Registration System (Web Service or CSV export) TDWI Membership System (SQL Server) Define at least three user stories. Remember the User Story should be small enough to be implmented in 1 single day. Timebox 10 minutes. DWH Automation Tool Feature 1
  • 28. Feature (following the regular User Story schema): As a TDWI Backoffice employee, I need to see the number of registered participants for a Roundtable event so that I can organize the logistics for this event. Connectivity Epic (following the FDD schema) (<action> the <result> <by|for|of|to> <object>) Extract the event and participant data of the web based Roundtable Registration System to a CSV file. Connectivity User Story (following the FDD schema): Manually export the event and participant data for all events to a CSV file. <write a couple of other stories> Possible User Stories (Connectivity & Infrastructure)
  • 29. Feature (following the regular User Story schema): As a TDWI Backoffice employee, I need to see the number of registered participants for a Roundtable event so that I can organize the logistics for this event. DWH Epic (following the FDD schema) (<action> the <result> <by|for|of|to> <object>) Model and load the event and participant data of the web based Roundtable Registration System to the DWH and Data Mart. DWH User Story (following the FDD schema): Model and (full) load the event master data (without Location / Geo info, not historized) to DimEvent on the DWH layer. <write a couple of other stories> Possible User Stories (DWH)
  • 30. Feature (following the regular User Story schema): As a TDWI Backoffice employee, I need to see the number of registered participants for a Roundtable event so that I can organize the logistics for this event. BI Application Epic (following the regular User Story schema) As a TDWI Backoffice employee, I need a BI application to see the number of registered participants for a Roundtable event so that I can organize the catering for this event. BI Application User Story (following the regular User Story schema): As a TDWI Backoffice employee I need to see the number of registered participants for the next Roundtable in a selected location so that I can organize the catering for this event. <write a couple of other stories> Possible User Stories (BI Application)