Apre 2 t06
•
0 likes•195 views

1) The document reports on the 2nd quarter 2006 results of an unnamed company. It highlights an adjusted EBITDA of R$671.2 million for 2Q06 and R$1,253.6 million for the first half of 2006. 2) Net profit was R$201.9 million for 2Q06, a significant increase from R$25.1 million for the same period last year. 3) The company reduced its consolidated net debt by 12% over the last 12 months through debt repayment and renegotiation.
Report
Share


Apre 2 t06
- 1. 2nd quarter 2006 Results August 11, 2006
- 2. Highlights Market Highlights Tariff Adjusment and Operating Operating Performance Performance Bilateral Contract Financial Performance Financial Performance Debt Profile Cash Flow Conclusion
- 4. Highlights •Adjusted EBITDA of R$ 582.4 million and net profit of R$ 25.1 million 1Q06 •Compliance to the new rules of BOVESPA’s Level 2 •Increase of tag along from 70% to 80% •Board of Directors with at least 20% of independent members •Consolidated Net Debt reduction of 12% in the last 12 months and conclusion of the early liquidation of renegotiated debt 2Q06 •Adjusted EBITDA of R$ 1,253.6 million in 1H06 and R$ 671.2 million in 2Q06 – increases of 15.7% and 15.3% compared to equivalent periods of 2005 •Net profit of R$ 227 million in 1H06 (R$ 107 million higher than 1H05 figure) and R$ 201.9 million in 2Q06 (R$ 176.8 million higher than 1Q06 figure) •Tariff Adjustment – 11.45% (07/04/2006) Subsequent •Rating increased by S&P in 07/07/2006 (national scale – events from “BBB” to “BBB+”) •Approved in Extraordinary General Meeting (07/11/2006) the creation of new class B of Eletropaulo’s preferred shares that will offer 100% of tag along 4
- 5. Consumption Comparison in GWh Average Tariff R$/MWh NOTE: Charts do not consider own consumption 2Q05 2Q06 Variation % RESIDENTIAL 307.3 306.1 - 0.4% INDUSTRIAL 219.6 242.5 + 10.5% COMMERCIAL 272.1 281.0 + 3.2% OTHERS 210.4 230.5 + 9.5% 4.7% TOTAL 267.3 279.1 + 3.9% 9,578 -0.6% 9,150 8.7% 7,968 7,924 3,209 2,952 -12.5% 2,434 2,433 39.9% 1,902 1,663 1,654 -8.9% 1,182 680 619 Residential Industrial Commercial Public Sector Free Billed Market Total Market and Others Consumers 2Q05 2Q06 5
- 6. Retention of Potentially Free Consumers Net Revenues with TUSD X Free Captive Consumers X Free Consumers consumption % Total Market – 2Q06 99 106 95 84 78 1,654 Potentially Free 1,500 Consumers 54 1,312 1,407 Captive 48 2% 38 1,182 Consumers 30 964 81% 19 806 750 641 479 Free Consumers 17% 1Q04 2Q04 3Q04 4Q04 1Q05 2Q05 3Q05 4Q05 1Q06 2Q06 Free Consumers (GWh) TUSD (R$ million) Captive Market Evolution* (GWh) Increase of 5.3% (12 months) 7,621 7,453 7,465 7,076 6,998 7,261 7,315 6,718 6,983 7,016 * Excluding all current free consumers from all previous periods 1Q04 2Q04 3Q04 4Q04 1Q05 2Q05 3Q05 4Q05 1Q06 2Q06 6
- 7. Tariff Evolution 18.6% 17.6% 13.8% 14.3% 11.1% 11.6% 11.5% 7.6% 12.1% 16.9% 7.5% 11.8% 7.3% 2.1% 9.9% 1.6% 6.3% 4.8% 3.7% 4.5% 3.6% 2.5% 1.7% 1.6% -4.3% 1999 2000 2001 2002 2003 2004 2005 2006 Part B Part A PIS/COFINS IGPM 2006 Tariff Adjustment by Consumption Class Index Low voltage -1.91% High voltage 8.26% A2 (88 to 138 kV) 4.57% A3a (34.5 kV) 6.20% A4 (2.3 to 25 kV) 9.08% 7
- 8. Operating Highlights Loss Evolution (%) Collection Rate - % over Gross Revenue 13.5 12.9 13.4 12.2 97.5 99.0 97.7 99.0 7.9 7.3 7.8 -9% 6.6 +1.4% 5.6 5.6 5.6 5.6 2004 2005 1H05 1H06 2004 2005 1H05 1H06 Technical Losses Com m ercial Losses Fraud combat: 239 thousand inspections and 33 thousand frauds Collection Rate (current bills) detected Public Sector: 102.6% Cost of R$ 29 million Private Sector: 98.8% Retroactive Energy negotiated + Energy Added – 135 Increase of monthly average of cuts from 75 thousand to GWh (R$ 64 million) 111 thousand (1H05x1H06) Regularization of Clandestine Connections: 38 thousand regularizations – Revenue of R$ 26 million 8 Investment – R$17 million
- 9. Capex 2Q06 R$ million 404 49 330 33 217 32 355 297 81 92 186 16 11 76 70 2003 2004 2005 1Q06 2Q06 Capex Self Financed R$ 173 million invested in the first semester of 2006 9
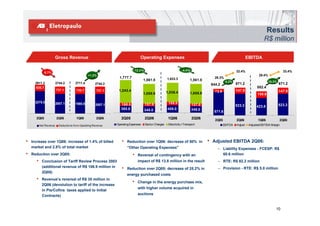
- 10. Results R$ million Gross Revenue Operating Expenses EBITDA -12.2% -4.4% 33.4% 33.4% -5.7% +1.2% 29.4% 1,777.7 1,633.3 28.3% 1,561.5 1,561.5 4,2% 15,3% 2911.2 2744.2 2711.4 2744.2 644.2 671.2 671.2 635.7 582.4 737.1 730.7 737.1 1,243.4 72.6 147.9 147.9 1,055.9 1,036.4 1,055.9 158.6 2275.5 2007.1 1980.6 188.9 2007.1 168.5 157.6 157.6 523.3 523.3 423.8 365.8 348.0 408.0 348.0 571.6 2Q05 2Q06 1Q06 2Q06 2Q05 2Q06 1Q06 2Q06 2Q05 2Q06 1Q06 2Q06 Net Revenue Deductio ns fro m Operating Revenue Operating Expenses Sector Charges Electricity +Transport EBITDA Adjust Adjusted EBTIDA Margin • Increase over 1Q06: increase of 1.4% of billed • Reduction over 1Q06: decrease of 50% in • Adjusted EBITDA 2Q06: market and 2.8% of total market “Other Operating Expenses” – Liability Expenses - FCESP: R$ • Reduction over 2Q05: • Reversal of contingency with an 60.6 million • Conclusion of Tariff Review Process 2003 impact of R$ 13.8 million in the result – RTE: R$ 82.2 million (additional revenue of R$ 106.9 million in • Reduction over 2Q05: decrease of 25.2% in – Provision - RTE: R$ 5.0 million 2Q05) energy purchased costs • Revenue’s reversal of R$ 35 million in • Change in the energy purchase mix, 2Q06 (devolution to tariff of the increase with higher volume acquired in in Pis/Cofins taxes applied to Initial Contracts) auctions 10
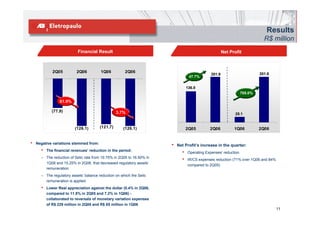
- 11. Results R$ million Financial Result Net Profit 2Q05 2Q06 1Q06 2Q06 201.9 201.9 47.7% 136.8 705.0% 61.9% (77.9) 3.7% 25.1 (126.1) (121.7) (126.1) 2Q05 2Q06 1Q06 2Q06 • Negative variations stemmed from: • Net Profit’s increase in the quarter: • The financial revenues’ reduction in the period: • Operating Expenses’ reduction – The reduction of Selic rate from 19.75% in 2Q05 to 16.50% in • IR/CS expenses reduction (71% over 1Q06 and 84% 1Q06 and 15.25% in 2Q06, that decreased regulatory assets’ compared to 2Q05) remuneration – The regulatory assets’ balance reduction on which the Selic remuneration is applied • Lower Real appreciation against the dollar (0.4% in 2Q06, compared to 11.8% in 2Q05 and 7.2% in 1Q06) - collaborated to reversals of monetary variation expenses of R$ 229 million in 2Q05 and R$ 85 million in 1Q06 11
- 12. Consolidated Debt R$ million Short Term X Long Term Creditors X Indexes – 2Q06 -11.9% -3.5% 5,256 4,828 4,877 4,774 4,411 4,877 Gross Debt – R$ 4, 877 million 4,256 4,256 73% 77% 76% 77% IGP-DI 45.05% Fixed Rate 11.22% 27% 23% 24% 23% 2Q05 2Q06 1Q06 2Q06 LT ST Net Debt Libor CDI/Selic 3.33% Amortization Schedule - Current 40.26% Others/R$ 0.13% • Pension Fund - R$ 2,196 million • Private Creditors - R$ 2,127 million • BNDES - R$ 554 million 12 * Exchange Rate Conversion on 06/30/2006 - US$ 1.00 = R$ 2.1643
- 13. Consolidated Debt R$ million Interest rates evolution Average Cost and Average Life CDI + 6.84% 112.0% -17.4% % 3.81 3.9 -1.6% -1.4% % CDI + CDI + 100.8% 100.4% 2.90% 2.50% CDI + 1.82% 2.05 Bonds 8th Debenture 9th Debenture CCB 2Q05 1Q06 2Q06 Avg cost - %CDI Avg Life - years Indebtedness Highlights – last 12 months Rating S&P • Gross Debt: reduction of 7% (R$ 380 million) National Scale BBB+ • Net Debt: reduction of 12% (R$ 572 million) ‘06 BBB B+ • Foreign Currency: reduced from 12% to 3% of total ‘05 BB • Hedge: 79% of foreign currency debt B+ ‘04 DDD • Borrowing of R$ 300 million of CCB’s - amortization of B- remaining balance of renegotiated debt (R$ 235 million) ‘03 D International Scale and liquidation of its swaps 13
- 14. Cash Flow Eletropaulo - Consolidated Cash Flow (Million) 1Q06 2Q06 1H06 Initial Cash 492 356 492 Operating cash generation 687 653 1,340 Investments (101) (88) (189) Net Financial Expenses (196) (85) (281) Net Amortization (245) (45) (290) Pension Fund Expenses (134) (108) (242) Income Tax (147) (67) (214) Free Cash (136) 261 125 Final Cash 356 617 617 14
- 15. Conclusion • Net profit of R$ 227.0 million in 1H06, representing an increase of R$ 107.0 million compared to 1H05 net profit • Adjusted EBITDA of R$ 1,253.5 million, 17.2% higher than 1H05’ figure • Debt evolution in the last 12 months: • Reduction of 11.9% of consolidated net debt • Reduction of 10.3% of average cost • Increase of average life from 2 to 4 years • Foreign currency debt reduced from 12.2% to 3.3% • Conclusion of the pre-payment of March 2004 renegotiated debt • Operating Highlights in the last 12 months: • Loss reduction of 9.0% • Collection rate increased 1.4% • Corporate Governance Differentiated Standards: • Creation of new class B of preferred shares with 100% of tag along and convertibility ratio of 1:1 for current preferred shareholders 15
- 16. 16
- 17. Highlights 1H06 • Starting in Jan/06, 100% of assured energy is sold through the bilateral contract with Eletropaulo 1Q06 • EBITDA = R$ 274 million • Net Income = R$ 153 million • Best Public Utility in 2005 according to Exame Magazine’s Melhores e Maiores Ranking • Best Public Held Company in 2005 according to the Platinum 2Q06 List of the Forbes Brasil • EBITDA: R$ 269 million in the 2Q06 and R$ 543 million in the 1H06 • Net Income: R$ 153 million in the 2Q06 and R$ 306 million in the 1H06 • Readjustment of the price of the bilateral contract with Eletropaulo in 0.9% Subsequent Events • Reversal of the allowance recorded related to penalties determined by CCEE in November and December/05 (R$ 3.9 million) 17
- 18. Energy Balance– 1H06 Energy Generated x Billed Energy in GWh Caconde 2.9% 197.2 Euclides 4.0% 267.8 Limoeiro 1.1% 77.4 Água Vermelha 57.7% 82.3% Eletropaulo - Bilateral 3,891.2 5,557.0 Barra Bonita 4.4% TOTAL BILLED 299.5 Bariri 4.5% 6,748.9 6,748.9 301.0 17.7% MRE/CCEE* Ibitinga 5.4% 1,191.9 366.1 Promissão 8.5% 573.0 Nova Avanhandava 11.2% 757.6 Mogi Guaçu 0.3% 18.2 *After deducing own consumption and transmission losses, the difference is addressed to the Energy Reallocation Mechanism – MRE and to the Chamber of Energy Marketing – CCEE. 18 .
- 19. Generation and Reliability AES Tietê’s assured energy is 1,275 MW average Plant Period Without Accidents –Years 1H06: generation was 22% over the assured energy. Ibitinga 18.0 During the last 20 years, AES Tietê has generated an Mogi-Guaçu 11.4 average of 18% above the assured energy Nova Avanhandava 8.5 Failure Index (FI) and Equivalent Availability Factor Água Vermelha 7.9 (EAF) figures exceed the requirements established by Limoeiro 5.9 Barra Bonita 5.8 the National Eclectic Energy Agency - ANEEL: 2.9% for Promissão 4.3 (FI) and 92.8% for EAF. Caconde 3.2 Average of 6.8 years of operations without accidents Euclides da Cunha 2.9 requiring the removal of personnel from the worksite Bariri 0.5 Generation Failure Index x Availability 123% 120% 123% 117% 122% 115% 109% 107% 98% 97.2% 96.8% 96.1% 94.2% 81% 90.9% 92.6% 95.7% 3.0% 1,617 1,619 1,581 1,554 2.8% 1,502 1,392 1,363 1,467 2.5% 1,258 2.2% 2.3% 2.2% 1,040 1.6% 1997 1998 1999 2000 2001 2002 2003 2004 2005 1S06 2000 2001 2002 2003 2004 2005 1S06* Generation - MW Average Generation / Assured Energy Failure Index Equivalent Availability Factor 19 *Annualized
- 20. Bilateral Contract • Initial Contracts ended December 31, 2005 • Starting in January 2006, 1.268 MW (100% assured energy) is sold through the bilateral contract with Eletropaulo Price readjusted by the IGP-M variation in July Current Price = R$ 133.87 / MWh, readjusted in 0.86% in July 2006 Maturity: December 2015 Collateral: receivables Average Revenue – R$/ MWh 133.9 119.6 94.4 73.6 54.0 48.8 45.9 2000 2001 2002 2003 2004 2005 Bilateral Contract 20
- 21. Operational Provision PIS and Cofins • In June 2006, Aneel published Technical Note, reaffirming its understanding of the PIS / Cofins taxation rules and determined that the amounts paid in excess due to the application of non-cumulative taxation rules to the initial contracts should be returned. • AES Tietê took the following measures: Made a formal inquiry to the Secretariat of the Federal Tax Office to confirm the taxation rules applicable to the Company; Initiated administrative proceedings at Aneel, requesting that the reimbursements to the distribution companies be suspended until the Company has obtained a reply to its inquiry from the Secretariat of the Federal Tax Office; Requested court injunctions to suspend the effect of Aneel’s resolutions concerning the reimbursement until the Secretariat of the Federal Tax Office has produced a reply to the inquiry made by AES Tietê Registered an allowance of the amount to be reimbursed to the distribution companies as corresponding tax credit is still a matter of controversy (R$ 15,3 million) RTE • Provision referring to the monetary correction of the balance of the credits to receive from energy distributors regarding the RTE (R$ 9.7 million, in the 1H06) 21
- 22. Results R$ million Net Revenue Costs and Operational Expenses 190 34% 30% 698 142 54 538 25 40 96 16 25 59% 22 30% 349 24 61 37 20 268 26 19 12 11 17 14 36 49 17 24 1H05 1H06 2Q05 2Q06 1H05 1H06 2Q05 2Q06 Power Purchase Royalties Operational Expenses Provisions Others • Increase in the volume of energy sold through the • Power Purchase - Transmission fees - increase in bilateral contract – 100% of assured energy since volume of sales through bilateral contract January / 2006 • Provisions – R$ 25.0 million in the 1H06 related to • Price readjustment occurred in July 2005: from monetary correction of RTE (R$ 9.7 million) and R$ 117.59/MWh to R$ 132.73/MWh allowance for PIS / Cofins levied on the initial contracts (R$ 15.3 million) 22
- 23. Results R$ million EBITDA Financial Results Net Income 83.4% 1H05 1H06 2Q05 2Q06 79.5% 77.7% 77.1% 43.8% 42.3% 43.8% 39.1% 543 306 427 27% (24) 210 45% (34) 269 35% 153 223 20% (47) 30% 113 37% (75) 1H05 1H06 2Q05 2Q06 1H05 1H06 2Q05 2Q06 • Increase in volume of energy • Increase in financial income: • Increase in volume of energy sold through the bilateral more funds invested in securities sold through the bilateral contract contract • Decrease in financial expenses in • Decrease in EBITDA margin due 1H06: reduction in the IGP-M, • Improvement in the financial to the increase in the from 1.8% in the 1H05 to 1.4% results operational provisions 1H06 23
- 24. Debt Cash availability = R$ 776.7 million (jun06) Amount - Creditor Maturity Terms Collateral R$ million Eletrobras 1,405.8 May-13 IGP-M + 10% p.y. Receivables FunCesp III 20.4 Nov-17 IGP-DI + 6% p.y. Receivables Net Debt – R$ billion Breakdown of Financial Investments 3.2x 3.3x Prived Bonds 3.0x 2.0x (A3) 1.4x Foreign Bonds 1% 1.4 1.1x - US$ - (Aa1) 0.7x 1.3 0.6x 5% 1.1 1.1 Foreign Bonds 1.1 - US$ - (Aa3) 0.9 6% 0.7 0.6 Federal T Bonds (Ba3) 88% 2000 2001 2002 2003 2004 2005 1H05 1H06 Net Debt (R$ m illion) Net Debt / EBITDA 24
- 25. CAPEX Increase Capacity Requirement: waiting decision of ANEEL and São Paulo State Government Capex – 1H06: R$ 11.1 million: Bariri: re-equipping and modernization of the Generating Unit 2 Reforestation Reducing the expected capital expenditure for 2006: R$ 43.7 million Capex – R$ million Capex – 1H06 43.7 7% 37.5 25% 30.5 27.5 21.9 17.7 12.4 11.1 68% 2000 2001 2002 2003 2004 2005 1S06 2006 Revised Equipment Environmental Others 25
- 26. Dividend Dividend Payment: Payout of 100% of the net income reported in the 1H6: R$ 305.5 million R$ 3.06 for 1,000 common shares R$ 3.36 for 1,000 non voting shares Payment in August 29, 2006 Pay-out Ratio Dividend Yield 11.8% 1S06* 1S06 305.5 million 100.0% 12.4% 13.6% 2005 2005 538.9 million 96.9% 14.1% 12.3% 2004 13.4% 2004 276.9 million 95.0% 6.6% 2003 11.4% 2003 185.6 million 95.0% Votting Non Votting * annualized 26
- 27. Conclusion Generation was 22% higher than assured energy; Operational Excellence: FR and EAF above ANEEL requirements; Assured energy completely sold in the long term; EBITDA of R$ 542.5 million in 1H06 – increase of 26.9% compared with the same period of 2005; Net Income of R$ 305.5 million in the 1H06, 45.2% higher than the 1H05 – net margin of 43.8% in the semester. 27