Apre 4 t04
- 1. Results of 2004 March 3rd, 2005
- 2. • Market • Operating Performance • Finance and Operating • Finance Performance Performance • Debt Profile Conclusion
- 4. Consumers’ Market Share - Eletropaulo consumption 2003 - GWh 2004 - GWh 10,6% 10,1% 32,7% 34,5% Residential 28,0% 28,9% Industrial Commercial Others 28,7% 26,5% 2003 2004 7,8% 8,0% revenue 40,4% 41,1% 29,9% Residential Industrial 30,3% Commercial Others 21,6% 20,8%
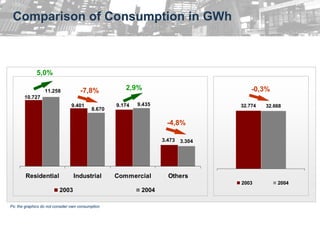
- 5. Comparison of Consumption in GWh 5,0% 11.258 -7,8% 2,9% -0,3% 10.727 9.401 9.174 9.435 32.774 32.668 8.670 -4,8% 3.473 3.304 Residential Industrial Commercial Others 2003 2004 2003 2004 Ps: the graphics do not consider own consumption
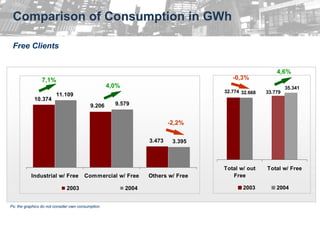
- 6. Comparison of Consumption in GWh Free Clients 4,6% 7,1% -0,3% 4,0% 35.341 32.774 32.668 33.779 11.109 10.374 9.206 9.579 -2,2% 3.473 3.395 Total w/ out Total w/ Free Industrial w/ Free Commercial w/ Free Others w/ Free Free 2003 2004 2003 2004 Ps: the graphics do not consider own consumption
- 7. Retention of Potentially Free Consumers • Intensification of visits to consumers Actual Situation • Value adding to the captive supply through: % Total load of the Jan-Dec 2004 concession area in 2004 • The selling of “Interruptive (35, 341 GWh) Energy” Migration of 44 4,0% • Payments of Bills with Credits of Consumers ICMS (Merchandise and Service 40 Circulation Tax) Consumers renewed 4,1% contracts • Energy Efficiency Projects Total of 68 • Benefit Plans (Load Management 8,7% Free Clients and Preventive Maintenance)
- 8. Results – 2004 R$ Million 2003 2004 The average rate adjustment of 17.9% on July 4, further increased by 0.7% on September 21, 2004 Deferred increases in PIS/Cofins taxes with an Net Revenue 6,431.9 7,394.1 15.0% impact of R$ 154.2 million on the operating result o 9.8% increase on expenses with electric energy purchased and 42.4% increase on transmission Operating Expenses (5,636.7) (6,391.3) 13.4% charges Increase of 24.1% and 200.3% on CCC and CDE expense, respectively: Stipulated quotas start of the amortization of the regulatory asset EBITDA * 1,059.8 1,271.5 20.0% Increase in operating revenues, although partially offset by increases in operating expenses R$ 546.8 million loss on income from Foreign Financial Revenue 23.8 (453.1) N.M. Currency Monetary Variation, due to the lower rate (Expenses)** of appreciation of the Real against the US dollar in 2004 In dec/03, 7.5% of the debts were “hedged”, versus 100% in dec/04 In dec/03, 38% of the debts were denominated in Extraordinary Items Net (345.9) (341.0) -1.4% US$, versus 17% in 2004 of Tax Effects Negative Adjustments of R$ 207.7 million on hedge contracts Net Profit (Loss) 86.3 5.6 -93.5% Increase on operating expenses Financial expense (*) Without adjustments (**) Consolidated Result Values
- 9. Results – 4Q 04 x 3Q 04 R$ Million 3Q 04 4Q 04 2.3% growth in billed consumption 14.6% increase on deductions from the operating revenues, due to the stronger impact on the deferral Net Revenue 2,050.3 2,050.3 0.0% of the PIS/Cofins increases in the 3Q04, of R$ 117.7 million, compared to an impact of R$ 36.5 million in the 4Q04 Increase in operating expenses (2.4%), personnel Operating Expenses (1,735.3) (1,788.4) 3.1% expenses (31.2%) and materials and third parties services (47.9%) EBITDA * 382.2 329.6 -13.8% Increase in operating expenses Financial Revenue** (186.9) (23.2) -87.6% 198.6% increase of financial income, due to the Expense negative impacts occurred in 3Q04: Signing of the SP municipality agreement, that generated a reversion of R$ 62.3 million on the Extraordinary Items (85.0) (85.1) 0.1% monetary variation Reversion of fine provisions Net of Tax Effects Net Profit (Loss) (6.4) 17.5 N.M Reduction of Financial expenses (*) Without adjustments (**) Consolidated Result Values
- 10. Adjusted EBITDA - R$ Million 2003 2004 R$ 1,059.8 EBITDA without R$ 1,271.5 EBITDA without adjustments adjustments R$ 284.2 RTE R$ 312.1 RTE R$ 81.7 Debt Confession IIa R$ 88.2 Debt Confession IIa R$ 46.4 Cetemeq Provision R$ 0.0 Cetemeq Provision R$ 1,472.1 Adjusted EBITDA R$ 1,671.9 Adjusted EBITDA 13.6% Increase
- 11. Adjusted EBITDA - R$ Million 3rd Quarter 2004 4th Quarter 2004 R$ 382.2 EBITDA without R$ 329.6 EBITDA without adjustments adjustments R$ 82.9 RTE R$ 86.2 RTE R$ 23.9 Debt Confession IIa R$ 21.5 Debt Confession IIa R$ 489.0 Adjusted EBITDA R$ 437.3 Adjusted EBITDA 10.6% Decrease
- 12. Investments’ Trend - R$ million 400 - 450 2004 Investments Customer Service and 125 System Expansion 33 Maintenance 33 Losses Recovery 8 32 Personnel 78 Others 54 297 Total 297 186 Self-Paid 33 Total Recorded 330 2003 2004 2005 (e) Capex Self-Paid
- 13. Losses - 4% • Intensification of loss recovery 12,84 plan: 12,34 • Regularization of 18 thousand illegal connections • 320 inspection teams 7,2 • Advertisement Campaigns to teach 6,7 citizens about fraud problems: • Energy theft is crime - association with police • Dishonest concealment - association with finance secretary 5,6 5,6 • Distresses the society, through increases on the tariff – lack of return on part of the investments 2003 2004 Technical Losses(1) Commercial Losses(2) (1) Losses resulting from the company’s operations in the transmission and distribution systems. They occur due to the points of overload in the transmission and distribution lines. (2) Losses resulting from illegal connections, frauds and mistakes in the meter reading.
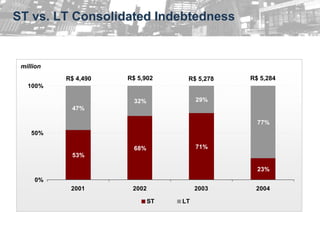
- 14. ST vs. LT Consolidated Indebtedness million R$ 4,490 R$ 5,902 R$ 5,278 R$ 5,284 100% 32% 29% 47% 77% 50% 68% 71% 53% 23% 0% 2001 2002 2003 2004 ST LT
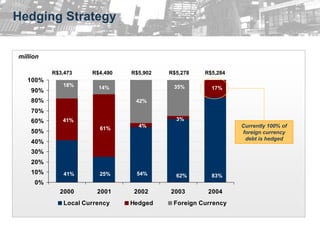
- 15. Hedging Strategy million R$3,473 R$4,490 R$5,902 R$5,278 R$5,284 100% 18% 14% 35% 17% 90% 80% 42% 70% 60% 41% 3% 61% 4% Currently 100% of 50% foreign currency debt is hedged 40% 30% 20% 10% 41% 25% 54% 62% 83% 0% 2000 2001 2002 2003 2004 Local Currency Hedged Foreign Currency
- 16. Amortization Schedule R$ million 149 41 78 24 40 101 79 83 45 52 611 45 144 24 126 149 24 18 34 78 83 18 121 51 40 116 33 112 42 107 299 80 225 227 230 246 222 224 226 251 225 227 231 16 16 166 167 196 143 130 107 82 80 77 1Q05 2Q05 3Q05 4Q05 1Q06 2Q06 3Q06 4Q06 1Q07 2Q07 3Q07 4Q07 1Q08 2Q08 3Q08 4Q08 1Q09 2Q09 3Q09 4Q09 Downpayment ** Capitalization Program*** R$ BNDES US$ * Amortization made on 01/12/05 with funds from the third tranche of the rationing loan * Exchange rate conversion on 12/30/2004 US$/R$=2.6544 ** “Capitalization Support to Electric Power Distribution Companies Program”, according to which Eletropaulo would be eligible to receive up to R$ 771 million
- 17. Corporate Governance • In Dec. 13, 2004 AES Eletropaulo took the commitment to have closer relations with its various publics, including shareholders and the capital markets • By the time a company adheres to Bovespa Level II, it is certified with a Corporative Governance Seal which promotes: • A higher commitment of the Company with their stockholders (minority and controllers) • Higher transparency on the information given to the Capital Markets • 25% Free Float of total shares • Maintenance of a Fiscal Council • Higher rights to the preferred share holders
- 19. Tariff Adjustment The Initial Contracts are readjusted on a yearly basis according to the following formula as established in the concession contract: : Rate for Tariff Adjustment = VPA + VPB x IGP-M Revenue The Bilateral Contract is readjusted in July of each year according to the variation in the IGP-M index Tariff readjustment in 2004: % of Tariff after adjustment Company Month of Adjustment adjustment (R$ / MWh) Initial Contracts Bragantina February 7.17% 58.10 Nacional February 7.17% 61.76 CPFL April 6.30% 66.69 Average Tariff (4Q04): AES Eletropaulo July 7.14% 69.62 R$ 76.8 / MWh Elektro August 7.95% 58.59 Bandeirante Energia October 8.36% 71.75 Piratininga October 8.36% 71.75 Bilateral Contracts AES Eletropaulo July 9.61% 117.59 19
- 20. Energy Balance - 2004 Caconde 282,182* CPFL Euclides Energy Generation x Billed Energy 1,134,791 565,161 in MWh Bandeirante Limoeiro 548,306 164,082 Eletropaulo - CI Água Vermelha 1,985,427 6,525,785 Barra Bonita Elektro TOTAL BILLED 920,384 566,091 Bariri 11,942,972 11,162,711 Bragantina 646,416 239,566 Ibitinga 718,722 Promissão = Nacional 155,728 1,056,810 Piratininga Nova Avanhandava MRE 559,739 1,385,178 Eletropaulo - Bilateral Mogi Guaçu Total energy production was 6.7% 5,618,771 32,545 over assured Caconde plant didn't generate energy during the 3rd Quarter because of it's maintenance program. **After deducing own consumption and transmission losses, the difference is addressed to the Energy Reallocation Market - MRE 20
- 21. Stored Energy Southeast Reservoirs 90 % of Max. Stored Energy 70 50 30 10 Jan Feb Mar Apr May Jun Jul Aug Sep Oct Nov Dec 2000 2001 2002 2003 2004 Source: Operador Nacional do Sistema – ONS; December/04 21
- 22. Income Statement – 4Q04 4Q03 4Q04 Tariff readjustment and the transfer of R$ million 25% of energy from initial contracts to bilateral contract Net Revenues 21.3 239.8 10% Impacted by the increase in PIS and Cofins rates Operational expenses increased less Costs (64.3) (66.2) 3% than inflation Higher EBITDA due to better Ebitda 169.0 189.5 12% operational performance Financial Income (50.2) (72.2) 44% Higher IGP-M index, 1.5 % in 4Q03 to (Expenses) 2.0% in 4Q04 Financial expenses of R$ 15 million do to investments in Banco Santos Income Before Taxes 78.9 101.5 and Participations Increase due to better operational performance Net Income 67.9 81.6 20% 22
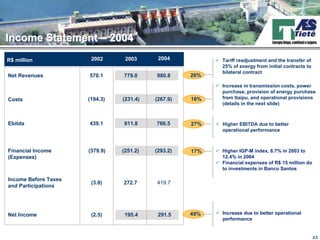
- 23. Income Statement – 2004 R$ million 2002 2003 2004 Tariff readjustment and the transfer of 25% of energy from initial contracts to bilateral contract Net Revenues 570.1 779.0 980.8 26% Increase in transmission costs, power purchase, provision of energy purchase Costs (194.3) (231.4) (267.9) 16% from Itaipu, and operational provisions (details in the next slide) Ebitda 439.1 611.8 766.5 27% Higher EBITDA due to better operational performance Financial Income (379.9) (251.2) (293.2) 17% Higher IGP-M index, 8.7% in 2003 to (Expenses) 12.4% in 2004 Financial expenses of R$ 15 million do to investments in Banco Santos Income Before Taxes (3.8) 272.7 419.7 and Participations Net Income (2.5) 195.4 291.5 49% Increase due to better operational performance 23
- 24. Costs and Operating Expenses em R$ milhões 2003 2004 Payroll 25.4 25.7 Biannual restoration of locks Environment consulting Outsourced Services 17.5 24.0 Maintenance of generation equipment Financial Compensation 32.4 35.5 for Use of Water Resources Connection fees Transmissions – increase due to higher volume of energy sold Electricity Distribution 34.2 41.7 under the bilateral contract Network Provision of cost of energy purchased from Itaipu Financial Exceeds – feb/04 (“Excedente Financeiro”) Power Purchased 23.8 36.1 Power purchase to replace energy from Itaipu Depreciation and Amortiz. 64.2 63.6 Regulatory fees Insurances Others 34.0 41.3 Waterway R&D Total 231.4 267.9 Operational provisions 24
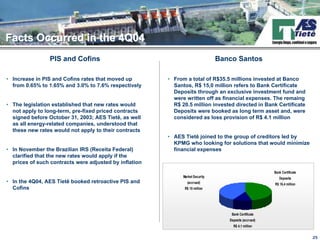
- 25. Facts Occurred in the 4Q04 PIS and Cofins Banco Santos • Increase in PIS and Cofins rates that moved up • From a total of R$35.5 millions invested at Banco from 0.65% to 1.65% and 3.0% to 7.6% respectively Santos, R$ 15,0 million refers to Bank Certificate Deposits through an exclusive investment fund and were written off as financial expenses. The remaing • The legislation established that new rates would R$ 20.5 million invested directed in Bank Certificate not apply to long-term, pre-fixed priced contracts Deposits were booked as long term asset and, were signed before October 31, 2003; AES Tietê, as well considered as loss provision of R$ 4.1 million as all energy-related companies, understood that these new rates would not apply to their contracts • AES Tietê joined to the group of creditors led by KPMG who looking for solutions that would minimize • In November the Brazilian IRS (Receita Federal) financial expenses clarified that the new rates would apply if the prices of such contracts were adjusted by inflation Bank Certificate Market Security Deposits • In the 4Q04, AES Tietê booked retroactive PIS and (accrued) R$ 16,4 million Cofins R$ 15 million Bank Certificate Deposits (accrued) R$ 4,1 million 25
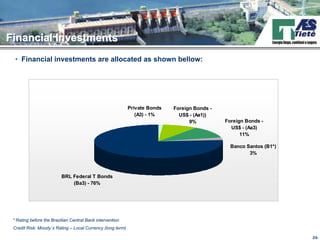
- 26. Financial Investments • Financial investments are allocated as shown bellow: Private Bonds Foreign Bonds - (A3) - 1% US$ - (Aa1)) 9% Foreign Bonds - US$ - (Aa3) 11% Banco Santos (B1*) 3% BRL Federal T Bonds (Ba3) - 76% * Rating before the Brazilian Central Bank intervention Credit Risk: Moody´s Rating – Local Currency (long term) 26
- 27. Capital Expeditures • Capex in 2004, amounted R$ 21.9 million*, mostly in modernization and maintenance of equipment 2003 – R$12.4 million 2004 – R$21.9 million 19% 11% 28% 20% 41% 20% 6% 27% 18% 10% Equipment Telemetry Waterway Environmental Others * Consolidated 27
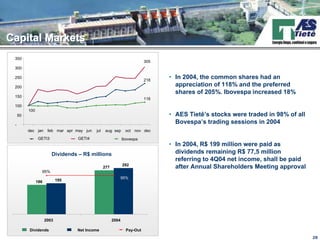
- 28. Capital Markets 350 305 300 250 218 • In 2004, the common shares had an 200 appreciation of 118% and the preferred shares of 205%. Ibovespa increased 18% 150 118 100 100 50 • AES Tietê’s stocks were traded in 98% of all - Bovespa’s trading sessions in 2004 dec jan feb mar apr may jun jul aug sep oct nov dec GETI3 GETI4 Ibovespa • In 2004, R$ 199 million were paid as Dividends – R$ millions dividends remaining R$ 77,5 million referring to 4Q04 net income, shall be paid 292 277 after Annual Shareholders Meeting approval 95% 95% 186 195 2003 2004 Dividends Net Income Pay-Out 28
- 29. Conclusion • Eletropaulo’s R$ 5.6 million net profits in • Net income for 2004 was R$ 291.5 million and 2004 offset the R$ 11.9 million loss net margin was 29,7% accumulated on the first nine months of the year • Net income, although impacted by higher • The 15% increase on net revenues and 20% financial expenses, increased 49% year over increase on EBITDA, reflect a strong cash year. generation capacity • The 0.3% reduction on the billed market, due to the loss of free clients, and the further • AES Tietê enforces its commitment to its decrease on revenues, is smoothened by shareholders and investor increasing, year by the billing of TUSD and by the proportional year, its operational performance on return the reduction on energy purchased investments made • The company has constantly sought operational and commercial excellence, in order to offer increasing quality in the service provided to customers
- 30. All statements contained in this declaration related to the outlook of the company’s business, projections of operational and financial results, and growth potential represent mere provisions and were based on management expectations in relation to the future of the company. These expectations are highly dependent on market changes, Brazil’s economic outcome, the energy sector, international markets, being thus subject to change Results of 2004 March 3rd, 2005


