Apre 4 t08
•
0 likes•310 views

This document summarizes the key financial and operational highlights for Eletropaulo in 2008. In 2008, Eletropaulo saw 3.9% growth in its captive market, an 8.3% increase in EBITDA to R$1,696 million, and a R$1,027 million net income, 44.1% above 2007. Electricity consumption grew 3.3% overall. Losses were reduced from 12% in 2005 to 11.6% in 2008 through inspections and regularization of illegal connections. Investments totaled R$457 million in 2008.
Report
Share


Apre 4 t08
- 2. Main highlights in 2008 ► 2008 – 3.9% growth of captive market – 8.3% increase on Ebitda, totalizing R$ 1,696 million – R$ 1,027 million Net Income, 44.1% above 2007 – + 8.01% average Tariff readjustment – Finsocial Final Decision generating R$ 299 million in tax credits – Proposal of R$ 69 million of interest on equity ► Subsequent Events – Agreement with the bankrupt entity of Banco Santos: Payment of R$ 151 million on January 09, with positive R$ 62 million impact. Accounting write-down moment in analysis. – Agreement with the São Paulo Municipality in the amounting to R$ 344 million, to be paid in four annual installments beginning in July 09. The fulfillment of the agreement is bound to the realization of investments by of São Paulo by Eletropaulo, totaling R $ 172 million – Dividends’ payment proposal of R$ 615 million in complimentary dividends, to be subjected to the Annual Shareholders Agreement: • R$ 3.46 per Common share and R$ 3.81 per Preferred share 2
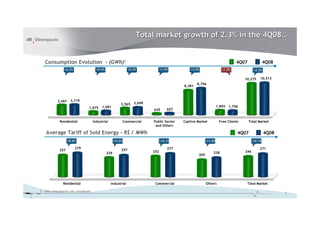
- 3. Total market growth of 2.3% in the 4Q08… Consumption Evolution - (GWh)1 4Q07 4Q08 +6.3% +0.4% +5.2% +1.9% +4.5% -7.2% +2.3% 10,275 10,513 8,756 8,381 3,497 3,719 2,565 2,698 1,675 1,681 1,894 1,758 645 657 Residential Industrial Commercial Public Sector Captive Market Free Clients Total Market and Others Average Tariff of Sold Energy – R$ / MWh 4Q07 4Q08 +8.6% +12.6% +10.1% +11.0% +10.1% 279 277 271 257 257 246 229 252 228 205 Residential Industrial Commercial Others Total Market 1 - Own consumption not considered 3
- 4. ... and 3.3% annual growth Consumption Evolution - (GWh)1 2007 2008 +6.9% +1.3% +2.3% +1.7% +3.9% +0.4% +3.3% 39,932 41,243 32,577 33,860 13,500 14,427 10,072 10,301 6,475 6,559 7,355 7,383 2,530 2,573 Residential Industrial Commercial Public Sector Captive Market Free Clients Total Market and Others Average Tariff of Sold Energy – R$ / MWh 2007 2008 -5.0% +0.2% -2.7% -3.2% -3.1% 284 270 275 267 269 261 247 247 224 217 Residential Industrial Commercial Others Total Market 1 - Own consumption not considered 4
- 5. Stabilization of new billing system CCS over 2008 Collection Rate – % over Gross Revenue -1.2 pp +1.2 pp 99.0 99.1 99.5 98.6 97.8 97.4 2005 2006 2007 2008 3Q08 4Q08 ► Cuts and Reconnection – Monthly Average (2007 X 2008) ► Bad debtor list – Cuts: reduction from 112 thousand to 51 thousand – 2nd Semester 2007: 115 thousand – Reconnection: reduction from 71 thousand to 36 thousand – 1st Semester 2008: 93 thousand – 2nd Semester 2008: 443 thousand ► Cuts and Reconnection – Monthly Average (3Q08 X 4Q08) – Cuts: increase from 34 thousand to 55 thousand – Reconnection: increase from 33 thousand to 46 thousand 5
- 6. Electric losses Loss Reduction – % -1.3 pp 12.9 12.0 11.5 11.6 6.4 5.5 5.0 5.1 Commercial Losses 6.5 6.5 6.5 6.5 Technical Losses1 2005 2006 2007 2008 ► Fraud and Illegal Connections (2008) – 435 thousand inspections and 58 thousand frauds detected – 75 thousand illegal connections regularized 1 - Current Technical Losses used retroactively as reference 6
- 7. Best FEC of AES Eletropaulo history DEC1 and FEC2 12.57 12.79 12.38 11.81 11.34 10.92 8.95 8.68 8.66 8.61 8.49 8.41 8.94 9.08 8.90 9.20 8.21 7.87 6.91 6.83 6.41 5.52 5.64 5.20 2003 2004 2005 2006 2007 2008 DEC (hours) FEC (times) DEC Aneel Standard FEC Aneel Standard 1 – Duration of Interruptions 2 – Frequency of Interruptions Source: Aneel and Eletropaulo 7
- 8. Investments of R$ 457 million in 2008 Investments – R$ million Investments 2008 Customer financed 562 10% Capex 80 12% 457 433 45% 404 5% 47 378 69 49 10% 77 18% 482 410 355 364 301 Customer Service and Maintenance System Expansion Customer Financed IT Loss Recovery Others 2005 2006 2007 2008 2009e 8
- 9. 3.9% growth of revenue Gross Revenue - R$ million +3.9% 11,306 11,751 Deductions from Gross Revenue Net Revenue 4,113 4,221 +9.8% 2,843 3,121 +4.7% 7,530 1,011 1,131 7,193 +8.6% 1,832 1,990 2007 2008 4Q07 4Q08 ► 3.9% growth on captive market during 2008 ► 4.5% growth on captive market comparing the 4Q08 x 4Q07 ► Positive effect of R$ 201 million in the 4Q07 due to energia livre write-off 9
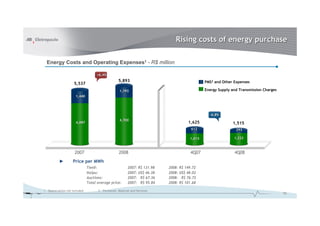
- 10. Rising costs of energy purchase Energy Costs and Operating Expenses1 - R$ million +6.4% 5,893 PMS2 and Other Expenses 5,537 1,193 Energy Supply and Transmission Charges 1,440 -6.8% 4,700 4,097 1,625 1,515 612 293 1,013 1,222 2007 2008 4Q07 4Q08 ► Price per MWh Tietê: 2007: R$ 131.98 2008: R$ 149.72 Itaipu: 2007: US$ 46.38 2008: US$ 48.02 Auctions: 2007: R$ 67.36 2008: R$ 76.72 Total average price: 2007: R$ 95.84 2008: R$ 101.68 1 - Depreciation not included 2 - Personnel, Material and Services 10
- 11. Better performance of operating expenses Accumulated 12 Months – R$ million 4Q08 – R$ million -17.1% 1,440 (158) 93 (160) (22) 1,193 -52.1% 612 (98) (11) (160) (50) 293 2007 Provisions and ADA1 and RTE and Others 2 2008 4Q07 Provisions and ADA1 and RTE and Others 2 4Q08 Contingencies Write-Off Energia Livre Contingencies Write-Off Energia Livre 1 - Allowance for doubtful accounts 2 - Personnel, Material, Third Party Services, FCESP, Leasing and Rents, Indemnifications, Losses, Publicity, Banking Fees, IPTU among others 11
- 12. Recovery of Finsocial in 2008 Other Revenues and Expenses – R$ million 80 60 ► Finsocial (R$ million) Other Revenues 89 Financial Revenue 210 Total 299 (61) (91) 2007 2008 4Q07 4Q08 ► The other expenses and revenues now affect the operational result ► R$ 89 million recorded in 4Q08, referring to Finsocial tax credits ► R$ 44 million in 4Q07, related to substation automation system assets write-off 12
- 13. 8.3% annual growth of Ebitda 12 Months Accumulated – R$ million 4Q08 – R$ million 538 (435) +8.3% 89 (51) (169) 158 Ebitda +280.4% 1,566 1,696 358 (209) 73 89 97 555 146 2007 Net Energy PIS/ Provisions FINSOCIAL Others 2008 4Q07 Net Energy Provisions FINSOCIAL Others 4Q08 Revenue Supply and COFINS ¹ And Revenue Supply and And Transmission Conting. Transmission Conting. Charges Charges 1 – Change on PIS/ COFINS taxation system with Tietê on June, 2007 13
- 14. Improvement of financial result Financial Result – R$ million 231 129 ► Finsocial (R$ million) Other Revenues R$ 89 Financial Revenue R$ 210 Total R$ 299 (104) (145) 2007 2008 4Q07 4Q08 ► R$ 210 million of Finsocial monetary adjustment ► R$ 191 million reversal of Cofins - calculation basis enlargement ► R$ 72 million provision of a penalty for the Cofins - taxation increase ► Reduction of 37.1% on financial expenses in 2008 14
- 15. Continuous net debt reduction Net Debt Average Cost and Average Term (Principal) 7.8 7.7 6.8 6.6 7.1 4.4x 2.1x 123.3% 125.3% 4.6 120.9% 1.3x 1.2x 107.8% 102.8% 3.7 3.0 2.5 2005 2006 2007 2008 4T07 1T08 2T08 3T08 4T08 Net Debt (R$ billion) Net Debt / Adjusted EBITDA1 CDI2 Average Term - Years 1 - Accumulated 12 Months Adjusted EBITDA 2 – Brazil’s Interbank Interest Rate 15
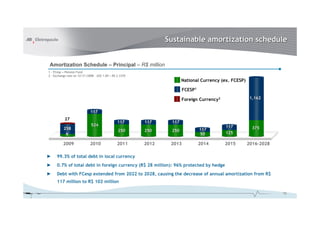
- 16. Sustainable amortization schedule Amortization Schedule – Principal – R$ million 1 - FCesp = Pension Fund 2 - Exchange rate on 12/31/2008 – US$ 1.00 = R$ 2.3370 National Currency (ex. FCESP) FCESP1 Foreign Currency2 1,162 117 27 117 117 117 524 117 258 117 375 250 250 250 9 50 125 2009 2010 2011 2012 2013 2014 2015 2016-2028 ► 99.3% of total debt in local currency ► 0.7% of total debt in foreign currency (R$ 28 million): 96% protected by hedge ► Debt with FCesp extended from 2022 to 2028, causing the decrease of annual amortization from R$ 117 million to R$ 102 million 16
- 17. More than R$ 1.5 billion in cash Managerial Cash Flow1 – R$ million 2007 1Q08 2Q08 3Q08 4Q08 2008 Initial Cash 1,166 1,334 1,478 1,454 1,373 1,334 Operating Cash Flow 2,488 418 497 613 491 2,019 Investments (407) (80) (60) (107) (126) (374) Net Financial Expenses (501) (101) (41) (107) (37) (285) Net Amortizations (182) (4) (30) (21) (40) (94) CESP Foundation (198) (57) (58) (32) (46) (192) Income Tax (418) (33) (114) (68) (80) (295) Dividends (615) (0) (218) (359) - (577) Free Cash Flow 168 144 (24) (81) 162 201 Final Cash 1,334 1,478 1,454 1,373 1,536 1,536 ► The Company keeps its cash invested on Certificates of Deposit (CDs) and Government Notes, with average profitability of 102.4% of CDI on 2008 ► Increase in annual average cash balance: – R$ 1,106 million in 2007 x R$ 1,411 million in 2008 17
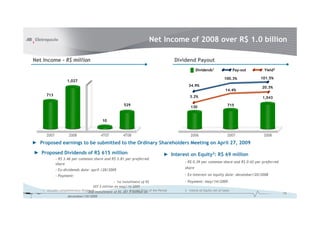
- 18. Net Income of 2008 over R$ 1.0 billion Net Income – R$ million Dividend Payout Dividends1 Pay-out Yield2 100.3% 101.5% 1,027 34.9% 20.3% 14.4% 713 3.2% 1,043 529 715 130 10 2007 2008 4T07 4T08 2006 2007 2008 ► Proposed earnings to be submitted to the Ordinary Shareholders Meeting on April 27, 2009 ► Proposed Dividends of R$ 615 million ► Interest on Equity2: R$ 69 million - R$ 3.46 per common share and R$ 3.81 per preferred - R$ 0.39 per common share and R$ 0.43 per preferred share share - Ex-dividends date: april /28/2009 - Payment: - Ex-interest on equity date: december/20/2008 - 1st installment of R$ - Payment: may/14/2009 307.5 million on may/14/2009 1 - Includes complementary dividends installment of R$ 307.5 million on of the Period - 2nd 2 – Average Price 3 – Interst on Equity net of taxes 18 december/10/2009
- 19. Corporate governance AES Eletropaulo X Ibovespa X IEE Daily Average Volume3 - R$ thousand 26,066 25,677 +247.2% 120 110 100 +80.0% 90 -11.6% 80 7,508 70 -29,9% 4,171 60 -41,2% 50 dez-071 fev-08 abr-08 jun-08 ago-08 out-08 dez-08 2005 2006 2007 2008 130 2009 125 120 18.1% 115 ELPL6 110 105 3.6% IEE 2.8% 100 IBOV 95 dez-082 jan-09 fev-09 mar-09 1 - Index –12/29/07 = 100 2- Index – 12/30/08 = 100 3 – Preferred shares Class B 19
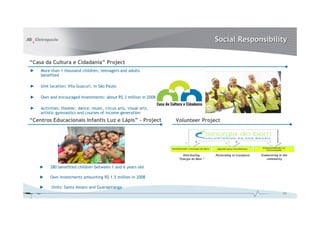
- 20. Social Responsibility “Casa da Cultura e Cidadania” Project ► More than 1 thousand children, teenagers and adults benefited ► Unit location: Vila Guacuri, in São Paulo ► Own and encouraged Investments: about R$ 3 million in 2008 ► Activities: theater, dance, music, circus arts, visual arts, artistic gymnastics and courses of income generation “Centros Educacionais Infantis Luz e Lápis” - Project Volunteer Project Distributing Performing to transform Endeavoring in the “Energia do Bem “ community ► 280 benefited children between 1 and 6 years old ► Own investments amounting R$ 1.5 million in 2008 ► Units: Santo Amaro and Guarapiranga 20
- 21. One more year of awards ► Maintenance on ISE (Sustainability Index) for 2009 (BM&FBovespa – Nov.08) ► National Quality Award, company recognized as a reference on global management (National Quality Foundation – Oct.08) – Finalist company category ► Value Creation Prize for Shareholders in the Sector, in the category Eletric Energy (Abrasca - Associação Brasileira das Companhias Abertas – Aug.08) ► Most acknowledged company on sustainability among companies from the public sector (Revista Imprensa – May.08) 21
- 22. 2008 Results The statements contained in this document with regard to the business prospects, projected operating and financial results, and growth potential are merely forecasts based on the expectations of the Company’s Management in relation to its future performance. Such estimates are highly dependent on market behavior and on the conditions affecting Brazil’s macroeconomic performance as well as the electric sector and international market, and they are therefore subject to changes.