Aquaculture an introduction
•Download as PPT, PDF•
60 likes•28,352 views

Aquaculture has been practiced for over 2500 years and originated in China, Egypt, India or other countries. It is defined as the production of fish through farming or rearing in confined waters. Major classifications of aquaculture include based on habitat, water flow, culture organism, culture method, culture system, and purpose. Trends in India include freshwater aquaculture of crustaceans, fish, and ornamental fish as well as saltwater aquaculture of shrimp and crabs. Global fish consumption has nearly doubled in the last 45 years from 9.01 kg/capita in 1961 to 17.1 kg/capita in 2007, driven by population growth and preferences for fish as an affordable source of protein
Report
Share


Aquaculture an introduction
- 1. Aquaculture – An Overview Dr.J.Stephen Sampath Kumar, MFSc., PhDDr.J.Stephen Sampath Kumar, MFSc., PhD (Aqua)(Aqua) Professor (Aquaculture)Professor (Aquaculture) Fisheries College & Research InstituteFisheries College & Research Institute Tamil Nadu Veterinary and Animal Sciences UniversityTamil Nadu Veterinary and Animal Sciences University Tuticorin – 628008Tuticorin – 628008 E-mail:E-mail: jstephenkumar@gmail.comjstephenkumar@gmail.com ,, stephensskumar@rediffmail.comstephensskumar@rediffmail.com
- 2. Aquaculture – An Introduction • It is an ancient farming enterprise • Practised for more than 2500 years • It originated at….. – China? – Egypt? – India? – Any other country? Definition: It is the production of fish through farming or rearing in confined waters following prescribed procedures to yield higher returns in terms of numbers and weight through definite management practices and control over the stock
- 3. The development process • The ever first attempt was for hobby • Later the nutritional advantages were felt • Changed life style of human being • Population growth • Need for alternative food for man Reasons for development • Civilization - demanded more nutritious food • Agriculture – development of allied fields • Resources utilization • Health conscience and • Employment and earning
- 4. Major classification of aquaculture Based on the type of habitat (water) Freshwater aquaculture Saltwater aquaculture Brackish water aquaculture Wastewater aquaculture Based on the water flow characteristics Running water Standing water
- 5. Major classification of aquaculture, cont’d Based on the type of culture organism Fin fish culture Crustacean farming Molluscan farming Seaweed farming Live-feed culture Algal culture
- 6. Major classification of aquaculture, cont’d Based on the type of culture method Extensive Improved extensive Semi-intensive Intensive Super-intensive Four methods are found in India
- 7. Major classification of aquaculture, cont’d Based on the type of culture system 1. Pond culture 2. Tank culture 3. Open water culture –lakes and reservoirs 4. Race ways culture 5. Cage and pen culture 6. Recirculation system Based on the purpose of culture 1. Food fish culture 2. Recreation fish farming – aquarium 3. Bio-treatment or biological control
- 8. Major classification of aquaculture, cont’d Based on the region / geographical feature Warm water aquaculture Cold water aquaculture Sub-tropical aquaculture Heated water aquaculture Based on the people involved Low level / Marginal aquaculture Corporate / Entrepreneurial farming
- 9. Trends of aqua farming seen in India 1. Freshwater Aquaculture Crustaceans Fish Ornamental fish farming Algae/Spirulina
- 10. Aqua farming in India… Types 2. Salt water Aquaculture Shrimps Crabs Live food
- 11. 05/06/14 11 Recent trends and status ofRecent trends and status of freshwater fishculturefreshwater fishculture technology in Indiatechnology in India
- 12. 05/06/14 12 Facts about fisheries Fish has been a food for human beings for more than 4000 years About 20000 species are present More than 200 species have been consumed by man Many by-products from fishes and other aquatic organisms are used for medical purposes Average Indian consumption 5-6 kg/yr
- 13. 05/06/14 13 Indian freshwater fisheries Riverine fisheries Reservoir fisheries Tank based fisheries Canal based fisheries Other minor water bodies
- 14. 05/06/14 14 Technology scenario Ten standardised technology are available Suitable for rural as well as urban adoption Ensures food production and/or income Provides employment also
- 15. 05/06/14 15 Available technology Composite fishculture Polyculture Ornamental fish farming Freshwater crustacean farming Integrated farming Air-breathing fish farming Cage culture in reservoirs
- 16. 05/06/14 16 Available technology Cold water fishculture Wastewater aquaculture Freshwater pearl culture
- 17. 05/06/14 17 The production processes
- 18. 05/06/14 18 Composite fish culture Many species in one pond Utilization of all niches Developed form monoculture Six species combination - good Culture period 6 - 8 months Yield 5 - 10 tons/ha/crop Suitable for all areas Easy to do and assured production
- 19. 05/06/14 19 Polyculture Fishes and other organisms together Compatible animals in one pond More production Useful for all areas Production up to 5 tons of fishes and another 2 to 3 tons of other organisms
- 20. 05/06/14 20 Crustacean farming Macrobrachium spp in India for freshwater Shrimps for salt water Higher profit Technically challenging and assured profit
- 21. 05/06/14 21 Ornamental fish farming Ornamental fishes for hobby and pleasure – not for food Easy farming methods Simple to operate and manage Higher returns All areas, particularly urban areas
- 22. 05/06/14 22 Integrated farming Unified farming Combining other husbandry practices Higher combined yield Rural farming sector Cattle, ducks, poultry, goats, piggery etc
- 23. 05/06/14 23 Air-breathing fish culture Murrels, catfishes - breathe air Air breathing fishes are cultured Higher density stocking Higher market prices More profit at lesser cost of production
- 24. 05/06/14 24 Cold water fish culture Adopted in hill areas (Nilgiris,etc) Salmon, trout, etc.. Suitable species Less production Mainly as sport fishery Recreation purposes
- 25. 05/06/14 25 Cage culture in reservoirs Cages established in reservoirs Utilization of natural waters More per unit area production Less cost of production More production per unit area
- 26. 05/06/14 26 Wastewater aquaculture Utilisation of wastewater for profit Sewage fed fish culture Higher yield at lower cost Efficient resource utilisation
- 27. 05/06/14 27 Freshwater pearl culture In its infancy Success attained Commercial production to be started Promising technology
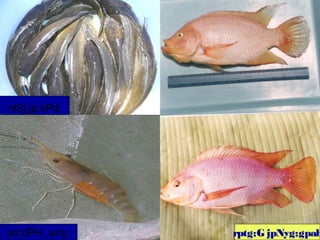
- 30. ed;dPH ,why; rptg;G jpNyg;gpah nfSj;jp kPd;
- 31. 05/06/14 31
- 32. 05/06/14 32
- 33. 05/06/14 33
- 34. Trends in fish consumption and its impact on the fish production
- 35. Introduction • Fish and fishery products are generally used for food and non-food purposes. • The non-food uses include, animal feed, industrial uses (confectioneries), etc. • Per capita supply of fish for human consumption is governed by three factors, viz., total production, imports and non-food uses. • Maldives per capita consumption was the highest in 2007 (144.1kg/yr) due to low human population.
- 36. Introduction • Japan’s per capita consumption is higher (56.1kg/yr) due to marginally higher production and imports • Fish continues to be the preferred protein for the human consumption around the world. • Cheap protein supplier next to eggs. • Designer meat qualities are possible through feed and breeding
- 37. Availability of fish and fishery products • Available in different forms – fresh, whole, piece, frozen, processed, dried, value added and cooked. • In all forms, perhaps the cost does not influence the preference. • Available at affordable cost for varied sections of people. • Available through capture from wild and culture in the captivity
- 39. Status of fish and fishery production • Oceans are continued to be the major source of fish and other aquatic animals for human consumption • Inland wild waters are although production points for aquatic animals, their share is meager. • People along the coasts have fish as their primary or only source of protein. • People in inland regions may have the fish as their secondary or subsequent choices
- 40. Factors influencing the consumption • Availability • Quality of the available material • Quantity of the available material thereby the price • Socio-economic status of the consumers • Health conscience (support / allergy) • Availability of substitutes • Sentimental or religious reasons (vegetarianism) • Regional preferences (geographic choices)
- 41. Trends in fish consumption • Near 100% increase over 4.5 decades (1962 – 2007) • Increasing rate: approximately 2.3% per year (non-cumulative) • Non-food uses also showed an upward trend (11.0 to 27.0 mt in 45 years) • While Mozambique had the lowest per capita supply (4.5 kg/yr) Maldives had the highest per capita consumption (140kg/yr) in 2007.
- 42. Trends in fish consumption • Fish’s contribution to the total protein supply varied from 2.6 to 40.4% among 66 countries • Non-food uses were the highest in China (6.8 mt) and lowest in many countries (near 0 in some countries like Cambodia, Ghana, etc). • Nearness to fish and traditional food habits are found to be the factors deciding the fish’s contribution to total protein intake in the country.
- 43. Population growth & food fish supply • World population in 1961 – 3072.7 million • Total fisheries production – 39.1 million tonnes • For food consumption -- 27.69 million tonnes • Per capita consumption -- 9.01 kg/ yr • World population in 2007 – 6670.8 million • Total fisheries production – 140.45 million tonnes • For food consumption -- 114.03 million tonnes • Per capita consumption -- 17.1 kg/ yr
Editor's Notes
- Mrigal
- Murrel
- Freshwater prawn