Audit and stat for medical professionals
•Download as PPTX, PDF•
2 likes•982 views

This document discusses clinical audit and statistics. It begins by defining audit and its importance in clinical practice. The document outlines the types of audit and how statistics are used in clinical practice. It discusses the components of a clinical audit and defines key statistical terms like population, sample, and descriptive statistics. The document provides examples to illustrate statistical concepts and calculations like descriptive statistics and the area under the curve of a normal distribution. It emphasizes that the goal of statistics is to summarize data in a way that is understandable for non-statisticians.
Report
Share


Audit and stat for medical professionals
- 1. •الرحيم الرحمن هللا بسم
- 2. CLINICAL AUDIT AND STATISTICS Dr. Nadir Mehmood
- 4. LEARNING OBJECTIVES At the end of this discussion, we all will be able to; 1. Define audit and its clinical importance 2. Enumerate the types of audit and use of statistics in clinical practice 3. Enumerate the components of clinical audit 4. Define statistics and distinguish between population and sample 5. Use real life examples to illustrate the goal of statistics 6. Define and calculate different descriptive statistics 7. Calculate AUC of a normal distribution
- 5. Insight “I shut my eyes in order to see” Paul Gaughuin (1848- 1903)
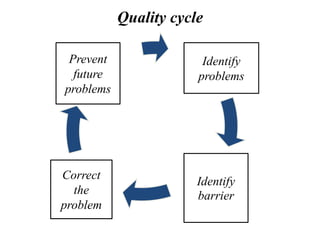
- 6. Audit 1. What is audit? 2. What is medical audit? 3. Why audit? 4. Audit versus research 5. The quality cycle 6. Use of statistics in medical audit
- 7. What is audit? Evaluation of data, documents and resources to check performance of systems meets specified standards. Audit in the wider sense is simply a tool to find out what you do now; this often to be compared with what you have done in the past, or what you think you may wish to do in the future.
- 8. What is medical audit “A quality improvement process that seeks to improve patient care and outcomes through systematic review of care against explicit criteria and the implementation of change.” (NICE guides) • An audit is a cyclical process -defining standards, - collecting data, - identifying areas for improvement, - making necessary changes - back round to defining new standards.
- 9. Why audit? • Maintain participant and staff safety. • Maintain data quality . • Protect reputation of staff, host and sponsorer • Protect current and future funding • Improve quality. • It does not involve experiments • It uses data that already exists
- 10. Audit:- are we doing the best thing in the best way? • Measures current practice against specific standards • Never experimental • Uses data in existence by virtue of practice • May require ethical approval • Aims to improve delivery of patient care
- 11. Research:- What is the best thing to do/the best way to do it • Provides sound basis for medical audit • Involves experimental trials • Uses detailed data collection • Needs ethical approval and registration • Aims to add to body of scientific knowledge
- 13. General Understanding • LETS DISCUSS THE FOLLOWING STATEMENTS • Audit usually consumes an extensive amount of resources (of time, money etc.). • Rare conditions should be audited. • The higher the amount of data the practitioner collects, the easier is the decision making process in audit. • The most challenging stage in Audit is implementing change. • The agreed standards can be reset at realistic percentages after the first round of data collection.
- 14. When to Use What Method When to use it Why Research Good practice is not defined and comparisons are needed To define good practice Data Collection or structured observation Practice patterns unknown To catalogue prevailing practice without making judgements Audit Good practice is defined but we want to know how much we are sticking to it To improve current performance
- 15. Does Audit Lead to Change • Hearnshaw et al, BJGP 1998 • Of 1257 audits • 80% on clinical care • 65% led to change
- 16. WHAT CLINICAL AUDIT IS NOT • Big brother • Threatening • A cost cutting exercise • Worthless and a waste of time
- 18. Nor is it… • Buying computers • Buying software • Having others put in all the data and you pushing the button • Extra work • Optional work We don’t need to do that I’m too busy If only we had that package Can’t you do it for me
- 19. Reactions to audit • Enthusiasm • Cynicism • Obligation • Doubt • Exhaustion
- 21. Why audit • Useful clinically • Encourages teamwork • Improves patient care • Financial benefits (sometimes!) • Becoming contractually an obligation with the arrival of legislation/projects(MSDS)
- 22. Continuous vs. Big Bang
- 23. Challenges • We use different languages • We have different purposes for doing an audit • We report differently • We need to recognise diversity • We have different expected outcomes
- 24. Don’t change for change’s sake DON’T RE-INVENT THE WHEEL
- 25. Clinical Audit Cycle 1. Select topic 7. Implement change 8. Re-audit 2. Agree standards of best practice 3. Define methodology 4. Pilot and data collection 5. Analysis and Reporting 6. Make recommendations Action Planning Audit
- 26. Do We need to do a complex statistical analysis?
- 27. Do I need to do a complex statistical analysis? • Generally no, unlike research, most audits will not require heavy number crunching • A simple graphical display is often the most effective method of sharing your data. • Don’t be tempted to overcomplicate things just because your computer will let you!
- 28. Conclusion- I •Topics of audit need to be chosen with care •Refined to make them suitable •ƒStandard setting requires clarity of thought & carefulƒdefinition •ƒData collection to observe practice can consume endless time and money •ƒLasting change is notoriously difficult to achieve
- 29. IF WE ALL DO A LITTLE WE CAN DO A LOT
- 30. Statistics • Statistics is the art/science of summarizing data • Better yet…summarizing data so that non-statisticians can understand it • Clinical investigations usually involve collecting a lot of data. • But, at the end of your trial, what you really want is a “punch-line:” – Did the new treatment work? – Are the two groups being compared the same or different? – Is the new method more precise than the old method? • Statistical inference is the answer!
- 31. Do you need a statistician as part of your clinical research team? • YES! • Simplest reasons: s/he will help to optimize – Design – Analysis – Interpretation of results – Conclusions
- 32. THERE ARE LIES, DAMN LIES AND STATISTICS. British Prime Minister Benjamin Disraeli Popularized by Mark Twain
- 33. Many studies have been done on misuse of statistics in medicine
- 34. “ It is easy to lie with statistics, but it is easier to lie without them” Frederick Mosteller
- 35. ANTECEDENT(A) BEHAVIOUR(B) CONSEQUENCE(C) POSSIBLE FUNCTION(attenti on, access to items/activities, escape, sensory Student (PG) in class room texting on cell Teacher says, “mr.x . Stop that” Attention ABC OF Behaviour
- 36. Basic Components of Research Starts with a hypothesis or “educated guess” –Not all hypotheses are testable. –Hypotheses in science are formulated so that they are testable.
- 37. Statistical versus Clinical Significance • Statistical methods – branch of mathematics – Helps to protect against biases in evaluating data • Statistical vs. clinical significance – Statistical significance – are results due to chance? – Clinical significance – are results clinically meaningful? – Statistical significance does not imply clinical meaningfulness
- 38. Statistical versus Clinical Significance • Balancing statistical versus clinical significance –Evaluate effect size –Evaluate social validity • Generalizability and the patient uniformity myth • The “average” client
- 39. Consider flipping a coin and recording the relative frequency of heads. When the number of coin flips is small, there is a lot of variability in the relative frequency of “heads” (as shown in this graph). What do you notice in the graph at the right?
- 40. Consider flipping a coin and recording the relative frequency of heads. The graph at the right shows the relative frequency when the coin is flipped a large number of times. What do you notice in this graph at the right?
- 41. Law of Large Numbers Notice how the relative frequency of heads approaches ½ the larger the number of trials!
- 42. Types of statistics / analyses DESCRIPTIVE STATISTICS Describing a phenomena Frequencies How many… Basic measurements Meters, seconds, cm3, IQ INFERENTIAL STATISTICS Inferences about phenomena Hypothesis Testing Proving or disproving theories Confidence Intervals If sample relates to the larger population Correlation Associations between phenomena Significance testing e.g diet and health
- 43. Statisticians Require Precise Statement of the Hypothesis • H0: There is no association between the exposure of interest and the outcome • H1: There is an association between the exposure and the outcome. – This association is not due to chance. – The direction of this association is not typically assumed.
- 44. Writing Hypotheses • Directional (H1) – Physical activity program will affect body composition such that physical activity individuals will lose more fat than sedentary individuals. • Null (HO) – Physical activity will not affect body composition. • Alternative – Physical activity will affect body composition.
- 45. descriptive statistics... …permit the researcher to describe many pieces of data with a few indices
- 46. Types of descriptive statistics… 1. graphs 2. measures of central tendency 3. measures of variability
- 47. 1.graphs... …representations of data enabling the researcher to see what the distribution of scores look like
- 48. measures of central tendency... …indices enabling the researcher to determine the typical or average score of a group of scores
- 49. 2. Measures of central tendency… mode median mean
- 50. mode... …the score attained by more participants than any other score
- 51. median... …the point in a distribution above and below which are 50% of the scores
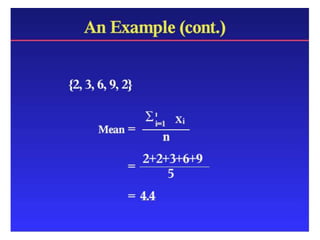
- 52. mean... …the arithmetic average of the scores
- 57. 57 Mean versus Median • Large sample values tend to inflate the mean. This will happen if the histogram of the data is right-skewed. • The median is not influenced by large sample values and is a better measure of centrality if the distribution is skewed. • Note if mean=median=mode then the data are said to be symmetrical
- 58. Distributions • Normal (symmetrical) Distribution (bell shaped)
- 70. • The larger the sample size the greater the power • The larger the effect size the greater the power • The larger the significance level the greater the power
- 71. What to do when you need more power • Increase sample size • Reduce number of variables • Show your data graphically
- 73. P Values and Statistical Significance • Based on notion that we can disprove, but not prove, things. • Therefore, we need something to disprove. • Let's assume the true effect is zero: the null hypothesis. • If the value of the observed effect is unlikely under this assumption, we reject (disprove) the null hypothesis. • "Unlikely" is related to (but not equal to) a probability or P value. • P < 0.05 is regarded as unlikely enough to reject the null hypothesis (i.e., to conclude the effect is not zero). – We say the effect is statistically significant at the 0.05 or 5% level. – Some folks also say "there is a real effect". • P > 0.05 means not enough evidence to reject the null. – We say the effect is statistically non-significant. – Some folks accept the null and say "there is no effect".
- 74. • Problems with this philosophy – We can disprove things only in pure mathematics, not in real life. – Failure to reject the null doesn't mean we have to accept the null. – In any case, true effects in real life are never zero. Never. – So, THE NULL HYPOTHESIS IS ALWAYS FALSE! – Therefore, to assume that effects are zero until disproved is illogical, and sometimes impractical or even unethical. – 0.05 is arbitrary. • The answer? We need better ways to represent the uncertainties of real life: – Better interpretation of the classical P value – More emphasis on (im)precision of estimation, through use of confidence limits for the true value – Better types of P value, representing probabilities of clinical or practical benefit and harm
- 76. True/ false… …a computer should not be used to perform an analysis that a researcher has never completed by hand or, at least, studied extensively
- 77. 77
- 79. Case Study General QUESTION: ANSWERS • HOW DO PEOPLE LET YOU KNOW THEY ARE AT YOUR DOOR AND WANT TO COME IN? • They ring the doorbell. • They knock. • They stand outside, studying kinetics, until you open the door for your own reasons. •
- 80. A Possible Investigation: Possible research questions Data Sources? – How do people knock on someone’s door? – How many times do they knock? – Do people speak when they knock? • Search literature and review/compile the results of previous studies on this subject • Survey people and ask them how they knock • Observe people as they knock and record data
- 81. Study 1: American Knocking Practices • Questions/Propositions – People generally approach a residence and knock when they wish to enter. – Describe how people knock when at someone’s door. • Method: – Review available data – Design survey, experiment, interviews or some combination. • Database: –Sample: http://www.youtube.com/watch?v=tKV4XYD3xK 4
- 82. Results: – Descriptive Statistics • Number of events observed (also known as “n” or sample size) was 35. • Sheldon knocked between 0 and 30,000 (self-reported) times when approaching Penny’s door. • He used 1, 2, 6 and 30,000 knocks each one time. (The “1” was the robot) • He knocked for Leonard, then Penny, 5 times, with one instance where he knocked for Penny first. • Penny knocked one time on Sheldon’s door, in this case she knocked three times. • In one instance, he knocked, then approached an interior door where he knocked a second time. – Parametric Statistics • The average number of knocks was 860.06 (mean) • The most common number of knocks was 3 (mode) • The median number of knocks was 3 (1, 2, 3, 6, 30000) • The standard deviation of the mean number of knocks was 4997.46
- 83. Results: – Without any other information, which of the following can we infer: • In this sample, three knocks were used to alert the resident that someone was at the door. • People in general knock three times. • Knocking three times is always effective in getting someone to answer the door. • Tony Orlando and Dawn ( http://www.youtube.com/watch?v=k7Jvsbcxunc ) were wrong in the 70’s when they concluded that: – You should knock three times on the ceiling… – You should knock twice on the pipe if the answer is no… • In our data, knocks were always associated with the calling out of a name and this process was repeated. • If someone is at your door and they knock three times, followed by your name three times, and this is repeated three times, it is likely to be Sheldon. • Sheldon has issues.
- 84. Let’s take one of these conclusions and explore it more thoroughly from a statistical perspective. • People in general knock 3 times. – How would our results have changed if we had seen only a subset of the data? (Smaller sample size…) For example what if we missed the “flash” – how would the results have changed? – The average number of knocks was 3 (mean) – The most common number of knocks was 3 (mode) – The median number of knocks was 3 (1, 2, 3, 6, 30000) – The standard deviation of the mean number of knocks was 0.641689
- 85. Direction for future research: • Good research always poses new questions. • Additional research questions for this example: – Is there a time when two knocks are sufficient? – Are mechanical/technological means of knocking just as effective as in person knocking? – How hard would it be to find a new apartment?