Location via proxy:   [ UP ]  
[Report a bug]   [Manage cookies]                
SlideShare a Scribd company logo
3Q08 Earnings Presentation
                s
                                         October 30, 2008


                         Speak
                             kers:

              Anis Chacur Neto Deputy CEO
                             o –
       Sergio Lulia Jacob  ‐ Exe
                               ecutive VP & IR Officer
        Alexandre Yoshiaki Sin
                             nzato – IR Manager


1
3Q08 Hi
                                              ighlights


    Net Income of R$48.4 million in 3Q08, growing by 11.5% from R$43.4 million in 2Q08 and by
    107.7% year over year. In 2008, Interest on Equity began to be paid on a quarterly basis, with the
    payment to shareholders in 3Q08 of gross IOE o R$17.6 million.
                                                 of

    The Efficiency Ratio was 35.8% in 3Q08, from 35.1% in 2Q08 and 37.4% in 3Q07, one of the best
    efficiency ratios presented by the bank market.

    The Credit Portfolio, including guarantees, reached R$6,879.1 million, growing 5.9% in relation to
    2Q08 and 61 8% year over year
              61.8%            year.

    The Loan Portfolio (Resolution 2,682) grew by 9
                                                  9.8% (3Q08 versus 2Q08).

    Portfolio quality remained high, with 99.4% of loan operations rated from AA to C (Central Bank
                                                 f
    Resolution 2,682), compared with 99.3% in 2Q0 and 99.3% in 3Q07.
                                                 08

    The Return on Equity (ROAE) reached 16.9% in 3Q08 versus 10.1% in 3Q07 and 15.5% in 2Q08.


2
Ownership
                             p Structure


                                           Free Float
    Marsau Uruguay                           32.7%
     (ABC) 56.4%


                                                Associates
                                                  1.4%

                                     Management
                                        9.5%


3
Credit Portfolio

    CREDIT PORFOLIO ‐ including guarantees issued                                                                               LOANS

      CAGR = 61.8%                                                                             CAGR = 58.5%
                                                                                                                                                                   5,329.3
                                                  6,879.1
                               6,498.7                      3.2%                                                                        4,854.5                              4.1%
                                         3.0%     14.2%                                                                                                     4.1%   17.7%
                               11.9%                                                                                                        15.5%
                                                                                      3,363.1
    4,250.6                                                                                              2.1%
            1.6%                                                                        14.2%
     11.7%
                                                  82.6%
                               85.1%
                                                                                        83.7%                                               80.4%                  78.2%
    86.7%
    86 7%


     3Q07                        2Q08               3Q08                                    3Q07                                             2Q08                   3Q08


                                CONSUMER           MIDDLE MARKET                         WHOLESALE + L. MIDDLE

                   Loans per Ticket (R$ mi)                        3Q
                                                                    Q08             2Q08              Chg.(%)               3Q07              Chg.(%)

                   0 ‐ 500 k                                             265.7              
                                                                                           241.2                 
                                                                                                                10.2                  
                                                                                                                                     90.2               NA
                   500 k ‐ 2 MM                                          594.2              
                                                                                           242.7             
                                                                                                            144.8                   
                                                                                                                                   187.5             
                                                                                                                                                    216.8
                   2 MM ‐ 5 MM                                           236.6              
                                                                                           540.2              
                                                                                                             (56.2)             
                                                                                                                               400.1              
                                                                                                                                                 (40.9)
                   5 MM ‐ 10 MM                                          786.9              
                                                                                           730.5                   
                                                                                                                  7.7               
                                                                                                                                   704.2                  
                                                                                                                                                         11.7
                   > 10 MM                                            3,445.9           
                                                                                       3,100.0                   
                                                                                                                11.2          
                                                                                                                             1,981.1                      
                                                                                                                                                         68.2
                   Total                                              5,329.3           4,854.5                   9.8           3,363.1                58.5 
                   *excluding guarantees issued

4
High‐quality C
                                                                 Credit Portfolio
                                                                                                              3Q08

                       Segments            Credit                                                                                             Past Due     
                                                       Write Off (R$ 
                                        Portfolio (*)                      tfolio
                                                                      % Port                               PLL (R$ mi)         % Portfolio (> 91dias) (R$  % Portfolio
                                                           mi)
                                          (R$ mi)                                                                                               mi)
          Wholesale+L.Middle                       4,165.8                    
                                                                             1.1                  0.0                 
                                                                                                                     30.7                   
                                                                                                                                           0.7                   
                                                                                                                                                                4.3                   
                                                                                                                                                                                     0.1
          Middle                                      942.7                    
                                                                              1.4                    
                                                                                                    0.1                 
                                                                                                                       21.1                   
                                                                                                                                             2.2                 
                                                                                                                                                                13.1                   
                                                                                                                                                                                      1.4
          Payroll                                     220.8                    
                                                                              0.3                    
                                                                                                    0.1                   
                                                                                                                         4.3                   
                                                                                                                                              1.9                   
                                                                                                                                                                   0.9                   
                                                                                                                                                                                        0.4
          Total                                 5,329.3                      2.8                    0.1               56.1                     1.1              18.3                    
                                                                                                                                                                                       0.3
         *excluding guarantees issued


Rating (R$ mi) *                                                    3Q08            % Port
                                                                                         tfolio
                                                                                                                                                       D-H 0.6%
                               AA                                         
                                                                         916.3                  17.2
                                                                                                 
                               A                                       
                                                                      2,393.7                   44.9
                                                                                                 
                               B                                       
                                                                      1,729.4                   32.5
                                                                                                 
                               C                                          
                                                                         255.3                      
                                                                                                   4.8
                               D                                               
                                                                              8.7                   
                                                                                                   0.2
                               E                                               
                                                                              3.4                   
                                                                                                   0.1
                               F                                             
                                                                            10.8                    
                                                                                                   0.2
                               G                                               
                                                                              2.1                   
                                                                                                   0.0
                               H                                               
                                                                              9.6                   
                                                                                                   0.2
Total                                                                   5,329.3              100.0                                                    AA-C 99.4%
*excluding guarantees issued


 5
Credit Portfolio

                                           WHOLESALE AN
                                                      ND LARGE MIDDLE

      CAGR = 54.1%                                                                                 Minas Gerais +
                                                                                                    Northeast 
                                                                                        South         2.6%
                          5,527.1               5,678.4                                 12.9%

                                                1,512.6                                                             São Paulo ‐
                          1,625.1                                 Rio de Janeiro
                                                                  R                                                  Capital
    3,684.2                                                          12.6%                                            38.7%
    868.1

                          3,902.0               4,165.8
    2,816.1

                                                                          São Paulo ‐
     3Q07                   2Q08                 3Q08                    Countryside
                                                                            33.3%
                Loans       Guarantees issued


          Wholesale + L. Middle                     3Q07                2Q08                    3Q08

        Ticket                                              8.3              11.0                 10.1
        Duration *                                         396                314                  317
        Clients                                            446                504                  529
       *excluding BNDES operations


6
Credit Portfolio

                                                     MIDDLE MARKET
                                                                                         Minas Gerais 
    CAGR = 96.6%                                                                 South       9.2%
                                             979.9                               4.3%
                          773.8               37.2              Rio de Janeiro
                                                                    3.8%
                           19.1
      498.5                                                  São Paulo ‐
      19.4                                                  Countryside
                                                            C
                                             942.7
                          754.7                                11.0%
      479.1
                                                                                                         São Paulo ‐
                                                                                                          Capital
                                                                                                          C i l
                                                                                                           71.7%
      3Q07                 2Q08              3Q08

              Loans     Guarantees issued


                      Middle Market                  3Q07           2Q08                  3Q08

               Ticket                                   1.7                2.0                   2.4
               Duration *                               166                197                   193
               Clients                                  297                389                   409
              * excluding BNDES operations

7
Credit Portfolio

                                    PAYROLL‐
                                           ‐DEDUCTIBLE

    CAGR = 225.2%
                                                                            INSS
                                                                           20.6%


                                    220.8 
                        197.8 

       67.9 
       67 9


       3Q07             2Q08        3Q08            Others
                                                    79.4%
                      Loans


               Payroll‐Deductible      3Q07        2Q08        3Q08

           Average Term                      580      751         752
           Agreements                          4
                                              24          37          39


8
Other A
                                                        Activities

                                             TREASURY AND
                                                        D CAPITAL MARKET


    Capital Market (R$ mi)                            3Q08
                                                         8       2Q08        Chg.(%)     3Q07       Chg.(%)
    Underwriting Fees and Structured Oper.               2.3        1.3          76.9       3.5        (34.3)
    Number of trades                                         5           5        NA            5       NA


    Treasury (R$ mi)                                  3Q08
                                                         8       2Q08        Chg.(%)     3Q07       Chg.(%)
    Income                                               4.5       9.8          (54.5)     (0.8)     (656.9)
    Average consolidated VaR                             4.3       3.4           26.5       2.6        65.4


9
Fun
                                                                                         nding                                      5,459.3

                                                                                                                4,819.4
                                                                                          4,354.3
                                                                                                                                    40.6%
                                                                    3,841.3
                                                                                                                 36.3%
                                            3,164.6                                        43
                                                                                            3.0%
                                                                    44.0%
                                                                                                                                     7.4%     Retail
     International                          35.4%
                                                                                                                 10.3%
                                                                                                                             2.7%
                                                                                                                                     9.2%     BNDES
                                                                                                    2.5%
                                                      1.8%                    2.4%         10
                                                                                            0.5%
                                            13.4%                   11.3%                                        22.4%              19.5%      Institutional
                                                                                           19
                                                                                            9.0%
                                            24.4%                   20.2%
                          Local
                                                                                           25
                                                                                            5.0%                 28.3%               23.3% Corporate
                                            25.0%                   22.1%

                                            Sep 2007            Dec 2007                  Ma 2008
                                                                                           ar                   Jun 2008            Sep 2008

     Open Market Deposits and Funding (R$ mi)                3Q08        2Q08          Chg.(%)      3Q07        Chg.(%)

     Until 3 months                                          1,088.4          788.3        38
                                                                                            8.1       664.3         63.9
     3 to 12 months                                          1,160.9        1,343.3        (13
                                                                                             3.6)     570.1        103.6
     1 to 3 years                                              665.5          614.0          8.4
                                                                                             8        485.8         37.0
     Above 3 years                                              20.8           36.5        (43
                                                                                             3.0)      26.4         (21.0)
     Total                                                   2,935.6        2,782.1          5.5     1,746.4         68.1 


     Borrowing and on Lending Obligations                    3Q08        2Q08          Chg.(%)      3Q07        Chg.(%)

     Until 3 months                                            952.1          487.2        95
                                                                                            5.4       341.9        178.5
     3 to 12 months                                          1,113.6        1,111.0          0.2
                                                                                             0        621.6         79.1
     1 to 3 years                                              384.3          360.8          6.5
                                                                                             6        370.9           3.6
     Above 3 years                                              73.6           78.3         (6
                                                                                             6.0)      83.8         (12.2)
     Total                                                   2,523.7        2,037.3         23.9 
                                                                                            2        1,418.2         77.9 


10
Profi
                                                                           itability
                                                          NET INCOME – R$ MILLION

                                                         Other 
                                                        Operating 
     Net Interest 
                       Loan                             Expenses            Income Tax and 
                                      88.8                                       Social 
       Income
                     Operations
                                                                              Contribution
                                                              (27.8)
                                                                                  (22.2)             Profit       NET 
                      Treasury
                                                                                                    Sharing     INCOME
                                        4.5
                                                                 Impact of IO
                                                                            OE     7.0                 (13.9)
                      Services        12.1
                                                                                                                 48.4
                                                                                 (15.2)
                                  105.4
                                   05
                Income Statement (R$ mi)                                                      3Q08

                Net Interest Income after PLL                                                        
                                                                                                    70.1
                Adjustment of exchange Gains/Losses effect on Offshore Inve
                                                                          estments (a)               
                                                                                                    16.6
                Taxes adjustment of exchange effect on Offshore Investmentts (b)                        
                                                                                                       6.6
                Net Interest Income                                                                  
                                                                                                    93.3
                Banking services fees                                                                
                                                                                                    12.1
                Personnel Expenses/Other Administrative/Tax                                         
                                                                                                   (30.7)
                Other operating income/expenses                                                      
                                                                                                    18.3
                                                                          estments (a)
                Adjustment of exchange Gains/Losses effect on Offshore Inve                         
                                                                                                   (16.6)
                Non Operating Income                                                                    
                                                                                                       1.2
                Earnings before tax Income                                                           
                                                                                                    77.6
                Taxes                                                                                 
                                                                                                     (8.6)
                                                                         ts (b)
                Taxes adjustment of exchange effect on Offshore Investment                            
                                                                                                     (6.6)
                Profit Sharing                                                                      
                                                                                                   (13.9)
                Net Income                                                                            48.4 

11
Profi
                                         itability


         NET INCOME – R$ MILLION                                ROAE – p.a.


                      CAGR =92.3%

CAGR =107.7%
                                     129.8

                              67.5                              16.9%
               48.4                                                                   15.4%
                                                        15.5%                 14.7%
        43.4
 23.3                                           10.1%


 3Q07   2Q08   3Q08           9M07    9M08      3Q07    2Q08     3Q08          9M07    9M08


12
Ra
                                                     atios

                     NIM                                        STOCKHOLDERS’ EQUITY (R$ mi) 
                                                                    AND BASEL INDEX (%)

                                                             26.7%                     1,158.8

            6.6%                          6.5%
                                                                          1,131.8
                   6.4%
                                   6.2%
                                                             1,082.9
                                                                            19.2%
                                                                            19,2%
     5.5%                                                                               16.7%
                                                                                        16,1%


     3Q07   2Q08   3Q08            9M07   9M08                3Q07          2Q08        3Q08


                          EFFICIENCY RATIO (%) – inc
                                                   cluding profit sharing

                                 37.4%
                                                               35.8%
                                                 35.1%


                                 3Q07             2Q08           3Q08
13
Ra
                                      atings


                                               Ratings
                            Agency                                 Update
                                     LOC
                                       CAL               GLOBAL

                       *             Aaa Br
                                       a.Br 
                                       a                  Baa2 
                                                          Baa2    09/15/2008


                                      AA
                                       A‐                 BB+     05/16/2008


     *Deposits in local currency


14
Cont
                        tacts


                 Investor Relations
     Sergio Lulia Jacob – Ex
                           xecutive VP & IR Officer
            Alexandre Sinza – IR Manager
                          ato
             Eduardo Randi – IR Analyst
                         ich


          Web Site: www.abcbrasil.com.br/ir
              Email: ri@abc
                          cbrasil.com.br
                Tel.: +55 (11 3170 2186
                            1)


15
Discla
                                                         aimer

     The following material, on this date, is a presentation containing general information about the Banco
     ABC Brasil S.A. We offer no guarantee and make no d declaration, implicitly or explicitly, as to the accuracy,
     completeness or scope of this information.

     This presentation may include forward‐looking state   ements of future events or results according to the
     regulations of the Brazilian and International securities and exchange commissions. These statements are
     based on certain assumptions and analyses by the Company that reflect its experience, the economic
     environment, future market conditions and expected events by the company, many of which are beyond
                                                           d
     the control of the Company. Important factors that m lead to significant differences between the actual
                                                          may
     results and the statements of expectations about future events or results include the company’s business
     strategy,
     strategy Brazilian and International economic condit  tions, technology,
                                                           tions technology financial strategy financial market
                                                                                       strategy,
     conditions, uncertainty regarding the results of its fu
                                                           uture operations, plans, objectives, expectations and
     intentions, among others. Considering these fac       ctors, the actual results of the company may be
     significantly different from those shown or implicit in the statement of expectations about future events
                                                           n
     or results.

     The information and opinions contained in this presentation should not be understood as a
                                                         s
     recommendation to potential investors and no invest tment decision is to be based on the veracity, current
     events or completeness of this information or thes opinions. No advisors to the company or parties
                                                         se
     related to them or their representatives should have any responsibility for any losses that may result from
     the use or contents of this presentation.


16

More Related Content

Banco ABC - 3rd Quarter 2008 Results Presentation

  • 1. 3Q08 Earnings Presentation s October 30, 2008 Speak kers: Anis Chacur Neto Deputy CEO o – Sergio Lulia Jacob  ‐ Exe ecutive VP & IR Officer Alexandre Yoshiaki Sin nzato – IR Manager 1
  • 2. 3Q08 Hi ighlights Net Income of R$48.4 million in 3Q08, growing by 11.5% from R$43.4 million in 2Q08 and by 107.7% year over year. In 2008, Interest on Equity began to be paid on a quarterly basis, with the payment to shareholders in 3Q08 of gross IOE o R$17.6 million. of The Efficiency Ratio was 35.8% in 3Q08, from 35.1% in 2Q08 and 37.4% in 3Q07, one of the best efficiency ratios presented by the bank market. The Credit Portfolio, including guarantees, reached R$6,879.1 million, growing 5.9% in relation to 2Q08 and 61 8% year over year 61.8% year. The Loan Portfolio (Resolution 2,682) grew by 9 9.8% (3Q08 versus 2Q08). Portfolio quality remained high, with 99.4% of loan operations rated from AA to C (Central Bank f Resolution 2,682), compared with 99.3% in 2Q0 and 99.3% in 3Q07. 08 The Return on Equity (ROAE) reached 16.9% in 3Q08 versus 10.1% in 3Q07 and 15.5% in 2Q08. 2
  • 3. Ownership p Structure Free Float Marsau Uruguay 32.7% (ABC) 56.4% Associates 1.4% Management 9.5% 3
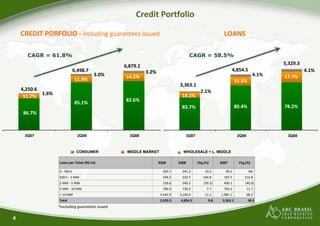
  • 4. Credit Portfolio CREDIT PORFOLIO ‐ including guarantees issued LOANS CAGR = 61.8% CAGR = 58.5% 5,329.3 6,879.1 6,498.7 3.2% 4,854.5 4.1% 3.0% 14.2% 4.1% 17.7% 11.9% 15.5% 3,363.1 4,250.6 2.1% 1.6% 14.2% 11.7% 82.6% 85.1% 83.7% 80.4% 78.2% 86.7% 86 7% 3Q07 2Q08 3Q08 3Q07 2Q08 3Q08 CONSUMER MIDDLE MARKET WHOLESALE + L. MIDDLE Loans per Ticket (R$ mi) 3Q Q08 2Q08 Chg.(%) 3Q07 Chg.(%) 0 ‐ 500 k           265.7               241.2                10.2                90.2 NA 500 k ‐ 2 MM           594.2               242.7              144.8              187.5              216.8 2 MM ‐ 5 MM           236.6               540.2               (56.2)              400.1               (40.9) 5 MM ‐ 10 MM           786.9               730.5                  7.7              704.2                11.7 > 10 MM        3,445.9            3,100.0                11.2           1,981.1                68.2 Total         5,329.3           4,854.5                   9.8           3,363.1                58.5  *excluding guarantees issued 4
  • 5. High‐quality C Credit Portfolio 3Q08 Segments Credit  Past Due      Write Off (R$  Portfolio (*)  tfolio % Port PLL (R$ mi) % Portfolio (> 91dias) (R$  % Portfolio mi) (R$ mi) mi) Wholesale+L.Middle            4,165.8                     1.1            0.0                  30.7                    0.7                    4.3                    0.1 Middle               942.7                     1.4                   0.1                  21.1                    2.2                  13.1                    1.4 Payroll               220.8                     0.3                   0.1                    4.3                    1.9                    0.9                    0.4 Total 5,329.3  2.8                    0.1  56.1                     1.1  18.3                     0.3 *excluding guarantees issued Rating (R$ mi) * 3Q08 % Port tfolio D-H 0.6% AA            916.3             17.2   A         2,393.7             44.9   B         1,729.4             32.5   C            255.3                  4.8 D                 8.7                  0.2 E                 3.4                  0.1 F              10.8                  0.2 G                 2.1                  0.0 H                 9.6                  0.2 Total          5,329.3              100.0  AA-C 99.4% *excluding guarantees issued 5
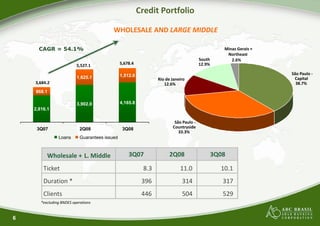
  • 6. Credit Portfolio WHOLESALE AN ND LARGE MIDDLE CAGR = 54.1% Minas Gerais + Northeast  South 2.6% 5,527.1 5,678.4 12.9% 1,512.6 São Paulo ‐ 1,625.1 Rio de Janeiro R Capital 3,684.2 12.6% 38.7% 868.1 3,902.0 4,165.8 2,816.1 São Paulo ‐ 3Q07 2Q08 3Q08 Countryside 33.3% Loans Guarantees issued Wholesale + L. Middle 3Q07 2Q08 3Q08 Ticket 8.3 11.0 10.1 Duration * 396 314 317 Clients 446 504 529 *excluding BNDES operations 6
  • 7. Credit Portfolio MIDDLE MARKET Minas Gerais  CAGR = 96.6% South 9.2% 979.9 4.3% 773.8 37.2 Rio de Janeiro 3.8% 19.1 498.5 São Paulo ‐ 19.4 Countryside C 942.7 754.7 11.0% 479.1 São Paulo ‐ Capital C i l 71.7% 3Q07 2Q08 3Q08 Loans Guarantees issued Middle Market 3Q07 2Q08 3Q08 Ticket 1.7 2.0 2.4 Duration * 166 197 193 Clients 297 389 409 * excluding BNDES operations 7
  • 8. Credit Portfolio PAYROLL‐ ‐DEDUCTIBLE CAGR = 225.2% INSS 20.6% 220.8  197.8  67.9  67 9 3Q07 2Q08 3Q08 Others 79.4% Loans Payroll‐Deductible 3Q07 2Q08 3Q08 Average Term 580 751 752 Agreements 4 24 37 39 8
  • 9. Other A Activities TREASURY AND D CAPITAL MARKET Capital Market (R$ mi) 3Q08 8 2Q08 Chg.(%) 3Q07 Chg.(%) Underwriting Fees and Structured Oper. 2.3 1.3 76.9 3.5 (34.3) Number of trades 5 5 NA 5 NA Treasury (R$ mi) 3Q08 8 2Q08 Chg.(%) 3Q07 Chg.(%) Income 4.5 9.8 (54.5) (0.8) (656.9) Average consolidated VaR 4.3 3.4 26.5 2.6 65.4 9
  • 10. Fun nding 5,459.3 4,819.4 4,354.3 40.6% 3,841.3 36.3% 3,164.6 43 3.0% 44.0% 7.4% Retail International 35.4% 10.3% 2.7% 9.2% BNDES 2.5% 1.8% 2.4% 10 0.5% 13.4% 11.3% 22.4% 19.5% Institutional 19 9.0% 24.4% 20.2% Local 25 5.0% 28.3% 23.3% Corporate 25.0% 22.1% Sep 2007 Dec 2007 Ma 2008 ar Jun 2008 Sep 2008 Open Market Deposits and Funding (R$ mi) 3Q08 2Q08 Chg.(%) 3Q07 Chg.(%) Until 3 months 1,088.4  788.3  38 8.1 664.3 63.9 3 to 12 months 1,160.9  1,343.3  (13 3.6) 570.1 103.6 1 to 3 years 665.5  614.0  8.4 8 485.8 37.0 Above 3 years 20.8  36.5  (43 3.0) 26.4 (21.0) Total  2,935.6  2,782.1  5.5  1,746.4  68.1  Borrowing and on Lending Obligations 3Q08 2Q08 Chg.(%) 3Q07 Chg.(%) Until 3 months 952.1  487.2  95 5.4 341.9 178.5 3 to 12 months 1,113.6  1,111.0  0.2 0 621.6 79.1 1 to 3 years 384.3  360.8  6.5 6 370.9 3.6 Above 3 years 73.6  78.3  (6 6.0) 83.8 (12.2) Total  2,523.7  2,037.3  23.9  2 1,418.2  77.9  10
  • 11. Profi itability NET INCOME – R$ MILLION Other  Operating  Net Interest  Loan  Expenses Income Tax and  88.8 Social  Income Operations Contribution (27.8) (22.2) Profit  NET  Treasury Sharing INCOME 4.5 Impact of IO OE 7.0 (13.9) Services 12.1 48.4 (15.2) 105.4 05 Income Statement (R$ mi) 3Q08 Net Interest Income after PLL            70.1 Adjustment of exchange Gains/Losses effect on Offshore Inve estments (a)            16.6 Taxes adjustment of exchange effect on Offshore Investmentts (b)               6.6 Net Interest Income            93.3 Banking services fees            12.1 Personnel Expenses/Other Administrative/Tax           (30.7) Other operating income/expenses            18.3 estments (a) Adjustment of exchange Gains/Losses effect on Offshore Inve           (16.6) Non Operating Income               1.2 Earnings before tax Income            77.6 Taxes             (8.6) ts (b) Taxes adjustment of exchange effect on Offshore Investment             (6.6) Profit Sharing           (13.9) Net Income           48.4  11
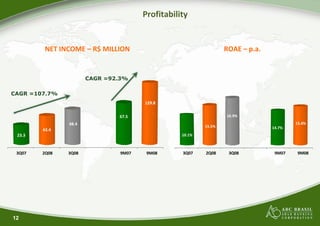
  • 12. Profi itability NET INCOME – R$ MILLION ROAE – p.a. CAGR =92.3% CAGR =107.7% 129.8 67.5 16.9% 48.4 15.4% 15.5% 14.7% 43.4 23.3 10.1% 3Q07 2Q08 3Q08 9M07 9M08 3Q07 2Q08 3Q08 9M07 9M08 12
  • 13. Ra atios NIM STOCKHOLDERS’ EQUITY (R$ mi)  AND BASEL INDEX (%) 26.7% 1,158.8 6.6% 6.5% 1,131.8 6.4% 6.2% 1,082.9 19.2% 19,2% 5.5% 16.7% 16,1% 3Q07 2Q08 3Q08 9M07 9M08 3Q07 2Q08 3Q08 EFFICIENCY RATIO (%) – inc cluding profit sharing 37.4% 35.8% 35.1% 3Q07 2Q08 3Q08 13
  • 14. Ra atings Ratings Agency Update LOC CAL GLOBAL * Aaa Br a.Br  a Baa2  Baa2 09/15/2008 AA A‐ BB+ 05/16/2008 *Deposits in local currency 14
  • 15. Cont tacts Investor Relations Sergio Lulia Jacob – Ex xecutive VP & IR Officer Alexandre Sinza – IR Manager ato Eduardo Randi – IR Analyst ich Web Site: www.abcbrasil.com.br/ir Email: ri@abc cbrasil.com.br Tel.: +55 (11 3170 2186 1) 15
  • 16. Discla aimer The following material, on this date, is a presentation containing general information about the Banco ABC Brasil S.A. We offer no guarantee and make no d declaration, implicitly or explicitly, as to the accuracy, completeness or scope of this information. This presentation may include forward‐looking state ements of future events or results according to the regulations of the Brazilian and International securities and exchange commissions. These statements are based on certain assumptions and analyses by the Company that reflect its experience, the economic environment, future market conditions and expected events by the company, many of which are beyond d the control of the Company. Important factors that m lead to significant differences between the actual may results and the statements of expectations about future events or results include the company’s business strategy, strategy Brazilian and International economic condit tions, technology, tions technology financial strategy financial market strategy, conditions, uncertainty regarding the results of its fu uture operations, plans, objectives, expectations and intentions, among others. Considering these fac ctors, the actual results of the company may be significantly different from those shown or implicit in the statement of expectations about future events n or results. The information and opinions contained in this presentation should not be understood as a s recommendation to potential investors and no invest tment decision is to be based on the veracity, current events or completeness of this information or thes opinions. No advisors to the company or parties se related to them or their representatives should have any responsibility for any losses that may result from the use or contents of this presentation. 16