Location via proxy:   [ UP ]  
[Report a bug]   [Manage cookies]                
SlideShare a Scribd company logo
Creating the Premier Financial
Services Company in the World


Ken Lewis             John Thain
Bank of America       Merrill Lynch
Chairman and CEO      Chairman and CEO


September 15, 2008
Forward Looking Statements

     This presentation contains forward-looking statements, including statements about the
     financial conditions, results of operations and earnings outlook of Bank of America
     Corporation. The forward-looking statements involve certain risks and uncertainties. Factors
     that may cause actual results or earnings to differ materially from such forward-looking
     statements include, among others, the following: 1) projected business increases following
     process changes and other investments are lower than expected; 2) competitive pressure
     among financial services companies increases significantly; 3) general economic conditions
     are less favorable than expected; 4) political conditions including the threat of future
     terrorist activity and related actions by the United States abroad may adversely affect the
     company’s businesses and economic conditions as a whole; 5) changes in the interest rate
     environment and market liquidity reduce interest margins, impact funding sources and
     effect the ability to originate and distribute financial products in the primary and secondary
     markets; 6) changes in foreign exchange rates increases exposure; 7) changes in market
     rates and prices may adversely impact the value of financial products; 8) legislation or
     regulatory environments, requirements or changes adversely affect the businesses in which
     the company is engaged; 9) changes in accounting standards, rules or interpretations, 10)
     litigation liabilities, including costs, expenses, settlements and judgments, may adversely
     affect the company or its businesses; 11) mergers and acquisitions and their integration into
     the company; and 12) decisions to downsize, sell or close units or otherwise change the
     business mix of any of the company. Accordingly, readers are cautioned not to place undue
     reliance on forward-looking statements, which speak only as of the date on which they are
     made. Bank of America does not undertake to update forward-looking statements to reflect
     the impact of circumstances or events that arise after the date the forward-looking
     statements are made. For further information regarding Bank of America Corporation,
     please read the Bank of America reports filed with the SEC and available at www.sec.gov.


2
Additional Information About This Transaction


      In connection with the proposed merger, Bank of America will file with the SEC a
      Registration Statement on Form S-4 that will include a joint proxy statement of
      Bank of America and Merrill Lynch that also constitutes a prospectus of Bank of
      America. Bank of America and Merrill Lynch will mail the joint proxy
      statement/prospectus to their respective stockholders. Bank of America and
      Merrill Lynch urge investors and security holders to read the joint proxy
      statement/prospectus regarding the proposed merger when it becomes available
      because it will contain important information. You may obtain copies of all
      documents filed with the SEC regarding this transaction, free of charge, at the
      SEC’s website (www.sec.gov). You may also obtain these documents, free of
      charge, from Bank of America’s website (www.bankofamerica.com) under the
      tab “About Bank of America” and then under the heading “Investor Relations”
      and then under the item “SEC Filings”. You may also obtain these documents,
      free of charge, from Merrill Lynch’s website (www.ml.com) under the tab
      “Investor Relations” and then under the heading “SEC Filings.”


3
Proxy Solicitation


      Bank of America, Merrill Lynch and their respective directors, executive officers
      and certain other members of management and employees may be soliciting
      proxies from stockholders in favor of the merger. Information regarding the
      persons who may, under the rules of the SEC, be considered participants in the
      solicitation of the stockholders in connection with the proposed merger will be
      set forth in the joint proxy statement/prospectus when it is filed with the SEC.
      You can find information about Bank of America’s executive officers and
      directors in its definitive proxy statement filed with the SEC on March 19, 2008.
      You can find information about Merrill Lynch’s executive officers and directors
      in its definitive proxy statement filed with the SEC on March 14, 2008. You can
      obtain free copies of these documents from Bank of America and Merrill Lynch
      using the contact information above.


4
Creating the Premier Financial Services Provider


      •   Merrill Lynch is a premium franchise
           – Leading global wealth manager
           – A leading global investment bank
           – Experienced management team


      •   Unprecedented market environment
           – Significant dislocations in financial markets
           – Standalone investment bank model questioned
           – Unprecedented impacts on companies


5
Strategic Rationale

    •   Diversify business mix
    •   Significant enhancement to our investment banking capabilities
         – Creates leading positions in
             • Global Debt Underwriting
             • Global Equities
             • Global M&A Advisory
    •   Leadership position in retail brokerage and wealth management
         – 20,000 financial advisors (16,690 Merrill Lynch advisors)
         – $2.5 trillion in client assets
    •   Brings global scale in investment management
         – 50% ownership stake in BlackRock with $1.4 trillion in AUMs
         – Columbia funds have $425 billion in AUMs (total BAC AUMs $589 billion)


6
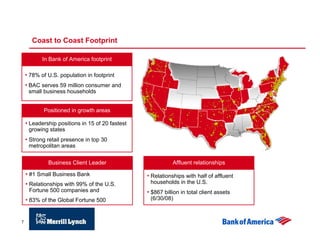
Coast to Coast Footprint

           In Bank of America footprint

    • 78% of U.S. population in footprint
    • BAC serves 59 million consumer and
     small business households


           Positioned in growth areas

    • Leadership positions in 15 of 20 fastest
     growing states
    • Strong retail presence in top 30
     metropolitan areas

             Business Client Leader                         Affluent relationships

    • #1 Small Business Bank                     • Relationships with half of affluent
    • Relationships with 99% of the U.S.          households in the U.S.
     Fortune 500 companies and                   • $867 billion in total client assets
    • 83% of the Global Fortune 500               (6/30/08)


7
      Internal use only
Strengthens Important Relationship Cornerstone Products


             Deposits                               Wealth
                                                  Management

                                                     •   20,000 financial
                                                         advisors
                                                     • $2.5 trillion in client
                                                       assets


          Credit & Debit                         Home Lending
              Card


8
Transaction Strengthens
    Bank of America’s Corporate and Investment Banking
    Clients Served                            Businesses up to       Larger companies           Investors
                                              $2B in revenues          and sponsors


    Relationship Management Team              Global Commercial      Global Investment      Capital Market Sales
                                              Bank                   Bank                   Trading Teams


    Capabilities                              Lending                Lending                Research
                                              Treasury               Treasury               Trading
                                              Management             Management             Financing
                                              Strategic Advice       Strategic Advice
                                              Debt/Equity Capital    Debt/Equity Capital
                                              Markets                Markets


    Key 2Q08 Stats (1)                       157,600 Clients        8,100 Clients          5,500 Clients
                                             $256B Loans            $79B Loans             $337B Trading Related
                                                                                            Assets
                                             $102B Deposits         $132B Deposits
                                                                                           $1.1B Revenue
                                             $3.2B Revenue          $1.7B Revenue


    (1 ) Client counts exclude LaSalle and Consumer DFS
9
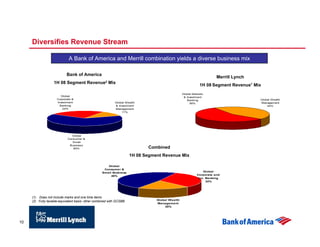
Diversifies Revenue Stream

                             A Bank of America and Merrill combination yields a diverse business mix

                           Bank of America
                                                                                                                    Merrill Lynch
                   1H 08 Segment         Revenue2      Mix
                                                                                                           1H 08 Segment Revenue1 Mix
                                                                                                Global Markets
                                                                                                Global Markets
                        Global
                         Global                                                                  & Investment
                                                                                                 & Investment
                     Corporate &
                     Corporate &                                                                   Banking                          Global Wealth
                                                                                                                                    Global Wealth
                                                                                                    Banking
                     Investment
                      Investment                           Global Wealth
                                                           Global Wealth                             56%                            Management
                                                                                                                                     Management
                                                                                                      56%
                       Banking
                        Banking                            & Investment
                                                            & Investment                                                                44%
                                                                                                                                        44%
                         24%
                          24%                              Management
                                                            Management
                                                                11%
                                                                11%


                              Global
                               Global
                            Consumer &
                            Consumer &
                               Small
                               Small
                             Business
                             Business
                               65%
                                65%                                         Combined
                                                                     1H 08 Segment Revenue Mix

                                                      Global
                                                      Global
                                                    Consumer &
                                                    Consumer &
                                                   Small Business                                            Global
                                                                                                             Global
                                                   Small Business
                                                        48%                                              Corporate and
                                                                                                         Corporate and
                                                        48%
                                                                                                          Inv. Banking
                                                                                                          Inv. Banking
                                                                                                               32%
                                                                                                               32%


     (1) Does not include marks and one time items
                                                                                Global Wealth
                                                                                Global Wealth
     (2) Fully taxable-equivalent basis: other combined with GCSBB
                                                                                Management
                                                                                 Management
                                                                                    20%
                                                                                     20%


10
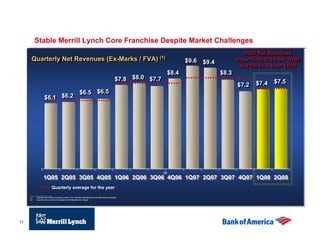
Stable Merrill Lynch Core Franchise Despite Market Challenges
                                                                                                                                                    1H08 Net Revenues
                                                                                                                                                     1H08 Net Revenues
      Quarterly Net Revenues (Ex-Marks // FVA) (1)
      Quarterly Net Revenues (Ex-Marks FVA) (1)                                                                                $9.6 $9.4
                                                                                                                               $9.6 $9.4          Down Only 5% from 1H06
                                                                                                                                                  Down Only 5% from 1H06
                                                                                                                                                   and Up 21% from 1H05
                                                                                                                                                   and Up 21% from 1H05
                                                                                                                        $8.4
                                                                                                                        $8.4               $8.3
                                                                                                                                           $8.3
                                                                                                 $7.8 $8.0 $7.7
                                                                                                 $7.8 $8.0 $7.7                                             $7.5
                                                                                                                                                  $7.2 $7.4 $7.5
                                                                                                                                                  $7.2 $7.4
                                                           $6.5 $6.5
                                                           $6.5 $6.5
                    $6.1 $6.2
                    $6.1 $6.2


                                                                                                                  (2)
                   1Q05 2Q05 3Q05 4Q05 1Q06 2Q06 3Q06 4Q06 1Q07 2Q07 3Q07 4Q07 1Q08 2Q08
                   1Q05 2Q05 3Q05 4Q05 1Q06 2Q06 3Q06 4Q06 1Q07 2Q07 3Q07 4Q07 1Q08 2Q08
                            Quarterly average for the year
     ____________________
     (1)   Quarters are shown excluding marks, fair valuation adjustments and restructuring charges.
     (2)   Excludes the positive net impact of the BlackRock merger.


11
Merrill Lynch’s Diversified Business Model
     2Q08 Net Revenues by Business                                                                                                                                GMI % of Net Revenues (5)
                                                                                                                                                                                        (5)

     (Ex-marks / FVA) (1)
                      (1)                                                                                                                                         (Ex-marks)

          GMI                                                                                                       GWM

                                        Investment
                                          Banking
                                           13%
                                                                                         GPC
                             Equity                                                      41%(2)
                                                                                            (2)
                                                                                                                                                                                                          U.S.
                                                                                                                                                                                                          U.S.
                             Markets
                                                                                                                                                                                                                                             Non-U.S.
                                                                                                                                                                                                                                             Non-U.S.
                                                                                                                                                                                                          46%
                                                                                                                                                                                                          46%
                              23%                                                                                                                                                                                                              54%
                                                                                                                                                                                                                                               54%

                                                       FICC                       GIM
                                                       20%(3)
                                                           (3)
                                                                                  3%


                                                $7.5 billion (4)
                                                   (Ex-marks/FVA)
     ____________________
     (1)   Pie chart percentages exclude net revenues from the Corporate segment.
     (2)   Adjusted to exclude the net charge of $7 million related to changes in the carrying value of certain long-term debt liabilities.
     (3)   Adjusted to exclude: (i) $6.8 billion of net write-downs primarily related to U.S. ABS CDOs, residential mortgages and the U.S. Banks investment securities portfolio exposures; (ii) negative $2.9 billion of credit valuation
           adjustments related to hedges with financial guarantors; and (iii) the net benefit of $98 million related to changes in the carrying value of certain long-term debt liabilities.
     (4)   Adjusted to exclude: (i) $6.8 billion of net write-downs primarily related to U.S. ABS CDOs, residential mortgages and the U.S. Banks investment securities portfolio exposures; (ii) negative $2.9 billion of credit valuation
           adjustments related to hedges with financial guarantors; and (iii) the net benefit of $91 million related to changes in the carrying value of certain long-term debt liabilities.
     (5)   Reflects 2Q08. Adjusted to exclude (i) $6.8 billion of net write-downs primarily related to U.S. ABS CDOs, residential mortgages and the U.S. Banks investment securities portfolio exposures; and (ii) $2.9 billion of credit valuation
           adjustments related to hedges with financial guarantors.


12
Merrill Lynch Was Focusing on Growth in Emerging Markets

                        •   Market leader with full local capabilities, significant expansion since
                            increasing stake in DSP Merrill Lynch to 90%
          India
                        •   GWM and principal investments are significant growth opportunities


                        •   One of our most successful emerging market platforms to date
         Brazil         •   Recently added leading investment banking team to further bolster local
                            capabilities and foreign bank franchise


                        •   Building out GMI franchise to complement GWM position
      Middle East /
                        •   Focus on delivering fully integrated wealth management and institutional
      North Africa          solutions to sovereign wealth clients

                        •   Opened Moscow office in January 2008, franchise build toward full GMI
                            capabilities underway
         Russia
                        •   #1 in Russia M&A; 1H08 revenues 4x full-year 2007 revenues


                        •   Significant long-term growth opportunities with strategic focus on
         China              obtaining local licenses


13
Merrill Lynch Has a Premier Global Wealth Management Platform
     Growth in Financial Advisors                                                                                                      Net New Money (Trailing Twelve Months) (1)
                                                                                                                                       Net New Money (Trailing Twelve Months) (1)
                                                                                                      16,690
                                                                                                      16,690                            ($ in billions)
                                                                                                                                         ($ in billions)

                                             R 5%
                                               5%
                                         CAG R
                                         C AG                                                                                                      $55
                                                                                                                                                   $55                    $49
                                                                                                                                                                          $49
                                                                                                                                                                                              $38
                                                                                                                                                                                              $38
      13,380
      13,380


                                                                                                                                                                                                              ($3)
                                                                                                                                                                                                               ($3)
        3Q 4Q 1Q 2Q 3Q 4Q 1Q 2Q 3Q 4Q 1Q 2Q 3Q 4Q 1Q 2Q 3Q 4Q 1Q 2Q

                                                                                                                                                   MER                    MS                  UBS               C
         2003
         2003            2004
                         2004                  2005
                                               2005                 2006
                                                                    2006                 2007
                                                                                         2007            2008
                                                                                                         2008


     Annualized Net Revenue per FA(1)
                                  (1)                                                                                                  Client Assets Per FA
                                                                                                                                       Client Assets Per FA
      ($ in thousands)                                           MER
                                                                 MER        Avg of Competitors (1)
                                                                            Avg of Competitors (1)                                     ($ in millions)
                                                                                                                                        ($ in millions)
                                                                 MER (excl. POAs & Trainees)
                                                                 MER (excl. POAs & Trainees)                                                                                            MER
                                                                                                                                                                                        MER        Avg of Competitors (1)
                                                                                                                                                                                                   Avg of Competitors (1)
                                                                                                                                                                                        MER (excl. POAs & Trainees)
                                                                                                                                                                                        MER (excl. POAs & Trainees)
                                                                                                         $987
                                                                                                         $987

                                                                                                         $806
                                                                                                         $806                                                                                                         $117
                                                                                                                                                                                                                      $117
                                                                                                         $707
                                                                                                         $707
                                                                                                                                                                                                                      $96
                                                                                                                                                                                                                      $96
                                                                                                                                                                                                                      $86
                                                                                                                                                                                                                      $86
         1Q06 2Q06 3Q06 4Q06 1Q07 2Q07 3Q07 4Q07 1Q08 2Q08
                                                                                                                                          1Q06       2Q06       3Q06    4Q06    1Q07   2Q07    3Q07   4Q07   1Q08   2Q08


     ____________________
     (1)  Competitor data sourced from SEC filings. Annualized quarterly revenues divided by average financial advisors as reported. Competitors reflected in Average
          are: Citigroup-GWM, Morgan Stanley-GWM, UBS-WMUSA
          and Wachovia-Retail Brokerage Services.
14
Transaction Overview


      •   All stock transaction based on an exchange ratio of .8595 BAC
          shares for each ML share ($50 billion based on 9/12/08 price)
           – Premium over 9/12/08 close          70%
           – Premium over last 5-day average     29%
           – Multiple of earnings
               • 12.1x 2009 EPS
               • 10.9x 2010 EPS
           – Multiple of tangible book 1.83x
      •   Transaction is expected to close by end of first quarter 2009
      •   Necessary approvals
           – Shareholders of both companies
           – Standard regulatory approvals


15
Transaction Financials


       •   Used First Call estimates for 2009 & 2010 for both companies
       •   Expense efficiencies of $7 billion pre-tax (10% combined base)
            – Over 20% in 2009
            – Fully realized in 2012
       •   $450 million in amortization expense
       •   Restructuring charges of $2.0 billion after tax
       •   Accretion/(dilution)
            – 3% dilutive in 2009
            – Breakeven in 2010


16
Other Considerations


      •   Risk
           – Due diligence complete
           – Significant progress by Merrill Lynch in reducing risk
           – Asset valuations carefully reviewed
      •   Capital
           – Goodwill approximately $23 billion
           – Other intangibles $6 billion
           – Tier 1 impact estimated at 20 – 25 bps


17
America’s Premier Financial Services Brand


18

More Related Content

Bank of America Corporation acquires Merrill Lynch & Co., Inc. Presentation

  • 1. Creating the Premier Financial Services Company in the World Ken Lewis John Thain Bank of America Merrill Lynch Chairman and CEO Chairman and CEO September 15, 2008
  • 2. Forward Looking Statements This presentation contains forward-looking statements, including statements about the financial conditions, results of operations and earnings outlook of Bank of America Corporation. The forward-looking statements involve certain risks and uncertainties. Factors that may cause actual results or earnings to differ materially from such forward-looking statements include, among others, the following: 1) projected business increases following process changes and other investments are lower than expected; 2) competitive pressure among financial services companies increases significantly; 3) general economic conditions are less favorable than expected; 4) political conditions including the threat of future terrorist activity and related actions by the United States abroad may adversely affect the company’s businesses and economic conditions as a whole; 5) changes in the interest rate environment and market liquidity reduce interest margins, impact funding sources and effect the ability to originate and distribute financial products in the primary and secondary markets; 6) changes in foreign exchange rates increases exposure; 7) changes in market rates and prices may adversely impact the value of financial products; 8) legislation or regulatory environments, requirements or changes adversely affect the businesses in which the company is engaged; 9) changes in accounting standards, rules or interpretations, 10) litigation liabilities, including costs, expenses, settlements and judgments, may adversely affect the company or its businesses; 11) mergers and acquisitions and their integration into the company; and 12) decisions to downsize, sell or close units or otherwise change the business mix of any of the company. Accordingly, readers are cautioned not to place undue reliance on forward-looking statements, which speak only as of the date on which they are made. Bank of America does not undertake to update forward-looking statements to reflect the impact of circumstances or events that arise after the date the forward-looking statements are made. For further information regarding Bank of America Corporation, please read the Bank of America reports filed with the SEC and available at www.sec.gov. 2
  • 3. Additional Information About This Transaction In connection with the proposed merger, Bank of America will file with the SEC a Registration Statement on Form S-4 that will include a joint proxy statement of Bank of America and Merrill Lynch that also constitutes a prospectus of Bank of America. Bank of America and Merrill Lynch will mail the joint proxy statement/prospectus to their respective stockholders. Bank of America and Merrill Lynch urge investors and security holders to read the joint proxy statement/prospectus regarding the proposed merger when it becomes available because it will contain important information. You may obtain copies of all documents filed with the SEC regarding this transaction, free of charge, at the SEC’s website (www.sec.gov). You may also obtain these documents, free of charge, from Bank of America’s website (www.bankofamerica.com) under the tab “About Bank of America” and then under the heading “Investor Relations” and then under the item “SEC Filings”. You may also obtain these documents, free of charge, from Merrill Lynch’s website (www.ml.com) under the tab “Investor Relations” and then under the heading “SEC Filings.” 3
  • 4. Proxy Solicitation Bank of America, Merrill Lynch and their respective directors, executive officers and certain other members of management and employees may be soliciting proxies from stockholders in favor of the merger. Information regarding the persons who may, under the rules of the SEC, be considered participants in the solicitation of the stockholders in connection with the proposed merger will be set forth in the joint proxy statement/prospectus when it is filed with the SEC. You can find information about Bank of America’s executive officers and directors in its definitive proxy statement filed with the SEC on March 19, 2008. You can find information about Merrill Lynch’s executive officers and directors in its definitive proxy statement filed with the SEC on March 14, 2008. You can obtain free copies of these documents from Bank of America and Merrill Lynch using the contact information above. 4
  • 5. Creating the Premier Financial Services Provider • Merrill Lynch is a premium franchise – Leading global wealth manager – A leading global investment bank – Experienced management team • Unprecedented market environment – Significant dislocations in financial markets – Standalone investment bank model questioned – Unprecedented impacts on companies 5
  • 6. Strategic Rationale • Diversify business mix • Significant enhancement to our investment banking capabilities – Creates leading positions in • Global Debt Underwriting • Global Equities • Global M&A Advisory • Leadership position in retail brokerage and wealth management – 20,000 financial advisors (16,690 Merrill Lynch advisors) – $2.5 trillion in client assets • Brings global scale in investment management – 50% ownership stake in BlackRock with $1.4 trillion in AUMs – Columbia funds have $425 billion in AUMs (total BAC AUMs $589 billion) 6
  • 7. Coast to Coast Footprint In Bank of America footprint • 78% of U.S. population in footprint • BAC serves 59 million consumer and small business households Positioned in growth areas • Leadership positions in 15 of 20 fastest growing states • Strong retail presence in top 30 metropolitan areas Business Client Leader Affluent relationships • #1 Small Business Bank • Relationships with half of affluent • Relationships with 99% of the U.S. households in the U.S. Fortune 500 companies and • $867 billion in total client assets • 83% of the Global Fortune 500 (6/30/08) 7 Internal use only
  • 8. Strengthens Important Relationship Cornerstone Products Deposits Wealth Management • 20,000 financial advisors • $2.5 trillion in client assets Credit & Debit Home Lending Card 8
  • 9. Transaction Strengthens Bank of America’s Corporate and Investment Banking Clients Served Businesses up to Larger companies Investors $2B in revenues and sponsors Relationship Management Team Global Commercial Global Investment Capital Market Sales Bank Bank Trading Teams Capabilities Lending Lending Research Treasury Treasury Trading Management Management Financing Strategic Advice Strategic Advice Debt/Equity Capital Debt/Equity Capital Markets Markets Key 2Q08 Stats (1) 157,600 Clients 8,100 Clients 5,500 Clients $256B Loans $79B Loans $337B Trading Related Assets $102B Deposits $132B Deposits $1.1B Revenue $3.2B Revenue $1.7B Revenue (1 ) Client counts exclude LaSalle and Consumer DFS 9
  • 10. Diversifies Revenue Stream A Bank of America and Merrill combination yields a diverse business mix Bank of America Merrill Lynch 1H 08 Segment Revenue2 Mix 1H 08 Segment Revenue1 Mix Global Markets Global Markets Global Global & Investment & Investment Corporate & Corporate & Banking Global Wealth Global Wealth Banking Investment Investment Global Wealth Global Wealth 56% Management Management 56% Banking Banking & Investment & Investment 44% 44% 24% 24% Management Management 11% 11% Global Global Consumer & Consumer & Small Small Business Business 65% 65% Combined 1H 08 Segment Revenue Mix Global Global Consumer & Consumer & Small Business Global Global Small Business 48% Corporate and Corporate and 48% Inv. Banking Inv. Banking 32% 32% (1) Does not include marks and one time items Global Wealth Global Wealth (2) Fully taxable-equivalent basis: other combined with GCSBB Management Management 20% 20% 10
  • 11. Stable Merrill Lynch Core Franchise Despite Market Challenges 1H08 Net Revenues 1H08 Net Revenues Quarterly Net Revenues (Ex-Marks // FVA) (1) Quarterly Net Revenues (Ex-Marks FVA) (1) $9.6 $9.4 $9.6 $9.4 Down Only 5% from 1H06 Down Only 5% from 1H06 and Up 21% from 1H05 and Up 21% from 1H05 $8.4 $8.4 $8.3 $8.3 $7.8 $8.0 $7.7 $7.8 $8.0 $7.7 $7.5 $7.2 $7.4 $7.5 $7.2 $7.4 $6.5 $6.5 $6.5 $6.5 $6.1 $6.2 $6.1 $6.2 (2) 1Q05 2Q05 3Q05 4Q05 1Q06 2Q06 3Q06 4Q06 1Q07 2Q07 3Q07 4Q07 1Q08 2Q08 1Q05 2Q05 3Q05 4Q05 1Q06 2Q06 3Q06 4Q06 1Q07 2Q07 3Q07 4Q07 1Q08 2Q08 Quarterly average for the year ____________________ (1) Quarters are shown excluding marks, fair valuation adjustments and restructuring charges. (2) Excludes the positive net impact of the BlackRock merger. 11
  • 12. Merrill Lynch’s Diversified Business Model 2Q08 Net Revenues by Business GMI % of Net Revenues (5) (5) (Ex-marks / FVA) (1) (1) (Ex-marks) GMI GWM Investment Banking 13% GPC Equity 41%(2) (2) U.S. U.S. Markets Non-U.S. Non-U.S. 46% 46% 23% 54% 54% FICC GIM 20%(3) (3) 3% $7.5 billion (4) (Ex-marks/FVA) ____________________ (1) Pie chart percentages exclude net revenues from the Corporate segment. (2) Adjusted to exclude the net charge of $7 million related to changes in the carrying value of certain long-term debt liabilities. (3) Adjusted to exclude: (i) $6.8 billion of net write-downs primarily related to U.S. ABS CDOs, residential mortgages and the U.S. Banks investment securities portfolio exposures; (ii) negative $2.9 billion of credit valuation adjustments related to hedges with financial guarantors; and (iii) the net benefit of $98 million related to changes in the carrying value of certain long-term debt liabilities. (4) Adjusted to exclude: (i) $6.8 billion of net write-downs primarily related to U.S. ABS CDOs, residential mortgages and the U.S. Banks investment securities portfolio exposures; (ii) negative $2.9 billion of credit valuation adjustments related to hedges with financial guarantors; and (iii) the net benefit of $91 million related to changes in the carrying value of certain long-term debt liabilities. (5) Reflects 2Q08. Adjusted to exclude (i) $6.8 billion of net write-downs primarily related to U.S. ABS CDOs, residential mortgages and the U.S. Banks investment securities portfolio exposures; and (ii) $2.9 billion of credit valuation adjustments related to hedges with financial guarantors. 12
  • 13. Merrill Lynch Was Focusing on Growth in Emerging Markets • Market leader with full local capabilities, significant expansion since increasing stake in DSP Merrill Lynch to 90% India • GWM and principal investments are significant growth opportunities • One of our most successful emerging market platforms to date Brazil • Recently added leading investment banking team to further bolster local capabilities and foreign bank franchise • Building out GMI franchise to complement GWM position Middle East / • Focus on delivering fully integrated wealth management and institutional North Africa solutions to sovereign wealth clients • Opened Moscow office in January 2008, franchise build toward full GMI capabilities underway Russia • #1 in Russia M&A; 1H08 revenues 4x full-year 2007 revenues • Significant long-term growth opportunities with strategic focus on China obtaining local licenses 13
  • 14. Merrill Lynch Has a Premier Global Wealth Management Platform Growth in Financial Advisors Net New Money (Trailing Twelve Months) (1) Net New Money (Trailing Twelve Months) (1) 16,690 16,690 ($ in billions) ($ in billions) R 5% 5% CAG R C AG $55 $55 $49 $49 $38 $38 13,380 13,380 ($3) ($3) 3Q 4Q 1Q 2Q 3Q 4Q 1Q 2Q 3Q 4Q 1Q 2Q 3Q 4Q 1Q 2Q 3Q 4Q 1Q 2Q MER MS UBS C 2003 2003 2004 2004 2005 2005 2006 2006 2007 2007 2008 2008 Annualized Net Revenue per FA(1) (1) Client Assets Per FA Client Assets Per FA ($ in thousands) MER MER Avg of Competitors (1) Avg of Competitors (1) ($ in millions) ($ in millions) MER (excl. POAs & Trainees) MER (excl. POAs & Trainees) MER MER Avg of Competitors (1) Avg of Competitors (1) MER (excl. POAs & Trainees) MER (excl. POAs & Trainees) $987 $987 $806 $806 $117 $117 $707 $707 $96 $96 $86 $86 1Q06 2Q06 3Q06 4Q06 1Q07 2Q07 3Q07 4Q07 1Q08 2Q08 1Q06 2Q06 3Q06 4Q06 1Q07 2Q07 3Q07 4Q07 1Q08 2Q08 ____________________ (1) Competitor data sourced from SEC filings. Annualized quarterly revenues divided by average financial advisors as reported. Competitors reflected in Average are: Citigroup-GWM, Morgan Stanley-GWM, UBS-WMUSA and Wachovia-Retail Brokerage Services. 14
  • 15. Transaction Overview • All stock transaction based on an exchange ratio of .8595 BAC shares for each ML share ($50 billion based on 9/12/08 price) – Premium over 9/12/08 close 70% – Premium over last 5-day average 29% – Multiple of earnings • 12.1x 2009 EPS • 10.9x 2010 EPS – Multiple of tangible book 1.83x • Transaction is expected to close by end of first quarter 2009 • Necessary approvals – Shareholders of both companies – Standard regulatory approvals 15
  • 16. Transaction Financials • Used First Call estimates for 2009 & 2010 for both companies • Expense efficiencies of $7 billion pre-tax (10% combined base) – Over 20% in 2009 – Fully realized in 2012 • $450 million in amortization expense • Restructuring charges of $2.0 billion after tax • Accretion/(dilution) – 3% dilutive in 2009 – Breakeven in 2010 16
  • 17. Other Considerations • Risk – Due diligence complete – Significant progress by Merrill Lynch in reducing risk – Asset valuations carefully reviewed • Capital – Goodwill approximately $23 billion – Other intangibles $6 billion – Tier 1 impact estimated at 20 – 25 bps 17
  • 18. America’s Premier Financial Services Brand 18