Base your initial m&a to ppm, qpm, car
•
0 likes•1,149 views

The document discusses developing a measurement and analysis plan for projects. It suggests identifying what is currently known about cost, schedule, resources, risk and value delivered to customers. Metrics can measure process, product, cost and quality, with goals of facilitating control, detecting deviations and identifying improvement opportunities. Metrics views include subjective, objective, product, process and cost/quality focused. Considerations for metrics include only collecting those worth the cost and using metrics to identify improvements rather than punishment.
Report
Share


Base your initial m&a to ppm, qpm, car
- 1. Base Your Initial M&A as the Foundations of PPM, QPM, CAR
- 2. Agenda • Case Study • Measurement - Is It Really Necessary? • Developing Measurement and Analysis Plan • Measurement and Metrics • Goal Question Metric (GQM) Paradigm • Vision, Business Objectives and Measurement Objectives • Measurement and Analysis • Basic Measures • Effectiveness of Processes • Set of Standard Organizational Processes
- 3. Agenda • Slightly More Advanced Measures • Quality Factors, Quality Criteria, and Quality Metrics • Software Quality Factors • Quality Metrics • Quantitative Project Management • Path to Maturity Level 4 • Understanding Variation • Quantitative Data Analysis Methods and Tools • Causal Analysis Techniques
- 4. Utilizing Project Current Data for Better Management Decisions Increasing Project Data Usability Real Life Case Study
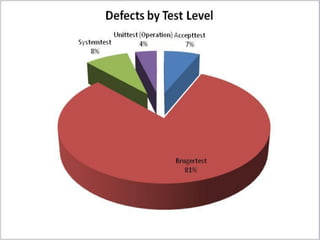
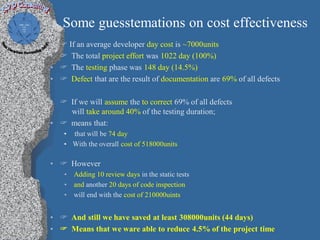
- 5. Some guesstemations on cost effectiveness • If an average developer day cost is ~7000units • The total project effort was 1022 day (100%) • The testing phase was 148 day (14.5%) • Defect that are the result of documentation are 69% of all defects • If we will assume the to correct 69% of all defects will take around 40% of the testing duration; • means that: • that will be 74 day • With the overall cost of 518000units • However • Adding 10 review days in the static tests • and another 20 days of code inspection • will end with the cost of 210000uints • And still we have saved at least 308000units (44 days) • Means that we ware able to reduce 4.5% of the project time
- 6. Unit Improvement Objectives • Improve communication among the different stakeholders • Increase system interfaces management and control efficiency • To increase insight to effort deviation for better planning
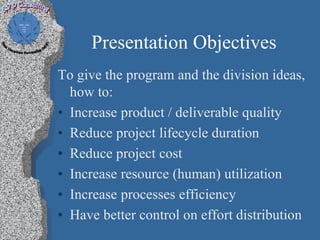
- 7. Presentation Objectives To give the program and the division ideas, how to: • Increase product / deliverable quality • Reduce project lifecycle duration • Reduce project cost • Increase resource (human) utilization • Increase processes efficiency • Have better control on effort distribution
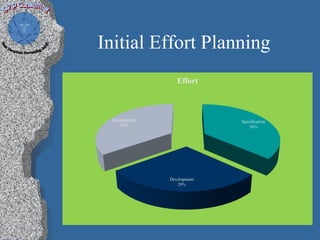
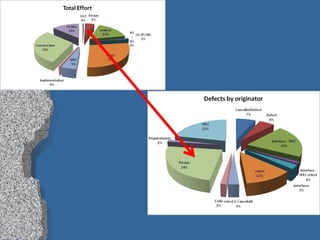
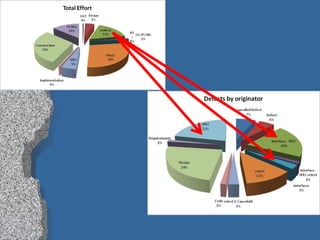
- 8. Initial Effort Planning Effort Management Specification 35% 36% Development 29%
- 9. Current Effort Distribution For all Project Phases
- 13. Let’s Try Some Mix and Match We Will Demonstrate How Relationships Between Measures Can Benefit the Organization for Better Planning and Management
- 14. Dashboard Concept Lagging Leading Management Tool 100 Quality 80 120 Scope 60 BUFFER 140 CONSUMPTION DEFECT 40 160 DISTRIBUTION 50% LONGEST CHAIN Code 20 Km/h 180 BUDGET inspection coverage 0 200 Pass Rate
- 18. Some guesstemations on cost effectiveness • If an average developer day cost is ~7000units • The total project effort was 1022 day (100%) • The testing phase was 148 day (14.5%) • Defect that are the result of documentation are 69% of all defects • If we will assume the to correct 69% of all defects will take around 40% of the testing duration; • means that: • that will be 74 day • With the overall cost of 518000units • However • Adding 10 review days in the static tests • and another 20 days of code inspection • will end with the cost of 210000uints • And still we have saved at least 308000units (44 days) • Means that we ware able to reduce 4.5% of the project time
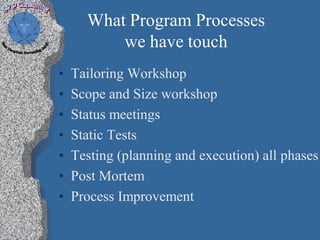
- 19. What Program Processes we have touch • Tailoring Workshop • Scope and Size workshop • Status meetings • Static Tests • Testing (planning and execution) all phases • Post Mortem • Process Improvement
- 20. CMMI Effecting PA’s • Project Planning • Project Monitor and Control • Measurement and Analysis • Validation • Verification • Requirements Development • Technical Solution • Product Integration • Organizational Process Focus
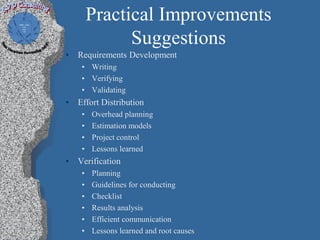
- 21. Practical Improvements Suggestions • Requirements Development • Writing • Verifying • Validating • Effort Distribution • Overhead planning • Estimation models • Project control • Lessons learned • Verification • Planning • Guidelines for conducting • Checklist • Results analysis • Efficient communication • Lessons learned and root causes
- 22. PHASE PERCENT OF EFFORT Requirements Evaluation Phase 8% Project Planning Phase 3% Analysis Phase 10% Design Phase 20% Construction Phase 32% Test Phase 23% Implementation Phase 1% Customer Support Phase 2.5% Completion Phase .5% Characteristic Level Weightage Product complexity High 1.15 Main storage constraints High 1.06 Applications experience Low 1.13 Programmer capability Low 1.17 All other characteristic Nominal 1.00 Effort Adjustment Factor 1.15 * 1.06 * 1.13 * 1.17 * 1.00 = 1.61 Activity Small Project Medium Project Large Project User Documentation 10 05 03 Project Management 25 15 10 Quality Assurance 15 10 10 User Training 10 07 02 Acceptance Testing 10 05 05 Performance Tuning 05 08 10 Totals (%age) 75 50 40
- 24. Practical Improvements Suggestions • Validation • Planning • Guidelines for conducting • Checklist • Results analysis • Efficient communication • Lessons learned and root causes • Measurements • Definition with direct line to business objectives • Measurements structures, content and context • Guidelines for collecting and ‘work with’’ • Checklist • Results analysis • Efficient communication • Lessons learned and root causes
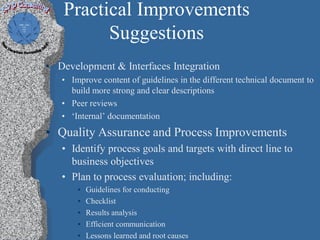
- 26. Practical Improvements Suggestions • Development & Interfaces Integration • Improve content of guidelines in the different technical document to build more strong and clear descriptions • Peer reviews • ‘Internal’ documentation • Quality Assurance and Process Improvements • Identify process goals and targets with direct line to business objectives • Plan to process evaluation; including: • Guidelines for conducting • Checklist • Results analysis • Efficient communication • Lessons learned and root causes
- 27. Measurement Is It Really Necessary?
- 28. Why to Monitor Processes ‘Cheshire Puss,’ she began, … `Would you tell me, please, which way I ought to go from here?’ ‘That depends a good deal on where you want to get to,' said the Cat. ’I don't much care where –’ said Alice. ’Then it doesn't matter which way you go,' said the Cat. ‘- so long as I get somewhere,' Alice added as an explanation. ‘Oh, you're sure to do that,' said the Cat, ‘if you only walk long enough.’ Tell me where you want to be and I will show (measure) you the way
- 29. “which way I ought to go from here” Bug Database ~33000 Records With 36 Attributes
- 30. “which way I ought to go from here” Call Center – Calls Database ~45000 Records With 22 Attributes
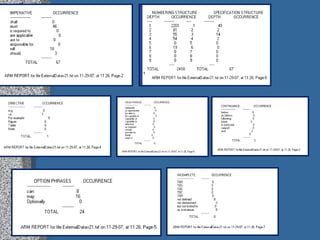
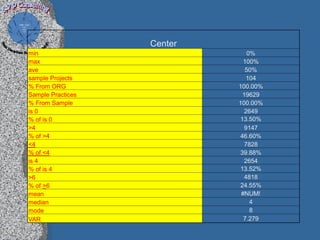
- 31. Center min 0% max 100% ave 50% sample Projects 104 % From ORG 100.00% Sample Practices 19629 % From Sample 100.00% is 0 2649 % of is 0 13.50% >4 9147 % of >4 46.60% <4 7828 % of <4 39.88% is 4 2654 % of is 4 13.52% >6 4818 % of >6 24.55% mean #NUM! median 4 mode 8 VAR 7.279
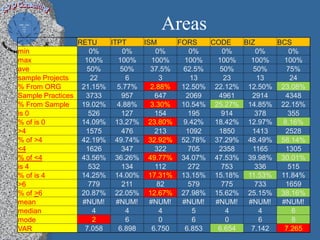
- 32. Areas RETU ITPT ISM FORS CODE BIZ BCS min 0% 0% 0% 0% 0% 0% 0% max 100% 100% 100% 100% 100% 100% 100% ave 50% 50% 37.5% 62.5% 50% 50% 75% sample Projects 22 6 3 13 23 13 24 % From ORG 21.15% 5.77% 2.88% 12.50% 22.12% 12.50% 23.08% Sample Practices 3733 957 647 2069 4961 2914 4348 % From Sample 19.02% 4.88% 3.30% 10.54% 25.27% 14.85% 22.15% is 0 526 127 154 195 914 378 355 % of is 0 14.09% 13.27% 23.80% 9.42% 18.42% 12.97% 8.16% >4 1575 476 213 1092 1850 1413 2528 % of >4 42.19% 49.74% 32.92% 52.78% 37.29% 48.49% 58.14% <4 1626 347 322 705 2358 1165 1305 % of <4 43.56% 36.26% 49.77% 34.07% 47.53% 39.98% 30.01% is 4 532 134 112 272 753 336 515 % of is 4 14.25% 14.00% 17.31% 13.15% 15.18% 11.53% 11.84% >6 779 211 82 579 775 733 1659 % of >6 20.87% 22.05% 12.67% 27.98% 15.62% 25.15% 38.16% mean #NUM! #NUM! #NUM! #NUM! #NUM! #NUM! #NUM! median 4 4 4 5 4 4 6 mode 2 6 0 6 0 6 8 VAR 7.058 6.898 6.750 6.853 6.654 7.142 7.265
- 33. Analysis Disclaimer 1 Sample Size CODE BIZ BCS 23 13 24 TREL 6 CUAC 5 EDW 8 CEBL 4 HRID 2 KRED 7 ASMA 1 PASY 4 FPAS 3 FORL 3 PRSY 2 RMS 1 SECL 4 BIS 4 CUSL 3 LOAN 1 ASFI 2 RETU ITPT ISM FORS 22 6 3 13 BKL 2 DEDA 3 KNOW 2 LL 5 REBL 6 FREM 3 TEMA 1 BPL 4 BRS 1 LPL 4 REF 7 CRMS 4 PP 2
- 34. DEVELOPING MEASUREMENT AND ANALYSIS PLAN
- 35. At Project Start, Do You Know…? • Can it be done? • How long will it take? • How much will it cost? • How many people will it take? • What is the risk? • What are the tradeoffs? • How many errors will there be?
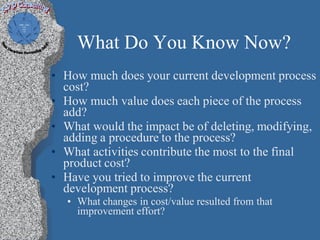
- 36. What Do You Know Now? • How much does your current development process cost? • How much value does each piece of the process add? • What would the impact be of deleting, modifying, adding a procedure to the process? • What activities contribute the most to the final product cost? • Have you tried to improve the current development process? • What changes in cost/value resulted from that improvement effort?
- 37. What Do You Know Now? - 2 • What processes represent the greatest potential for return on improvement investment? • How would you quantify the value of the process improvement investment? • Do you really want to know where the money is going in your software development projects? • What value do you think you are delivering to your customers? Do they agree? • How much is the knowledge of your costs and the value delivered worth to you?
- 38. Measurement and Metrics
- 39. Metrics • The term, ‘quality metric’, may be defined as a measure of the extent or degree to which a product possesses and exhibits a certain (quality) or characteristic. • Quality metrics deal with, for example, Number of defects, or defects per thousand lines of code – i.e., a measure of fitness for use
- 40. What Are Metrics • Quantitative measures of • Process • Product • Cost • Quality • With the goals of • Facilitating control • Detecting deviations • Identifying potential areas for improvement • Determining if you are improving
- 41. Views of Metrics • Subjective • No exact measurement • An estimate of the degree a technique is applied • A classification of a problem or experience • An indicator • Objective • An absolute measure taken on the product or process • time for development • number of lines of code (Taken from “Software Quality: How to Define, Measure, and Achieve It”, Victor Basili, Department of Computer Science, University of Maryland)
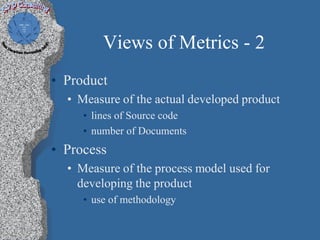
- 42. Views of Metrics - 2 • Product • Measure of the actual developed product • lines of Source code • number of Documents • Process • Measure of the process model used for developing the product • use of methodology
- 43. Views of Metrics - 3 • Cost • Expenditure of resources • staff months • capital investment • productivity • Quality • Value of the product • reliability • ease of use • maintainability
- 44. Views of Metrics - 4 • Metrics can be used to measure: • Status • Number of requirements • Number of hours spent on Quality Assurance activities • Number of errors discovered by a customer • Effectiveness • Effectiveness of Requirements Engineering process • Effectiveness of Quality Assurance activities • Effectiveness of Peer Reviews
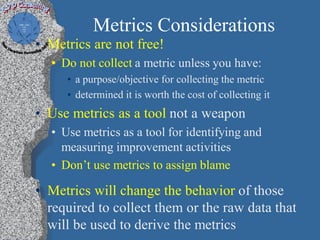
- 45. Metrics Considerations • Metrics are not free! • Do not collect a metric unless you have: • a purpose/objective for collecting the metric • determined it is worth the cost of collecting it • Use metrics as a tool not a weapon • Use metrics as a tool for identifying and measuring improvement activities • Don’t use metrics to assign blame • Metrics will change the behavior of those required to collect them or the raw data that will be used to derive the metrics
- 46. Goal Question Metric (GQM) Paradigm
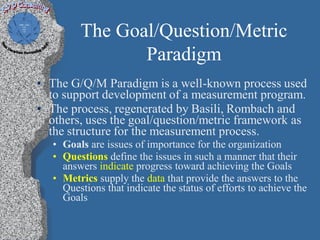
- 47. The Goal/Question/Metric Paradigm • The G/Q/M Paradigm is a well-known process used to support development of a measurement program. • The process, regenerated by Basili, Rombach and others, uses the goal/question/metric framework as the structure for the measurement process. • Goals are issues of importance for the organization • Questions define the issues in such a manner that their answers indicate progress toward achieving the Goals • Metrics supply the data that provide the answers to the Questions that indicate the status of efforts to achieve the Goals
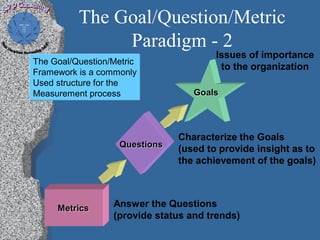
- 48. The Goal/Question/Metric Paradigm - 2 Issues of importance The Goal/Question/Metric to the organization Framework is a commonly Used structure for the Measurement process Goals Characterize the Goals Questions (used to provide insight as to the achievement of the goals) Metrics Answer the Questions (provide status and trends)
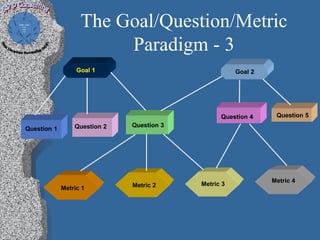
- 49. The Goal/Question/Metric Paradigm - 3 Goal 1 Goal 2 Question 4 Question 5 Modularity Question 2 Question 3 Question 1 Metric 4 Metric 2 Metric 3 Metric 1
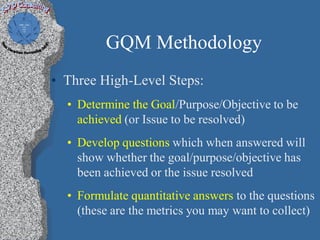
- 50. GQM Methodology • Three High-Level Steps: • Determine the Goal/Purpose/Objective to be achieved (or Issue to be resolved) • Develop questions which when answered will show whether the goal/purpose/objective has been achieved or the issue resolved • Formulate quantitative answers to the questions (these are the metrics you may want to collect)
- 51. G/Q/M Methodology - 2 • Establish the goals of the data collection • Develop a list of questions • Specify the measures to answer the questions • Collect the data • Validate and analyze the data • Apply the results to the project – Is the metric a good indicator? • Analyze measurement process for improvement
- 52. Vision, Business Objectives, and Measurement Objectives
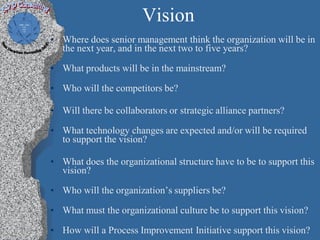
- 53. Vision • Where does senior management think the organization will be in the next year, and in the next two to five years? • What products will be in the mainstream? • Who will the competitors be? • Will there be collaborators or strategic alliance partners? • What technology changes are expected and/or will be required to support the vision? • What does the organizational structure have to be to support this vision? • Who will the organization’s suppliers be? • What must the organizational culture be to support this vision? • How will a Process Improvement Initiative support this vision?
- 54. Business Objectives • Examples of Business Objectives include: • Reduce time to market • Reduce system errors that are discovered by customers • Improve delivery time • Increase quality of products • Find and fix software defects once and only once • Reduce project risks • Gain control of suppliers • Improve service delivery • Improve service availability and capacity • Shorten find to fix repair rate
- 55. Measurement Objectives • An organization’s measurement objectives might be: • Reduce time to delivery to a specified percentage • Reduce total lifecycle costs of new products by a percentage • Deliver specified functionality by a specified increased percentage • Improve prior levels of quality by reducing the number of defects of type A that get shipped with the product • Improve prior customer satisfaction ratings by a specified percentage compared to past ratings
- 56. Measurement and Analysis vs. Project Monitoring and Control • Understanding the organization’s business objectives and the project’s information needs based on those organization’s business objectives as well as its own information needs or project’s business objectives, is the first major requirement for establishing the organization’s measurement foundation • Without this, measurement gets reduced to status information that is normally collected through project monitoring and control
- 58. Measurement and Analysis Overview • A measurement initiative involves the following: • Specifying the objectives of measurement and analysis such that they are aligned with established information needs and business objectives • Defining the measures to be used, the data collection process, the storage mechanisms, the analysis processes, the reporting processes, and the feedback processes
- 59. Sources of Information Needs • Project plans • Monitoring of project performance • Established management objectives at the organizational level or project level • Strategic plans • Business plans • Formal requirements or contractual obligations • Recurring or other troublesome management or technical problems • Experiences of other projects or organizational entities • External industry benchmarks • Process improvement plans at the organizational and project level
- 60. Sources of Information Needs - 2 • What is it about the project plans or technical problems or experiences of other projects or external industry benchmarks like CMMI appraisals that suggests an information need? • Have our ongoing project has not been meeting their delivery dates? • Have other projects have not been able to meet the functionality promises that were made? • Have technical problems that have reached production caused significant rework and customer dissatisfaction?
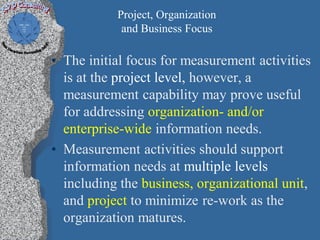
- 61. Project, Organization and Business Focus • The initial focus for measurement activities is at the project level, however, a measurement capability may prove useful for addressing organization- and/or enterprise-wide information needs. • Measurement activities should support information needs at multiple levels including the business, organizational unit, and project to minimize re-work as the organization matures.
- 62. Establish Measurement Objectives • While establishing measurement objectives, a project/organization should: • Document the purposes for which measurement and analysis is done • Specify the kinds of actions that may be taken based on the results of the data analyses • Continually ask the question – what value will this measurement be to those people who will be asked to supply the raw measurement data and who will receive the analyzed results – “Why are we measuring this?” • Maintain traceability of the proposed measurement objectives to the information needs and business objectives • Ensure business objectives are developed with clear “WHYs” this measure will support the business and quality goals of the organization
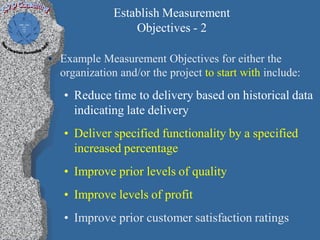
- 63. Establish Measurement Objectives - 2 • Example Measurement Objectives for either the organization and/or the project to start with include: • Reduce time to delivery based on historical data indicating late delivery • Deliver specified functionality by a specified increased percentage • Improve prior levels of quality • Improve levels of profit • Improve prior customer satisfaction ratings
- 64. Establish Measurement Objectives - 3 • Example Measurement Objectives for either the organization and/or the project with more emphasis on quantitative measures include: • Reduce time to delivery to a specified percentage • Reduce total lifecycle costs of new products by a percentage • Deliver specified functionality by a specified increased percentage • Improve prior levels of quality by reducing the number of defects of type A that get shipped with the product • Improve prior customer satisfaction ratings by a specified percentage compared to past ratings • Refer to Organizational Process Performance SP 1.3
- 65. Project’s Measurement Objectives Customer Demands Organization’s Competition Measurement Demands Objectives New Technologies Opportunities Past Project Quality Defects Quality Goals Project’s Measurement Objectives
- 66. Example: Project’s Measurement Objectives • Project Managers should develop their project’s measurement objectives from their individual information needs – not one objective for all projects • Reduce open problem reports that come from the field when the product is released through more and better conducted Inspections and formal Unit Testing • Increase defect detection found earlier in the product and system lifecycle through Systems Test in order to reduce the “Time to Delivery” • Increase the number of Peer Reviews in order to reduce the number of defects of Type A that has been shipped in previous releases • Reduce the number of maintenance releases to the field through detection and removal of an increased percentage of Major defects that reduces bottom-line profit • Decrease the defect density of components, products and systems in order to “Reduce the Cost of Poor Quality
- 67. Base & Derived Measures • Base Measure • A distinct property or characteristic of an entity and the method for quantifying it. • Derived Measure • Data resulting from the mathematical function of two or more base measures.
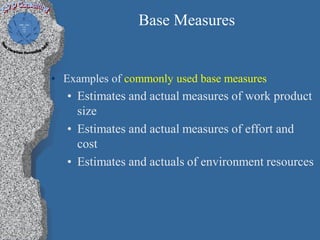
- 68. Base Measures • Examples of commonly used base measures • Estimates and actual measures of work product size • Estimates and actual measures of effort and cost • Estimates and actuals of environment resources
- 69. Derived Measures • Define how data can and will be derived from other measures • Data may be generated from derived measures which are based on combinations of data that were collected for the defined basic measures • Derived measures typically are expressed as ratios, composite indices, or other aggregate summary measures • Derived measures are often more quantitatively reliable and meaningfully interpretable than the base measures used to construct them • Moving from attribute (ordinal or interval data) to continuous or ratio data – SEE NEXT SLIDE!
- 70. Data Types Types of Data Description Examples Attribute or Categorical Data Nominal Categories or Defect types buckets of data Language types with no ordering Customers Document types Ordinal Categories or Severity ratings buckets of data Priority ratings with ordering Customer Satisfaction ratings High, Medium, or Low ratings Continuous Data Interval Data measured on Productivity a scale that has Defect Density equal intervals Preparation Rate Cycle Time Size Test Hours Ratio Interval data that has an absolute zero From SEI Designing Products and Processes Using Six Sigma Basic Statistics Reference - 4
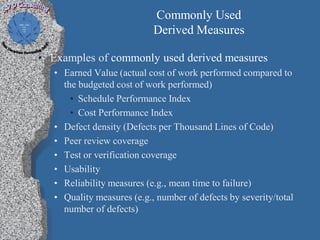
- 71. Commonly Used Derived Measures • Examples of commonly used derived measures • Earned Value (actual cost of work performed compared to the budgeted cost of work performed) • Schedule Performance Index • Cost Performance Index • Defect density (Defects per Thousand Lines of Code) • Peer review coverage • Test or verification coverage • Usability • Reliability measures (e.g., mean time to failure) • Quality measures (e.g., number of defects by severity/total number of defects)
- 72. Specify Data Collection and Storage Procedures • Specify how to collect and store the data for each required measure • Make explicit specifications of how, where, and when the data will be collected • Develop procedures for ensuring that the data collected is valid data • Ensure that the data is stored such that it is easily accessed, retrieved, and restored as needed
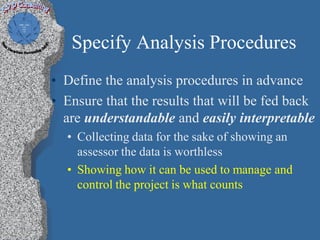
- 73. Specify Analysis Procedures • Define the analysis procedures in advance • Ensure that the results that will be fed back are understandable and easily interpretable • Collecting data for the sake of showing an assessor the data is worthless • Showing how it can be used to manage and control the project is what counts
- 74. Specify Analysis Procedures - 2 •Visual Display and Other Presentation Techniques •Bar Charts •Pie Charts •Radar Charts (Kiviat Diagrams) •Line Graphs •Scatter Diagrams •Check Lists •Interrelationship Diagraphs
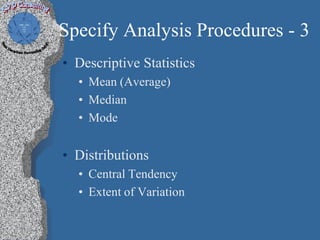
- 75. Specify Analysis Procedures - 3 • Descriptive Statistics • Mean (Average) • Median • Mode • Distributions • Central Tendency • Extent of Variation
- 76. Collect Measurement Data • Collect the measurement data as defined, at the points in the process that were agreed to, according to the time scale established • Generate data for derived measures • Perform integrity checks as close to the source of the data as possible
- 77. Analyze the Measurement Data • Conduct the initial analyses • Interpret the results and make preliminary conclusions from explicitly stated criteria • Conduct additional measurement and analyses passes as necessary to gain confidence in the results • Review the initial results with all stakeholders • Prevents misunderstandings and rework • Improve measurement definitions, data collection procedures, analyses techniques as needed to ensure meaningful results that support business objectives
- 78. Store the Measurement Data and Analyses Results • The stored information should contain or reference the information needed to: • Understand the measures • Assess them for reasonableness and applicability • The stored information should also: • Enable the timely and cost effective future use of the historical data and results • Provide sufficient context for interpretation of the data, measurement criteria, and analyses results
- 79. Communicate the Measurement Results • Keep the relevant stakeholders up-to-date about measurement results on a timely basis • Follow up with those who need to know the results • Increases the likelihood that the reports will be used • Assist the relevant stakeholders in understanding and interpreting the measurement results
- 80. Measurement and Analysis Tools • Incorporate tools used in performing Measurement and Analysis activities such as: • Statistical packages • Database packages • Spreadsheet programs • Graphical or Visualization packages • Packages that support data collection over networks and the internet
- 81. Measurement and Analysis Training • Provide training to all people who will perform or support the Measurement and Analysis process • Data collection, analyses, and reporting processes • Measurement tools • Goal-Question-Metric Paradigm • How to establish measures • how to determine efficiency and effectiveness • Quality factors measures (e.g., maintainability, expandability) • Basic and advanced statistical techniques
- 82. Basic Measures
- 83. Basic Measures • Estimate Size and/or Complexity - a relative level of difficulty or complexity should be assigned for each size attribute • Examples of attributes to estimate for Systems Engineering include: • Number of logic gates • Number of interfaces • Examples of size measurements for Software Engineering include: • Function Points • Lines of Code • Number of requirements
- 84. Basic Measures - 2 • Determine effort and cost • Historical data or models are applied to planning parameters to determine the project effort and cost based on the size and complexity estimations • Scaling data should also be applied to account for differing sizes and complexity • Establish the project’s schedule based on the size and complexity estimations • Include, or at least consider, infrastructure needs such as critical computer resources • Identify risks associated with the cost, resources, schedule, and technical aspects of the project • Control data (various forms of documentation) required to support a project in all of its areas.
- 85. Basic Measures – 3 • Identify the knowledge and skills needed to perform the project according to the estimates • Select and implement methods for providing the necessary knowledge and skills • Training (Internal and External) • Mentoring • Coaching • On-the-job application of learned skills • Monitor staffing needs – based on effort required and the necessary knowledge and skills to achieve the defined tasks
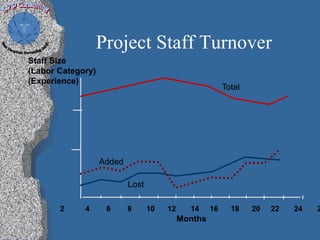
- 86. Project Staff Turnover Staff Size (Labor Category) (Experience) Total Added Lost 2 4 6 8 10 12 14 16 18 20 22 24 2 Months
- 87. Basic Measures - 4 • The number and frequency of problems and defects in a product are inversely proportional to its quality • Problems and defects are among the few direct measures of processes and products • Tracking them provides objective insight into trends in discovery rates, repairs, process and product issues, and responsiveness to customers • The measures also provide the foundation for quantifying several of the quality attributes — maintainability, expandability, reliability, correctness, completeness
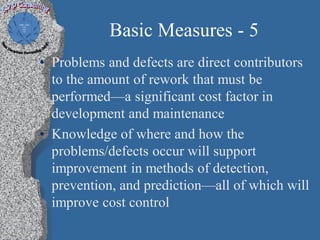
- 88. Basic Measures - 5 • Problems and defects are direct contributors to the amount of rework that must be performed—a significant cost factor in development and maintenance • Knowledge of where and how the problems/defects occur will support improvement in methods of detection, prevention, and prediction—all of which will improve cost control
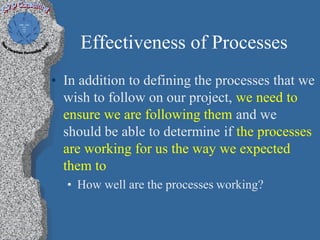
- 90. Effectiveness of Processes • In addition to defining the processes that we wish to follow on our project, we need to ensure we are following them and we should be able to determine if the processes are working for us the way we expected them to • How well are the processes working?
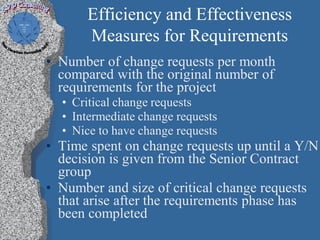
- 91. Efficiency and Effectiveness Measures for Requirements • Number of change requests per month compared with the original number of requirements for the project • Critical change requests • Intermediate change requests • Nice to have change requests • Time spent on change requests up until a Y/N decision is given from the Senior Contract group • Number and size of critical change requests that arise after the requirements phase has been completed
- 92. Efficiency and Effectiveness Measures for Requirements - 2 • Impact of the change requests on project progress - effort spent on the change requests versus the amount of effort to execute the original project • Actual cost of processing a change request compared with budgeted or predicted costs • Actually make the change • Filling in the forms • Impact Analysis • Authorization • Replanning
- 93. Efficiency and Effectiveness Measures for Requirements - 3 • Rescheduling • Re-negotiating commitments • SQA effort • SCM effort • Test effort • Number of change requests accepted versus the total number of change requests during the project’s lifetime • Number of change requests accepted but not implemented in a given time frame
- 94. Set of Standard Organizational Processes
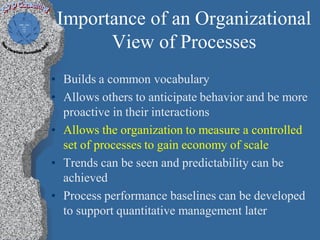
- 95. Importance of an Organizational View of Processes • Builds a common vocabulary • Allows others to anticipate behavior and be more proactive in their interactions • Allows the organization to measure a controlled set of processes to gain economy of scale • Trends can be seen and predictability can be achieved • Process performance baselines can be developed to support quantitative management later
- 96. Organizational Measurement Repository • Develop an organization measurement repository - include: • Product and process measures that are related to the organization’s set of standard processes • The related information needed to understand and interpret the measurement data and asses it for reasonableness and applicability • Develop operational definitions for the measures to specify the point in the process where the data will be collected and for the procedures for collecting valid data
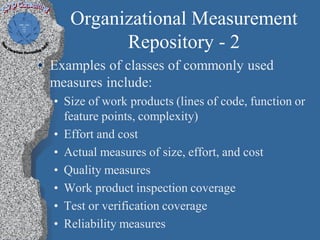
- 97. Organizational Measurement Repository - 2 • Examples of classes of commonly used measures include: • Size of work products (lines of code, function or feature points, complexity) • Effort and cost • Actual measures of size, effort, and cost • Quality measures • Work product inspection coverage • Test or verification coverage • Reliability measures
- 98. Slightly More Advanced Measures
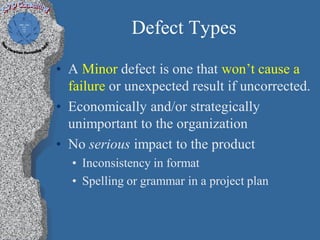
- 99. Defect Types • A Minor defect is one that won’t cause a failure or unexpected result if uncorrected. • Economically and/or strategically unimportant to the organization • No serious impact to the product • Inconsistency in format • Spelling or grammar in a project plan
- 100. Defect Types - 2 • A Major defect is one that could cause a failure or unexpected result if uncorrected. • For documents it is major if it could cause the user to make a mistake. • A Major Defect can have a negative impact on factors such as: • Cost • Schedule • Performance • Quality • Risk • Customer Satisfaction • Each organization must define for itself what a major defect is in relation to Inspections and Structured Walkthroughs
- 101. Classification Examples • Logic (LO) – Some aspect of logic was omitted or implemented incorrectly in the product • Duplicate Logic • Extreme Conditions Neglected • Unnecessary Function • Missing Condition Test • Computational Problem (CP) – Some aspect of an algorithm was incorrectly coded • Interface (IF) – Some aspect of the software or hardware interfaces does not function properly • Example: Interface defects between two programs, between two systems, or the interface between a user and the system
- 102. Classification Examples - 2 • Data Handling Problem (DH) – Some aspect of data manipulation was handled incorrectly • Quality Factors (QF) – Quality factors such as reliability, maintainability, expandability or interoperability are not defined or defined incorrectly • Verification and validation activities will not be able to show the system exhibits the quality characteristics that are required • Process Failure (PF) – This defect is a direct result of a failure in the product development process
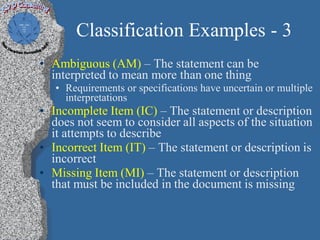
- 103. Classification Examples - 3 • Ambiguous (AM) – The statement can be interpreted to mean more than one thing • Requirements or specifications have uncertain or multiple interpretations • Incomplete Item (IC) – The statement or description does not seem to consider all aspects of the situation it attempts to describe • Incorrect Item (IT) – The statement or description is incorrect • Missing Item (MI) – The statement or description that must be included in the document is missing
- 104. Classification Examples - 4 • Conflicting Items (CF) – Two or more statements or descriptions conflict or contradict each other. • Redundant Items (RD) – The statement repeats another statement and detracts from clarity rather than enhancing it • Illogical Item (IL) – The statement does not make sense in reference to other statements within the same document or other documents to which it refers • Non-Verifiable Item (NV) – The statement (usually a requirement) or functional description cannot be verified by any reasonable testing method
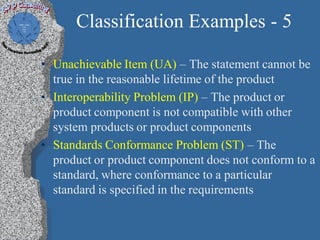
- 105. Classification Examples - 5 • Unachievable Item (UA) – The statement cannot be true in the reasonable lifetime of the product • Interoperability Problem (IP) – The product or product component is not compatible with other system products or product components • Standards Conformance Problem (ST) – The product or product component does not conform to a standard, where conformance to a particular standard is specified in the requirements
- 106. Defects Discovered During Testing • Effectiveness - Number of Major defects found in a particular testing phase or instantiation of a testing phase compared to the total number of defects found during testing • Number of defects projected to escape from the current testing phase
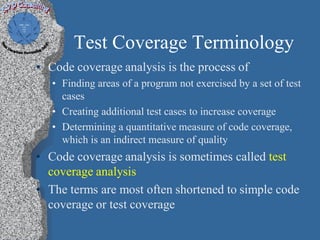
- 107. Test Coverage Terminology • Code coverage analysis is the process of • Finding areas of a program not exercised by a set of test cases • Creating additional test cases to increase coverage • Determining a quantitative measure of code coverage, which is an indirect measure of quality • Code coverage analysis is sometimes called test coverage analysis • The terms are most often shortened to simple code coverage or test coverage
- 108. Quality Factors, Quality Criteria, and Quality Metrics
- 109. The “Ilities” of Software Quality Correctness......................................Does the software comply with the requirements? Efficiency..........................................How much resource is needed? Expandability................................... How easy is it to expand the software? Flexibility.......................................... How easy is it to change it? Integrity.............................................How secure is it? Interoperability.................................Does it interface easily? Manageability................................... Is it easily managed? Software Quality Maintainability..................................How easy is it to repair? Portability......................................... How easy is it to transport? Usability............................................How easy is it to use? Reliability..........................................How often will it fail? Reusability........................................Is it reusable in other systems? Safety................................................ Does it prevent hazards? Survivability..................................... Can it survive during failure? Verifiability....................................... Is performance verification easy?
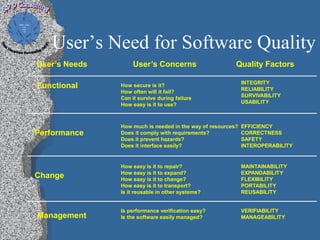
- 110. User’s Need for Software Quality User’s Needs User’s Concerns Quality Factors INTEGRITY Functional How secure is it? RELIABILITY How often will it fail? SURVIVABILITY Can it survive during failure How easy is it to use? USABILITY How much is needed in the way of resources? EFFICIENCY Performance Does it comply with requirements? CORRECTNESS Does it prevent hazards? SAFETY Does it interface easily? INTEROPERABILITY How easy is it to repair? MAINTAINABILITY How easy is it to expand? EXPANDABILITY Change How easy is it to change? FLEXIBILITY How easy is it to transport? PORTABILITY Is it reusable in other systems? REUSABILITY Is performance verification easy? VERIFIABILITY Management Is the software easily managed? MANAGEABILITY
- 112. Quality Factors Correctness Portability Efficiency Reliability Expandability Reusability Flexibility Safety Integrity Survivability Interoperability Usability Maintainability Verifiability Manageability
- 113. Anomaly Management • The software is said to have Anomaly Management built in if it can detect and recover from such error conditions rather than disrupting processing or halting • The software should be designed for survivability when faced with software or hardware failure
- 114. Anomaly Management - 2 • Anomaly Management includes detection and containment of, and recovery from: • Improper input data • Computational failures • Hardware faults • Device failures • Communication errors • Suggestions and questions for achieving required levels of anomaly management: • Does a documented requirements statement exist for the error tolerance of input data?
- 115. Anomaly Management - 3 • Is there a range for input values and is this checked? • Are conflicting requests and illegal combinations identified and checked? • Is all input data available for processing and is it checked before processing is begun? • Is there a requirement for recovery from computational failures? • Are there alternative means to continue execution in the presence of errors?
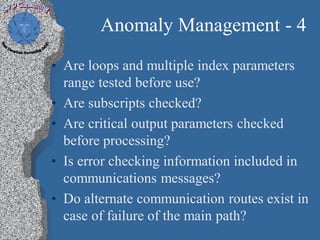
- 116. Anomaly Management - 4 • Are loops and multiple index parameters range tested before use? • Are subscripts checked? • Are critical output parameters checked before processing? • Is error checking information included in communications messages? • Do alternate communication routes exist in case of failure of the main path?
- 117. Quality Metrics
- 118. Quality Metrics Examples (Reliability) • Reliability • Accuracy checks to see that the results produced by software is within required accuracy tolerances • Do mathematical libraries exist for all mathematical calculations to achieve the precision requirements? • Count the number of different data representations - the lower the count, the higher the probability of achieving accuracy • Count the number of data representation conversions - the lower the count, the higher the probability of achieving accuracy
- 119. Quality Metrics Examples (Reliability) - 2 • Reliability • Anomaly Management checks if the system can detect and recover from error conditions rather than disrupting processing or halting? • determine if all input values accepted by a module has a range of accepted values and if this is checked before further processing • determine if all loop parameters are range tested before execution • Do alternate communication paths exist in case of failure of the main path?
- 120. Quality Metrics Examples (Reliability) -3 • Reliability - continued • Simplicity can be measured using • McCabe’s cyclomatic complexity • counting minimum number of statements per module, minimum number of module interfaces, etc. • counting the number of Go To's • counting nesting levels beyond three • A simple metric is to assess the number of errors per delivered lines of code
- 121. Quality Metrics Examples (Portability) • Portability • Independence • count number of references to underlying operating system • count number of expressions dependent on word size • count number of calls to software system library routines
- 122. Quality Metrics Examples (Portability) -2 • Portability - continued • Modularity • count number of times local data is accessed from outside the module where it resides • count number of times output data is not returned to the calling unit • count number of times that units are not separately compilable
- 123. Quality Metrics Examples (Portability) -3 • Portability - continued • Self-descriptiveness • count the number of modules that are written according to organization standards • examine the comments on global data definitions - count deviations from standards • count the number of decision points and transfers of control that do not have comments provided • count the number of Block and Indentation Guidelines that have been violated
- 124. Quality Metrics Examples (Portability) -4 • Portability - continued • Support • count the number of trouble reports closed before Delivery • count how many modules are able to be tested through automated testing techniques • Does a reuse library exist? • count the number or percentage of modules in the library that are reused • Does a database of test software exist?
- 125. Quantitative Project Management
- 126. Quantitative Management Concepts •When higher degrees of quality and performance are demanded, the organization and projects must determine if they have the ability to improve the necessary processes to satisfy the increased demands •Achieving the necessary quality and process performance objectives requires stabilizing the processes or subprocesses that contribute most to the achievement of the objectives •Assuming the technical requirements can be met, the next decision is to determine if it is cost effective
- 127. Path to Maturity Level 4
- 128. Why Is Early Consideration of Quantitative Management Important? • Measurements needed for performing quantitative management may (or may not) be different from measurements needed for analysis performed with defined processes • To perform quantitative management, analysis of a history of measurement data is required • Delaying consideration of measurement needs for quantitative management will impact the existing measurement program
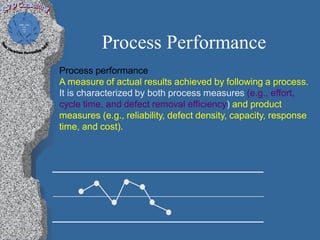
- 129. Process Performance Process performance A measure of actual results achieved by following a process. It is characterized by both process measures (e.g., effort, cycle time, and defect removal efficiency) and product measures (e.g., reliability, defect density, capacity, response time, and cost).
- 130. Process Performance - 2 • The organizational data for these measures are analyzed to establish a distribution and range of results, which characterize the expected performance of the process when used on any individual project in the organization • The expected process performance can be used in establishing the project’s quality and process-performance objectives and can be used as a baseline against which actual project performance can be compared. • This information is used to quantitatively manage the project
- 131. Select Processes for Process Performance Analysis • Selection of the processes and/or subprocesses is based on the needs and objectives of both the organization and projects • Examples of criteria which may be used for the selection of a process or subprocess for organizational analysis include the following: • The relationship of the subprocess to key business objectives • Current availability of valid historical data relevant to the subprocess • The current degree of variability of this data • Subprocess stability
- 132. Attribute, Scale, Objective An Objective gives direction to an Attribute (Product or Performance) Objective or Attribute / Characteristic Performance Requirement an attribute is quantified on a scale of measure The “how much” of an Objective can be expressed as a point on a Scale of Measure, to be reached at a certain point in the future. Measure / Scale of Measure A metric contains various attributes, including: Scale, measurement method, measuring attributes, storage method Metric
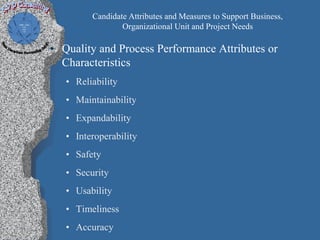
- 133. Candidate Attributes and Measures to Support Business, Organizational Unit and Project Needs • Quality and Process Performance Attributes or Characteristics • Reliability • Maintainability • Expandability • Interoperability • Safety • Security • Usability • Timeliness • Accuracy
- 134. Candidate Attributes and Measures to Support Business, Organizational Unit and Project Needs - 2 • Product Quality Measures • Critical Resource Utilization • Number, category, and severity of defects in the released product • Number, category, and severity of customer complaints • Reduced percentage on time to delivery • Reduced total lifecycle on cost • Mean time to failure
- 135. Candidate Attributes and Measures to Support Business, Organizational Unit and Project Needs - 3 • Process Performance Measures • Cycle time • Percentage of defects removed by type of verification activity • Peer Review coverage • Test coverage • Peer Review Effectiveness • Test Effectiveness • Defect escape rates • Defect removal efficiency • Number and density of defects (by severity) found during the first yea following product delivery • Rework time as a percentage of total project life-cycle time
- 136. Selecting the Subprocesses To Be Statistically Managed • Criteria should be established to identify which subprocesses are the main contributors to achieving the identified quality and process performance objectives and for which predictable performance is important • Identify the product and process attributes of the selected subprocesses that will be measured and controlled • Defect density • Cycle time • Test coverage
- 137. Understanding Variation Understanding Variation The Key to Managing Chaos Donald J. Wheeler, SPC Press, 2000
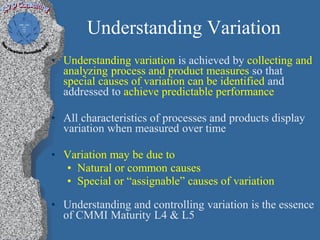
- 138. Understanding Variation • Understanding variation is achieved by collecting and analyzing process and product measures so that special causes of variation can be identified and addressed to achieve predictable performance • All characteristics of processes and products display variation when measured over time • Variation may be due to • Natural or common causes • Special or “assignable” causes of variation • Understanding and controlling variation is the essence of CMMI Maturity L4 & L5
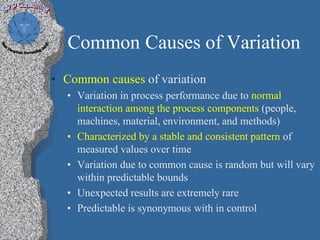
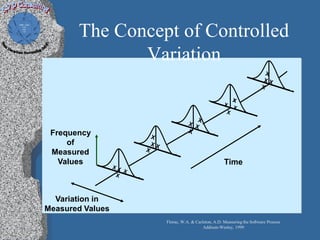
- 139. Common Causes of Variation • Common causes of variation • Variation in process performance due to normal interaction among the process components (people, machines, material, environment, and methods) • Characterized by a stable and consistent pattern of measured values over time • Variation due to common cause is random but will vary within predictable bounds • Unexpected results are extremely rare • Predictable is synonymous with in control
- 140. The Concept of Controlled Variation Frequency of Measured Values Variation in Measured Values Florac, W.A. & Carleton, A.D. Measuring the Software Process Addison-Wesley, 1999
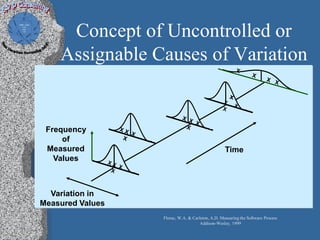
- 141. Special Causes of Variation • Special or Assignable causes of variation • Arise from events that are not part of the normal process • Represent sudden or persistent abnormal changes due to one or more of the process components • inputs to the process • environment • process steps themselves • the way the process steps are executed • Examples of assignable causes of variation include inadequately trained people, tool failures, failures to follow the process
- 142. Concept of Uncontrolled or Assignable Causes of Variation Frequency of Measured Values Variation in Measured Values Florac, W.A. & Carleton, A.D. Measuring the Software Process Addison-Wesley, 1999
- 143. Process Variation • Reducing process variation is an important aspect to quantitative management: • It is important to focus on subprocesses that can be controlled to achieve a predictable performance • Statistical process control is often better focused on organizational areas such as Product Lines where there is high similarity of processes, than on the organization’s entire set of products
- 144. Quantitative Data Analysis Methods and Tools
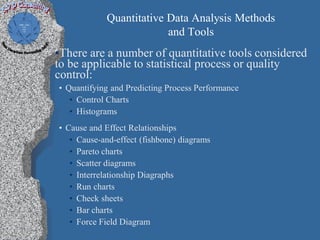
- 145. Quantitative Data Analysis Methods and Tools •There are a number of quantitative tools considered to be applicable to statistical process or quality control: • Quantifying and Predicting Process Performance • Control Charts • Histograms • Cause and Effect Relationships • Cause-and-effect (fishbone) diagrams • Pareto charts • Scatter diagrams • Interrelationship Diagraphs • Run charts • Check sheets • Bar charts • Force Field Diagram
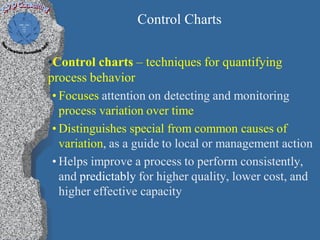
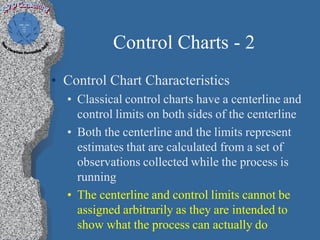
- 146. Control Charts •Control charts – techniques for quantifying process behavior • Focuses attention on detecting and monitoring process variation over time • Distinguishes special from common causes of variation, as a guide to local or management action • Helps improve a process to perform consistently, and predictably for higher quality, lower cost, and higher effective capacity
- 147. Control Charts - 2 • Control Chart Characteristics • Classical control charts have a centerline and control limits on both sides of the centerline • Both the centerline and the limits represent estimates that are calculated from a set of observations collected while the process is running • The centerline and control limits cannot be assigned arbitrarily as they are intended to show what the process can actually do
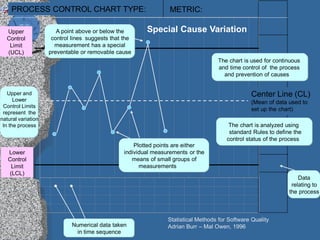
- 148. PROCESS CONTROL CHART TYPE: METRIC: Upper A point above or below the Special Cause Variation Control control lines suggests that the Limit measurement has a special (UCL) preventable or removable cause The chart is used for continuous and time control of the process and prevention of causes Upper and Center Line (CL) Lower (Mean of data used to Control Limits set up the chart) represent the natural variation In the process The chart is analyzed using standard Rules to define the control status of the process Plotted points are either Lower individual measurements or the Control means of small groups of Limit measurements (LCL) Data relating to the process Statistical Methods for Software Quality Numerical data taken Adrian Burr – Mal Owen, 1996 in time sequence
- 149. Causal Analysis Techniques
- 150. Conduct Causal Analysis • Analyze defect data in the processes and associated work products • When a stable process does not meet its specified product quality, service quality, or process performance objectives • During the task, if and when problems demand additional meetings • When a work product exhibits an unexpected deviation from its requirements • Analyze the selected defects and other problems to determine their root causes
- 151. Conduct Causal Analysis - 2 • Examples of methods for determining causes and other relationships that exist among critical issues include: • Cause and Effect (Fishbone Diagrams) • Pareto analysis • Scatter Diagrams • Run charts • Interrelationship Diagraphs • Check Sheets • Bar Charts • Force Fields
- 152. Cause and Effect Diagrams (Fishbone) Vague Incorrect Missing Requirement Requirement Requirement Req’mts Defects Infeasible Customer Requirement Requirement Changed
- 153. Pareto Charts • Percentage of Defects Detected During System Testing by Phase Where Defect Was Injected 60 50 50 40 30 25 20 20 10 5 0 Req'mts Design Code Test
- 154. Scatter Diagrams
- 155. Run Charts - 2 Number of Required Changes to a Module as the Project Approaches Systems Test Syntax Desk Code Unit Integration Systems Check Check Review Test and Test Test
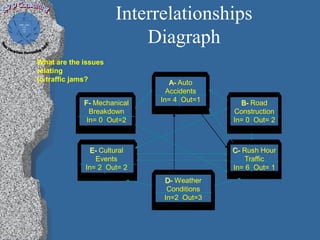
- 156. Interrelationships Diagraph What are the issues relating to traffic jams? A- Auto Accidents F- Mechanical In= 4 Out=1 B- Road Breakdown Construction In= 0 Out=2 In= 0 Out= 2 E- Cultural C- Rush Hour Events Traffic In= 2 Out= 2 In= 6 Out= 1 D- Weather Conditions In=2 Out=3
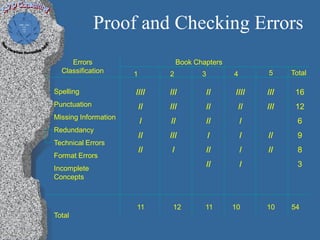
- 157. Proof and Checking Errors Errors Book Chapters Classification 1 2 3 4 5 Total Spelling //// /// // //// /// 16 Punctuation // /// // // /// 12 Missing Information / // // / 6 Redundancy // /// / / // 9 Technical Errors // / // / // 8 Format Errors Incomplete // / 3 Concepts 11 12 11 10 10 54 Total
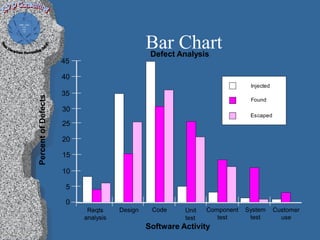
- 158. Bar Analysis Defect Chart 45 40 Injected 35 Percent of Defects Found 30 Escaped 25 20 15 10 5 0 Reqts Design Code Unit Component System Customer analysis test test test use Software Activity
- 159. Summary • Evolving a Measurement Program for Systems / Software Engineering Process Improvement includes: • Clearly defining the need for a measurement program • Establishing a measurement initiative with objectives that are aligned with established information needs and business objectives • Ensuring basic measures are included for planning, tracking, and taking corrective action as necessary • Incorporating process effectiveness measures • Establishing organizational standard processes
- 160. Summary - 2 • Establish and utilize measures such as peer review measures, testing measures, and risk management measures • Evolve into project management based on a quantitative understanding of the organization’s and project’s defined processes
- 161. Questions ?
- 162. Contact Kobi Vider K.V.P Consulting Kobi.Vider@hotmail.com KobiVP@aol.com Phone: +972522946676