Biodiversity Mainstreaming through National Policies and Legislation
- 1. BIODIVERSITY MAINSTREAMING THROUGH NATIONAL POLICIES AND LEGISLATION Katia Karousakis, PhD Biodiversity Team Leader OECD Environment Directorate FAO Multi-stakeholder Dialogue on Biodiversity Mainstreaming 29-30 May 2018 – Rome, Italy
- 2. • Biodiversity and ecosystem services foster productive capacities of agriculture, forestry and fisheries • Sectors offer large potential for solutions – but also exert significant pressures on biodiversity • Need to address environmental externalities to ensure sustainable development Interdependencies between biodiversity and agriculture, forestry, fisheries
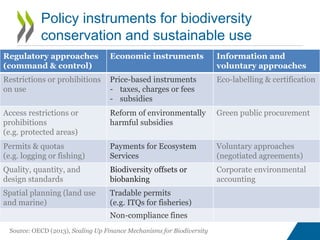
- 3. Regulatory approaches (command & control) Economic instruments Information and voluntary approaches Restrictions or prohibitions on use Price-based instruments - taxes, charges or fees - subsidies Eco-labelling & certification Access restrictions or prohibitions (e.g. protected areas) Reform of environmentally harmful subsidies Green public procurement Permits & quotas (e.g. logging or fishing) Payments for Ecosystem Services Voluntary approaches (negotiated agreements) Quality, quantity, and design standards Biodiversity offsets or biobanking Corporate environmental accounting Spatial planning (land use and marine) Tradable permits (e.g. ITQs for fisheries) Non-compliance fines Policy instruments for biodiversity conservation and sustainable use Source: OECD (2013), Scaling Up Finance Mechanisms for Biodiversity
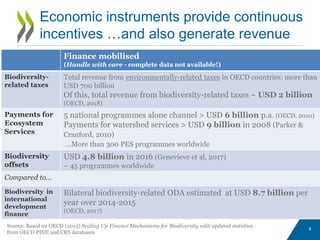
- 4. Finance mobilised (Handle with care - complete data not available!) Biodiversity- related taxes Total revenue from environmentally-related taxes in OECD countries: more than USD 700 billion Of this, total revenue from biodiversity-related taxes ~ USD 2 billion (OECD, 2018) Payments for Ecosystem Services 5 national programmes alone channel > USD 6 billion p.a. (OECD, 2010) Payments for watershed services > USD 9 billion in 2008 (Parker & Cranford, 2010) …More than 300 PES programmes worldwide Biodiversity offsets USD 4.8 billion in 2016 (Genevieve et al, 2017) ~ 45 programmes worldwide Compared to… Biodiversity in international development finance Bilateral biodiversity-related ODA estimated at USD 8.7 billion per year over 2014-2015 (OECD, 2017) 4 Economic instruments provide continuous incentives …and also generate revenue Source: Based on OECD (2013) Scaling Up Finance Mechanisms for Biodiversity with updated statistics from OECD PINE and CRS databases
- 5. • Increase in MPA coverage – expected to reach 10% by 2020 • Design could be improved to better target areas with highest biodiversity benefits, highest pressures and lowest opportunity cost • Need better MRV and understanding of distributional implications • Integrate into Marine Spatial Planning and devise effective policy mixes to address multiple pressures Marine Protected Areas Source: OECD (2017) Marine Protected Areas: Economics, Management and Effective Policy Mixes
- 6. Number of countries with at least one ITQ for fisheries Source: OECD PINE database OECD Policy Instruments for Environment (PINE) database: 80+ countries Instruments covered: taxes fees and charges subsidies tradable permits voluntary instruments All countries welcome to contribute to the OECD PINE database
- 7. Biodiversity-relevant taxes 0 5 10 15 20 25 30 35 1980 1985 1990 1995 2000 2005 2010 2015 Numberofcountries Number of biodiversity-relevant taxes: 97 Amount of revenue mobilised: ~USD 2 billion per year Source: OECD PINE database
- 8. Subsidies to activities with significant environmental footprints are large, and costly • Fossil fuel production and consumption: at least USD 400 billion per year, globally. (Varies significantly, in line with int. energy prices) • Water use and treatment: around USD 450 billion globally in 2012, according to the IMF • Agricultural production: around USD 100 billion in support considered potentially environmentally harmful provided by OECD countries in 2015 • Fisheries: estimates vary, from almost USD 7 billion a year for the OECD to USD 35 billion (including fuel subsidies) a year globally. – While data exist on support measures for the fisheries sector, those are, at this stage, not yet classified according to their potential impact on the environment • Others: subsidies that favour the extraction of primary (non-energy) minerals and metals production, and e.g., tax policies that encourage the provision of company cars and fuel credit cards in lieu of cash • Finance for biodiversity (i.e. for conservation and sustainable use): estimated at approx. USD 50 billion a year, globally
- 9. Trends in potentially environmentally harmful agricultural support Source: OECD Secretariat calculations based on OECD PSE/CSE database, 2016 OECD agricultural support to farmers by potential environmental impact 0 50000 100000 150000 200000 250000 300000 USD mn Most harmful Least harmful Other Potentially most environmentally harmful support
- 10. Trends in budgetary support to fisheries 2009-2015 Percentage of gross value landings Source: OECD FSE database Currently covers 26 OECD countries and: Colombia Costa Rica Lithuania China Indonesia Argentina Chinese Taipei
- 11. Biodiversity-relevant bilateral ODA Source: OECD CRS database
- 12. 1. Insights and lessons learned 2. Key obstacles to environmental policy reform and biodiversity examples 3. Evolution of the pesticides tax and the pesticides savings certificate in France 4: Agricultural policy reform in Switzerland 5: EU payments under the Fisheries Partnership Agreements for marine conservation in Mauritania and Guinea Bissau 6: ITQ and resource rent tax for fisheries in Iceland The Political Economy of Biodiversity Policy Reform Key barriers to effective policy reform: • Potential competitiveness impacts • Distributional implications • Vested interests • Political and social acceptability Barriers to effective biodiversity policy reform and how to overcome them
- 13. 1. Seize windows of opportunity 2. Build alliances 3. Devise targeted measures to address competitiveness 4. Build robust evidence base 5. Ensure stakeholder engagement 6. Consolidate gains Enabling effective biodiversity policy reform
- 14. • There has been significantly more rigorous analysis in the field of development and medicine on what works, what doesn’t and why… Evidence-based analysis: impact evaluation and CEA Source: Karousakis, K (forthcoming, 2018), “Evaluating the effectiveness of biodiversity policies: impact evaluation, cost-effectiveness analysis, and other approaches”, OECD Environment Working Paper. Number of biodiversity-relevant impact evaluation studies by policy instrument *draft*
- 15. • Mainstreaming biodiversity at national level • Mainstreaming in agriculture, forestry and fisheries sectors • Mainstreaming in development co-operation • Monitoring and evaluating biodiversity mainstreaming Mainstreaming Biodiversity for Sustainable Development OECD (forthcoming publication, 2018)
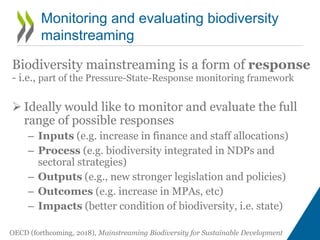
- 16. Biodiversity mainstreaming is a form of response - i.e., part of the Pressure-State-Response monitoring framework Ideally would like to monitor and evaluate the full range of possible responses – Inputs (e.g. increase in finance and staff allocations) – Process (e.g. biodiversity integrated in NDPs and sectoral strategies) – Outputs (e.g., new stronger legislation and policies) – Outcomes (e.g. increase in MPAs, etc) – Impacts (better condition of biodiversity, i.e. state) Monitoring and evaluating biodiversity mainstreaming OECD (forthcoming, 2018), Mainstreaming Biodiversity for Sustainable Development
- 17. • More ambitious biodiversity policies • Mainstream biodiversity in other policy areas and sectors • Remove and reform environmentally harmful subsidies • Scale up private sector engagement • Invest in data and indicators • More rigorous monitoring and evaluation Key messages and policy priorities OECD (2012), OECD Environmental Outlook to 2050: the consequences of inaction. ‘Biodiversity’ chapter
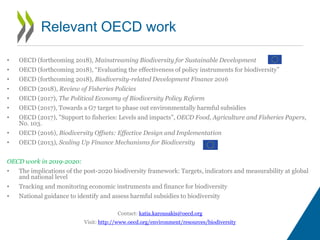
- 18. • OECD (forthcoming 2018), Mainstreaming Biodiversity for Sustainable Development • OECD (forthcoming 2018), “Evaluating the effectiveness of policy instruments for biodiversity” • OECD (forthcoming 2018), Biodiversity-related Development Finance 2016 • OECD (2018), Review of Fisheries Policies • OECD (2017), The Political Economy of Biodiversity Policy Reform • OECD (2017), Towards a G7 target to phase out environmentally harmful subsidies • OECD (2017), "Support to fisheries: Levels and impacts", OECD Food, Agriculture and Fisheries Papers, No. 103. • OECD (2016), Biodiversity Offsets: Effective Design and Implementation • OECD (2013), Scaling Up Finance Mechanisms for Biodiversity OECD work in 2019-2020: • The implications of the post-2020 biodiversity framework: Targets, indicators and measurability at global and national level • Tracking and monitoring economic instruments and finance for biodiversity • National guidance to identify and assess harmful subsidies to biodiversity Contact: katia.karousakis@oecd.org Visit: http://www.oecd.org/environment/resources/biodiversity Relevant OECD work


