Bioindicators ppt
•Download as PPTX, PDF•
89 likes•69,357 views
Bioindicators are organisms that can be used to monitor environmental health. Different types of bioindicators like plants, animals, and microbes indicate different types of pollution or environmental changes. Scientists observe changes in bioindicator populations to assess environmental conditions. This document provides examples of various bioindicator species and how they are used, including lichens for air quality, earthworms for soil toxicity, and diatoms for water acidity. It also outlines classifications of bioindicators and criteria for selecting effective bioindicator species.
Report
Share


Bioindicators ppt
- 1. BIOINDICATORS SPECIES AND THEIR USES IN BIOMONITORING CHITRA.P SECOND SEMESTER DEPT . OF ENVIRONMENT SCIENCE
- 2. BIOINDICTOR SPECIES • Bioindicators are the organism that indicate or monitor the health of the environment . • A good bioindicator will indicate the presence of the pollutant and also attempt to provide additional information about the amount and intensity of the exposure.
- 3. HOW ARE THEY USED ? • Different bioindicators are sensitive to different types of changes. • Scientists observe changes in the populations of animal and plants bioindicators to see if an environment is healthy . • Biological response of bioindicator reveals the presence of the pollutants by the occurrence of typical symptoms or measurable responses, and is therefore more qualitative .
- 4. CLASSIFICATION OF BIOINDICATORS 1) BASED ON THE AIM OF INDICATORS • COMPLIANCE INDICATORS – For e.g. fish population attributes are measured at the population, community or ecosystem levels and are focussed on issues such as the sustainability of population. • DIAGNOSTIC INDICATORS – They are used to measure on the individual or sub organism (biomarker) • EARLY WARNING INDICATORS – They focuses on rapid and sensitive response to environmental changes. • ACCUMULATION INDICATORS – They are distinguished for toxic effects bioindicator, with the effects being studied on different biological organisation level e.g. lichens , mussels etc.
- 5. 2) BASED ON THE APPLICATIONS OF INDICATORS • ENVIRONMENTAL INDICATORS – This is a species or group of species responding predictably to environmental disturbances or change (e.g. sentinels, detector, exploiters, accumulators, bioassay organisms). An environmental indicators system is an act set of indicators aiming at diagnosing the state of the environment for environmental policy making. • ECOLOGICAL INDICATORS – This is a species that is known to be sensitive to pollution, habitat fragmentation or other stresses. The response of the indicator is representative for the community. • BIODIVERSITY INDICATORS –indicator for species richness of a community. However, the definition has been broadened to measurable parameter of biodiversity including e.g species richness, endemism, genetic parameter, population-specific parameter and landscape parameter
- 6. BASED ON IUBS BIOINDICATORS ARE GROUPED INTO : •Microbial system •Plants system •Animal system •Cell biology and genetics system
- 7. MICROBIAL SYSTEM • Microorganisms are diverse group of organisms found in large quantities and are easier to detect and sample. • The presence of some microorganisms is well correlated with particular type of pollution and it serves as standard indicator of pollution. • •
- 8. Some bio indicators indicating status of aquatic systems Micro organism/bacteria Status
- 9. Bioluminescent bacteria as bioindicators • Bioluminescent bacteria: These are used to test water for environmental toxins • If there are toxins present in the water, the cellular metabolism of bacteria is inhibited or disrupted • This affects quality or amount of light emitted by bacteria • It is very quick method and takes just 30 minutes to complete but could not identify the toxin Vibrio fischeri
- 10. PLANTS SYSTEM • The presence or absence of certain plant or other vegetative life in an ecosystem can provide important clues about the health of the environment. They can be from both higher and lower classes of Plantae • Lower plants :Different plants indicate the nature of environment. The susceptibility of resistance towards a substance in the environment varies with species. For e.g lichens • Higher plants :Various groups of higher plants serve as bioindicators. Sensitive species are employed to detect and monitor specific air pollutants. Studies on higher plants are more specified on its ability to indicate the heavy metal pollution in water.
- 11. LOWER PLANTS • Lichens are alga and fungi living symbiotically (they have to live together to survive) Lichens can live in extreme conditions, but they hate pollution The cleaner the air the bigger and more elaborate the lichen. So by looking at the lichens growing in a certain area you can tell how bad the air pollution is
- 12. • Changes in Diatom community , decrease in plankton algae and aquatic hydrophyte indicated increased water acidity . Specific changes in aquatic flora can indicate the pH of the fresh water correctly .
- 13. HIGHER PLANTS • The chlortic flakes of pine needle are good examples of ozone damages. The collapse, glazing and bronzing of leaf cells are products of damage by peroxyacetyl nitrate (PAN). • Caesalpinia pulcherrima and grass (Cyndon dactylon) was evaluated as the bioindicators of heavy metals such as the Lead (Pb), Copper (Cu), Cadmium (Cd), Manganese (Mn), Zinc (Zn), Chromium (Cr) and Nickel (Ni)
- 14. • Abundance of Eichhornia indicates sewage and heavy metal pollution of water . • Equisetum spp. Indicate the presence of gold in the soil. • Annual weeds and short lived perennials like Amaranthus, Chenopodium and Polygonum etc. grow better in overgrazed areas. They are the indicators of overgrazing .
- 15. ANIMAL SYSTEM • An increase or decrease in an animal population may indicate damage to ecosystem caused by pollution. • In addition to monitoring the size and number of certain species, other mechanisms of animal indication include monitoring the concentration of toxins in animal tissues, or monitoring the rate at which deformities arise in animal population.
- 16. • Earthworm density and biomass are strongly influence by contamination. Therefore the earth worm is used as bioindicator to determine acute toxicity. • Frogs are considered accurate indicators of environmental stress and the health of biosphere as a whole. • Fish is a good indicator of water pollution . • Macro invertebrates are often used as bioindiacators because they are very sensitive to pollution, excess nutrients, increased turbidity, chlorine, etc.
- 17. CELL BIOLOGY, GENETICS SYSTEM • Cellular and sub-cellular components, including chromosomes, adapted to specific environmental conditions, form an excellent parameter for bioindicator. • Many animals show behavioural responses following the detection of environmental changes in the functioning of endocrine, nervous, muscular, cardiovascular and excretory systems. • Such changes may be investigated at morphological, biochemical or physiological levels and can indicate the presence of toxic substances
- 18. Criteria for selecting bioindicator • Sensitivity – dose responsiveness to specific stressors . • Specificity – responds to specific stressors • Broad Applicability – over temporal and spatial scale . • Representativeness – role as surrogate for other responses . • Cost – reasonable for available resources and scope of study .
- 19. Bioindicator and biomonitoring • Bioindicators qualitatively assesses biotic responses to environmental stress (e.g., presence of the lichen, indicates poor air quality) while biomonitors quantitatively determine a response (e.g., reductions in lichen chlorophyll content or diversity indicates the presence and severity of air pollution) • Chemical measurement of pollutant area is like snapshot of that that area while biological measurement is like taking video tape. • Bioindicators actually indicate the general toxicity of the environment , without telling the exact quantity of the toxicity .
- 20. Why Are Bioindicators Better Than Traditional Methods? • Scientists have traditionally conducted chemical assays and directly measured physical parameters of the environment (e.g., ambient temperature, salinity, nutrients, pollutants, available light and gas levels), whereas the use of bioindicators uses the biota to assess the cumulative impacts of both chemical pollutants and habitat alterations over time. • Bioindicators have the ability to indicate indirect biotic effects of pollutants when many physical or chemical measurements cannot. • Through bioindicators scientists need to observe only the single indicating species to check on the environment , they don’t have to monitor whole community.
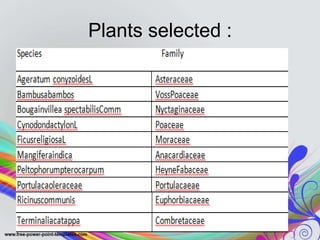
- 21. CASE STUDY- Roadside Plants as Bio-indicators of Urban Air Pollution A.P Deepalakshmi et.al • Case study describes about air pollution tolerance among roadside plants exposed to varying degrees of vehicular pollutants. • Evaluation of air pollution tolerance index (APTI) of 10 selected wild plant species was carried out to assess their response to ambient levels of air pollutants along the busy roadways of Bangalore. • Four parameters namely total chlorophyll, ascorbic acid, pH of leaf extract and relative water content were determined and computed together to signify air pollution tolerance index (APTI) of plants.
- 23. Fresh leaf samples of these plants were collected and analysed for the following parameters:- • Total chlorophyll :- It was determined by applying formula . TCh = 20.2(A645)+8.02(A663)xV/(1000x W • Ascorbic acid :- It was determined by formula AA = IxSxD/Ax1/W • Relative Water Content :- it was determined by formula RWC = (F–D/T-D)x100 • pH of the leaf samples :- pH was determined after calibrating pH meter using buffer solution • APTI :- APTI = AA(TCh+pH)+RWC/10.
- 24. RESULT. • The observed significant reduction in total chlorophyll, ascorbic acid and relative water content showed inverse relationship with traffic density. • Similarly, pH of leaf extract followed an exponential decrease with increase in traffic density and drifted towards acidic range. • Comparison of APTI values from control to polluted sites revealed maximum reduction in Bougainvillea spectabilis while least change was noted in Peltophorum pterocarpum. .
- 25. • While Peltophorum pterocarpum and Portulaca oleraceae are tolerant species since they have shown least per cent reduction in APTI • Among the plants studied maximum net per cent reduction of APTI over control was seen in Bougainvillea spectabilis and Ageratum conyzoides and are considered to be sensitive species
- 26. CASE STUDY -CONCLUSION • Air pollution has been considered as a potential selection force for plants, therefore the species growing in such adverse roadside environment present the best material to ascertain the levels of susceptibility rather than drawing interpretations from measurements obtained from lab conditions. • APTI determination provides a reliable method for screening large number of plants with respect to their response to air pollutants
- 27. CONCLUSION • Bioindicator have a remarkable potential in forecasting of disasters, prevention of pollution, exploration and conservation of natural resources, all aiming at a sustainable development with minimum destruction of the biosphere • Bioindicator can be applied in predicting the impact of anthropogenic activities particularly pollutants and predicting environmental change in a timely manner.
- 28. REFERENCE • Burger, Joanna. Bioindicators :- Types, Development, and Use in Ecological Assessment and Research. Environmental Indicator.2006. Pg. 22-39. DOI: 10.1080/15555270590966483 • Deepalakshmi, A.P et.al. Roadside plants as bioindicators of urban air pollution. IOSR Journal of Environment Science , Toxicology and Food Technology (IOSR- JESTFT). VOL-3 Issue -3 . March- April-2013. Pg 10-14. • Gerhart ,a. Bioindicator species and their use in bioindicatoring. Environmental monitoring vol-1 http://www.eolss.net • Haeba, Maher.et.al. Earthworm as bioindicator of soil. Environmental and Analytical Toxicolgy. 2013. http://dxdoi.org/10.4172/2161052910000189 . • Holt, Emily A. Miller, Scott W. 2010. Bioindictors: Using Organisms to Measure Environmental Impacts. Nature Education Knowledge. 3(8) 10 • Indicator organism. http://en.wikipedia.org. • Odonker ,Stephen T. Ampofo , Joseph K. Escherichia coli as the indicator of bacteriological quality of water: an overview . microbiology research 2013. Pg 5-11. doi:10.4081/mr.2013.e2 • Plant Indictor: Characteristic, Type and Physiological Changes . 2013. http://www.biologydiscussion.com • Saulovk , Durdija. Blocanin, rade. Rodriguez , bibiana . BIOINDICATORS IN HUMAN ENVIRONMENT .Pg 140-147 • Sharma, P.D . Ecology and Environment . 11TH ed. Pg 574-571. Merrut . rastogi publication. • http://staff.concog.org • http://en.wikipedia.org •